
It Finally Happened

Investors,
One of the key signals that I’ve been waiting 6+ months for just flashed.
But it’s hidden in plain sight and no one else is talking about it because it’s so basic.
It’s a signal that pertains to Bitcoin, which means that the audience will be bifurcated.
Some of you will have no use for this analysis… and that’s totally fine.
Some of you will be dying to see this analysis… and that’s also wonderful.
Before I dive into that research, this is what I’m seeing in the stock market:
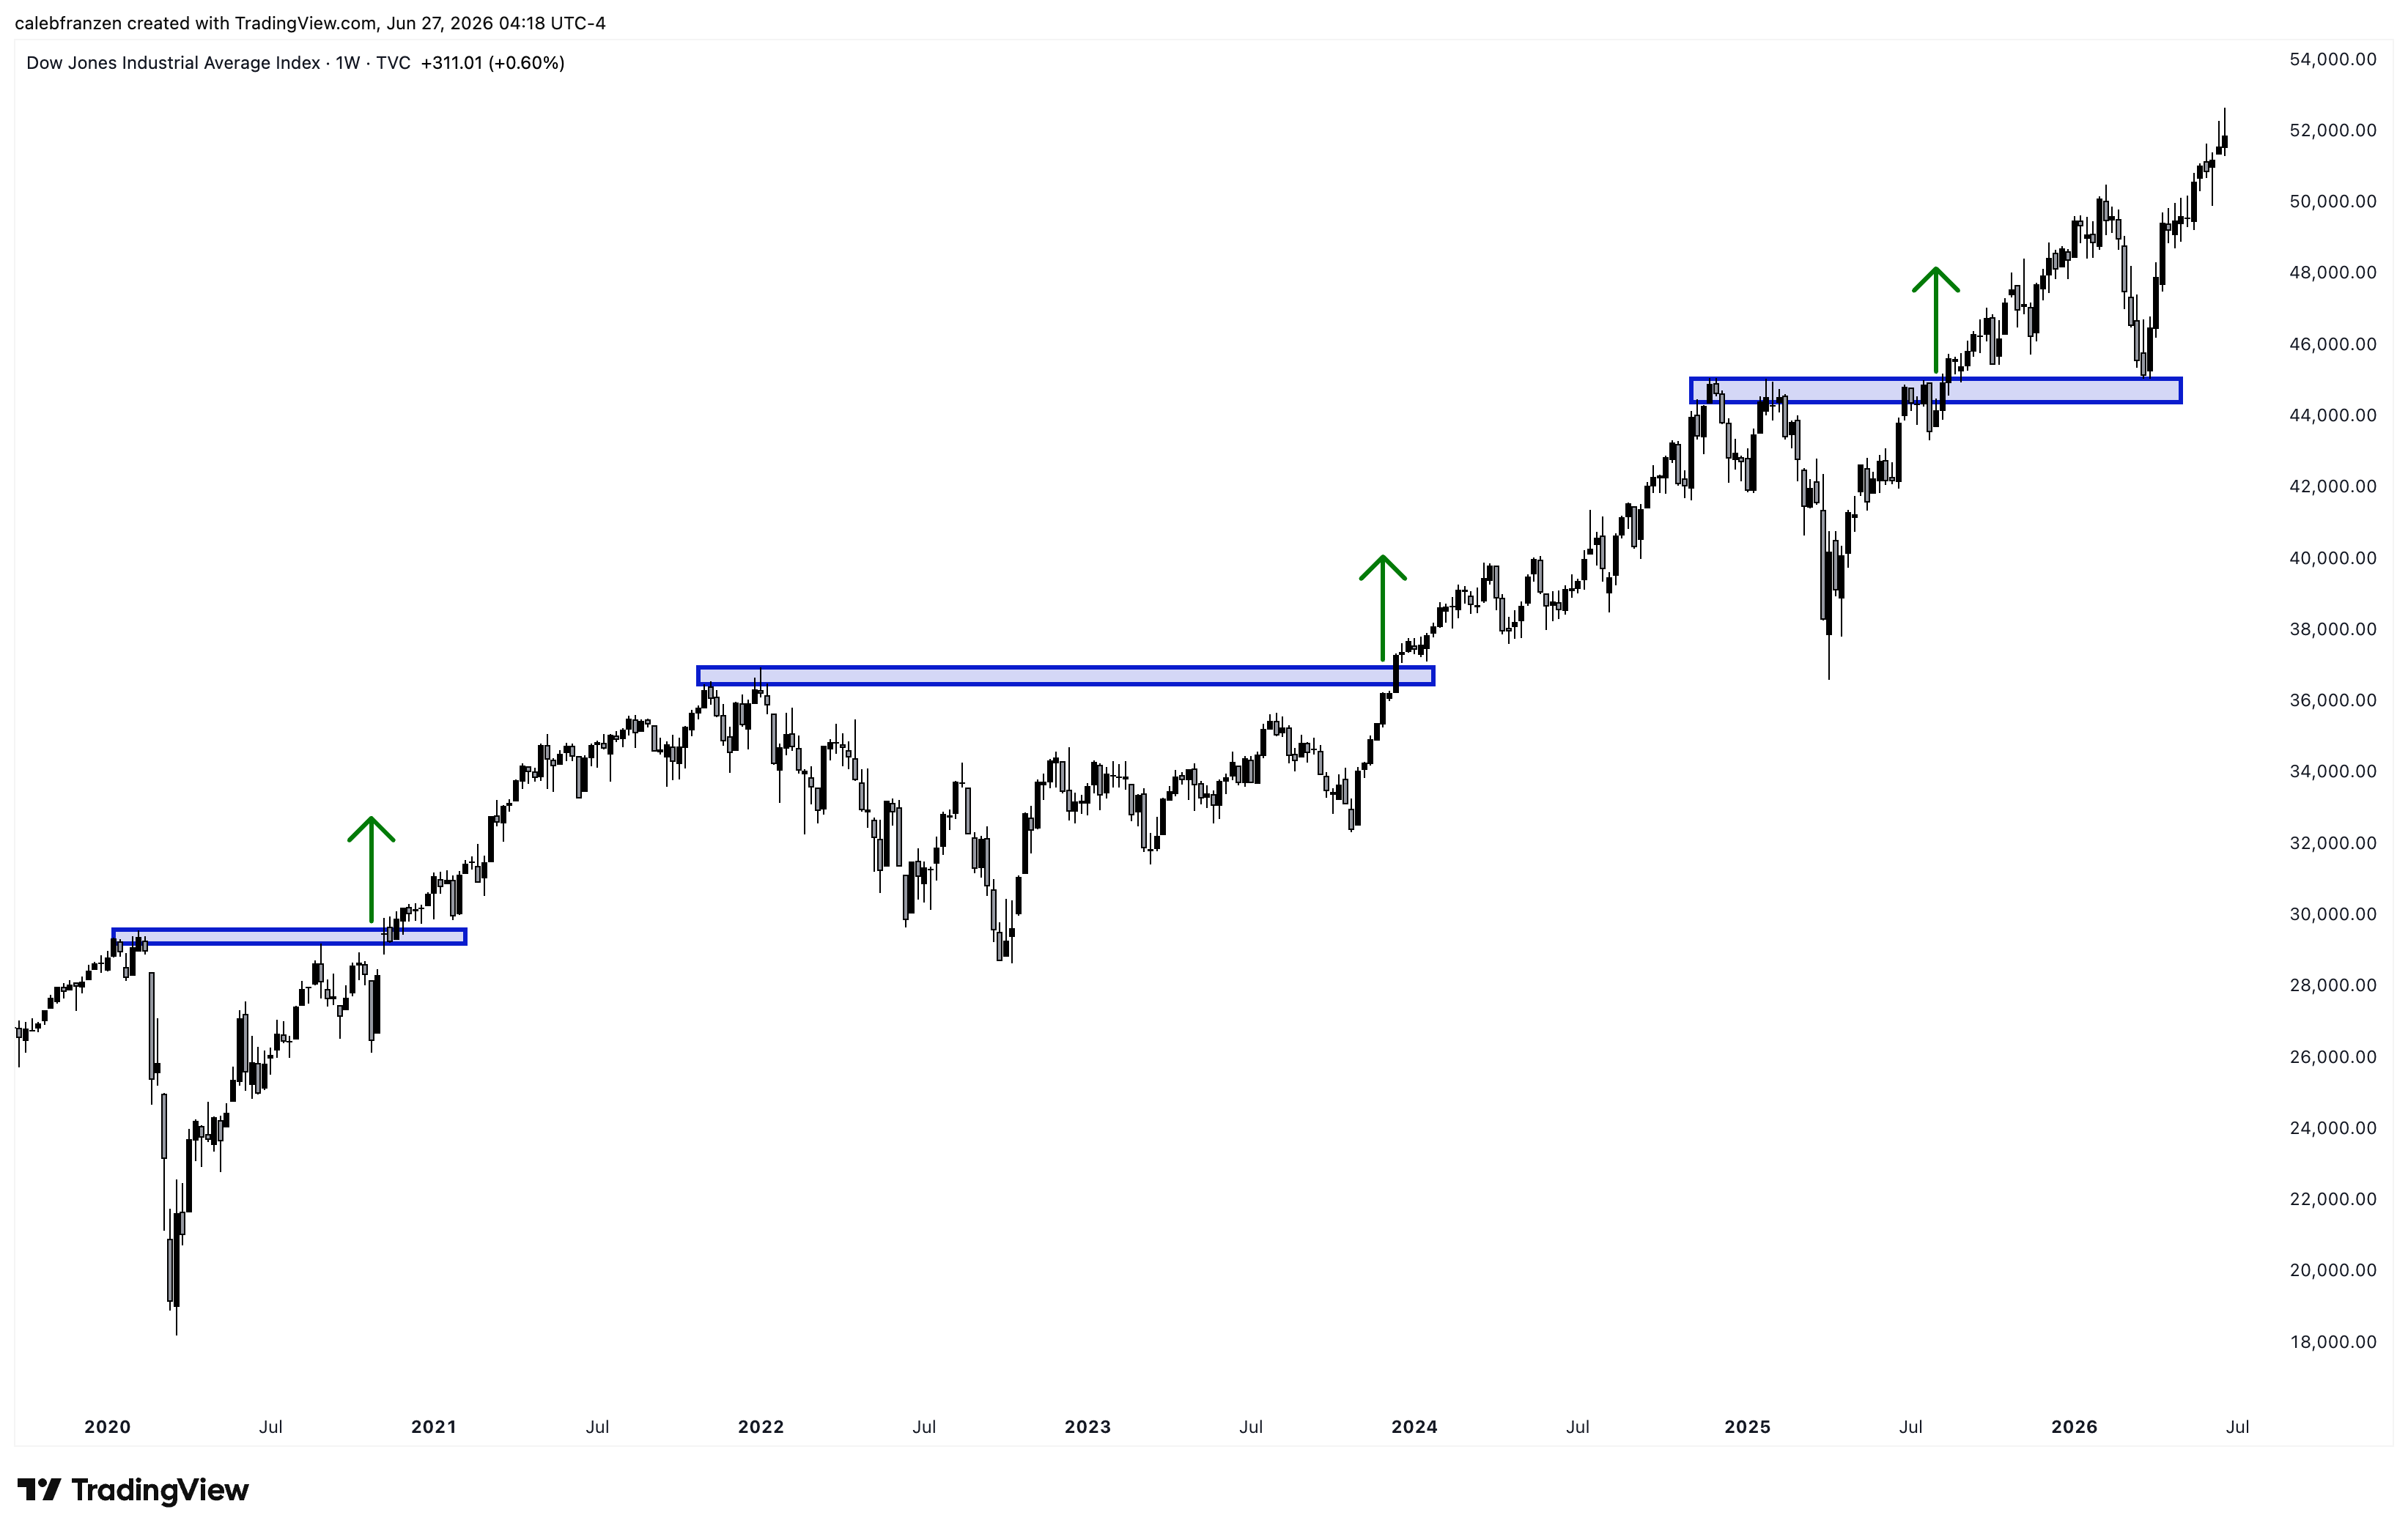
The Dow Jones Industrial Average just had its highest weekly close ever.
But all I’m seeing on social media is fear.
Does this really look like a fearful market to you?
Yes, tech is correcting.
Yes, mega-caps are correcting.
Yes, growth stocks are correcting.
Yes, communication stocks are correcting.
But I look at both the S&P 500 and the Nasdaq-100 and I see that both are still trading above their 55-day EMAs after the recent (and continued) production of all-time highs.
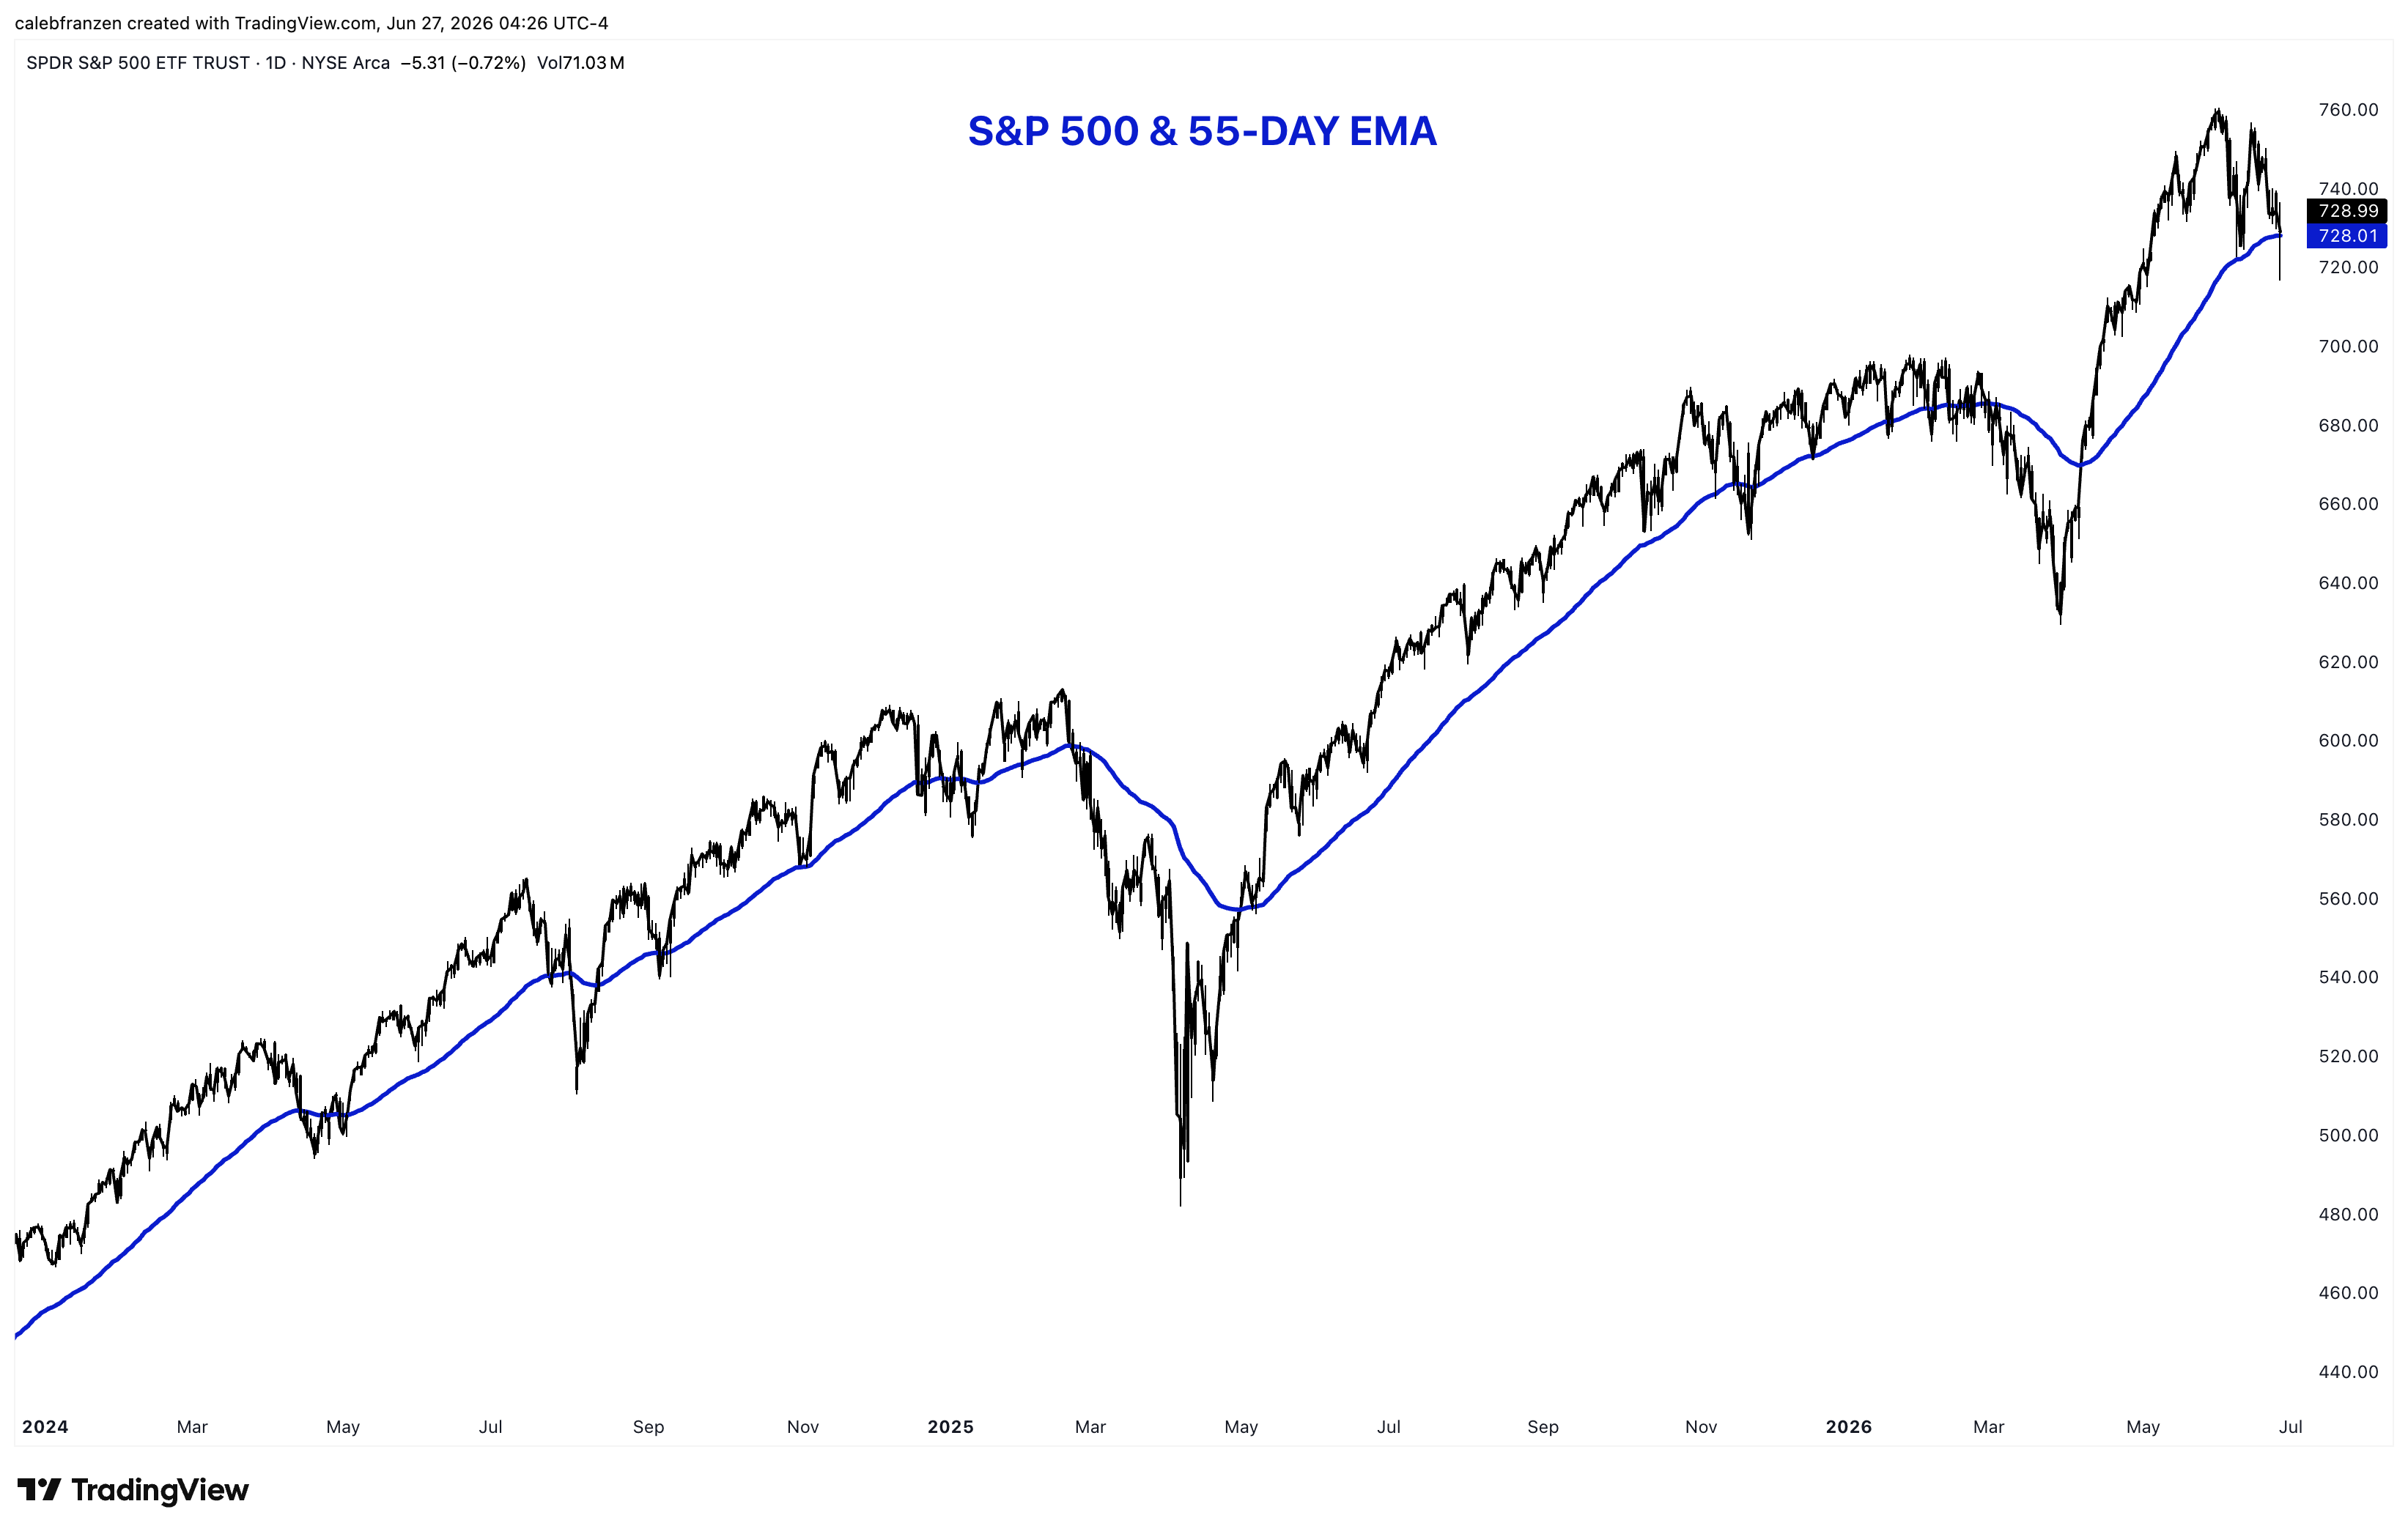
But is losing the 55-day EMA (if it happens in the coming days/weeks) really the end?
Based on the chart above going back to the start of 2024, the answer is clearly no.
The index fell below the 55-day EMA in:
April 2024
August 2024
September 2024
December 2024
January 2025
February 2025
November 2025
January 2026
February 2026
March 2026
We can justify these breakdowns as a reason to be defensive or slightly cautious.
But as soon as the index manages to get back above the 55-day EMA, the market has typically gone on to produce new all-time highs once more.
And we can prove that on the basis that the index was just at all-time highs!
Clearly, this bull market has managed to stay intact even if it loses its 55-day EMA.
The rotation that has occurred is literal evidence that the bull market is intact.
Look no further than the Russell 2000, which is at all-time highs.
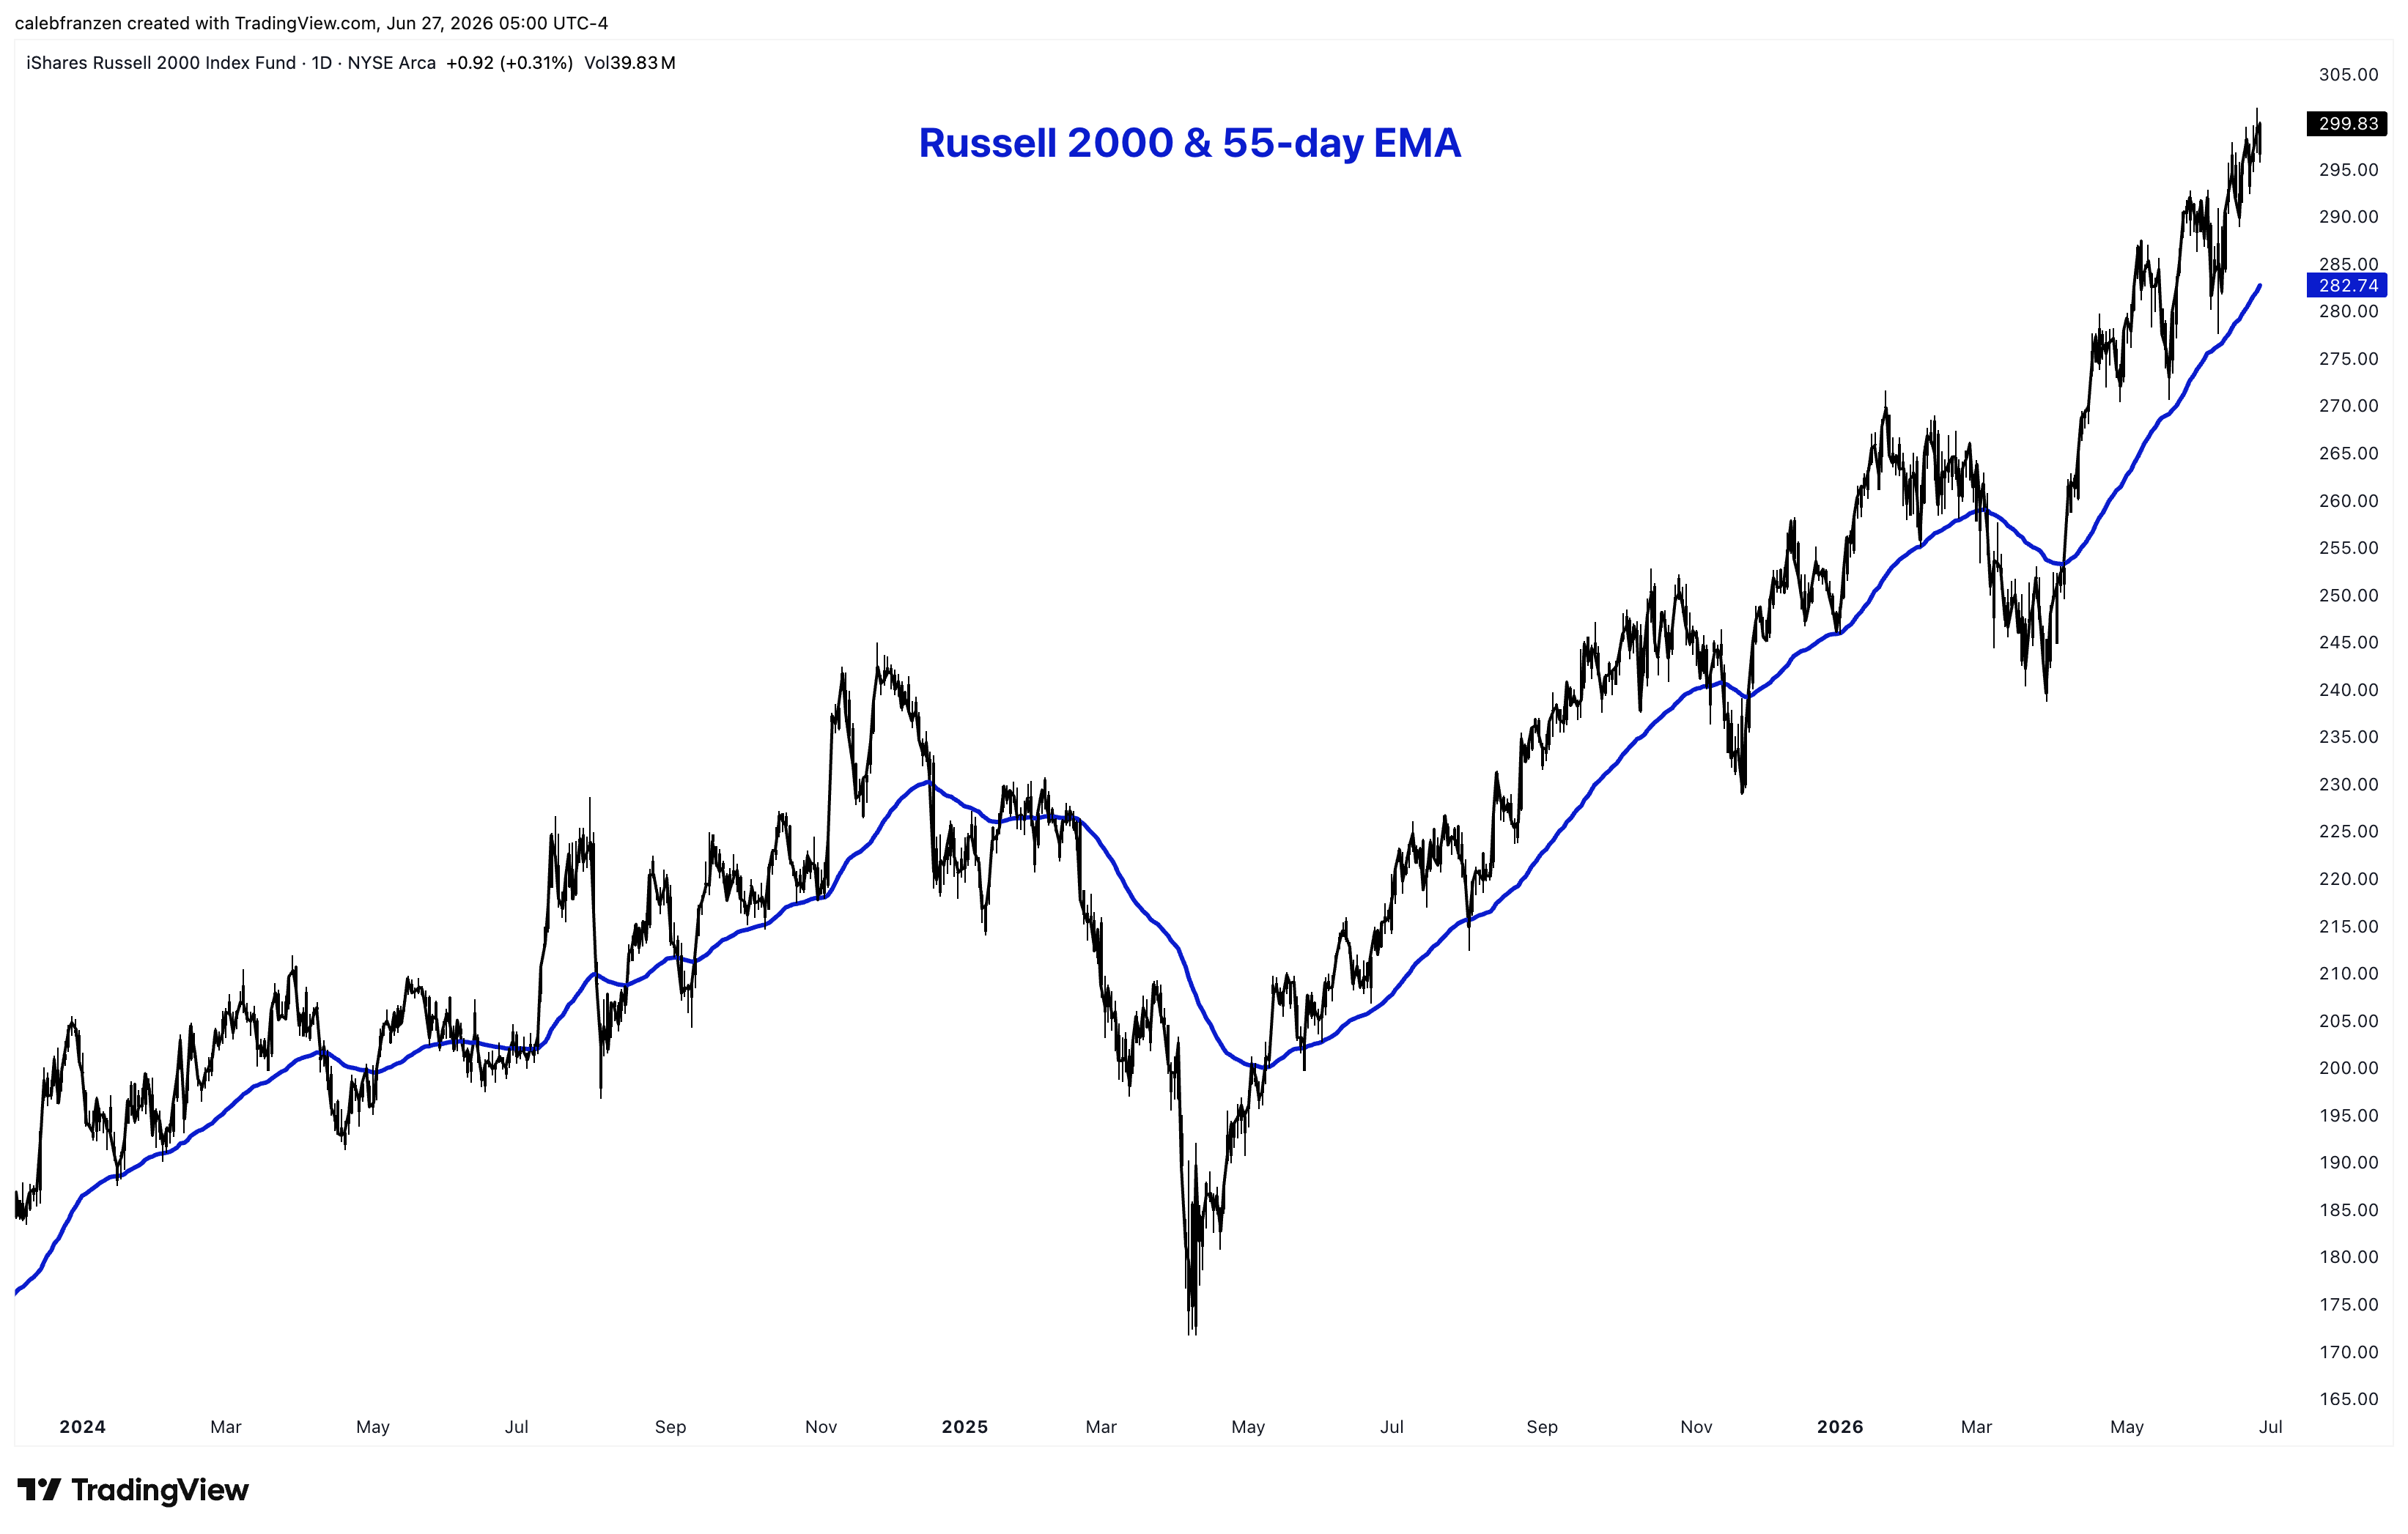
This is on the back of the expansion in banks/financials, biotechs/healthcare, and industrials, all of which are soaring. If that expansion comes at the short-term “expense” of mega-caps, tech & growth, so be it… so long as the market itself is holding up.
And the great news is that it’s absolutely holding up.
But the headlines and sentiment on social media are telling you the exact opposite…
Despite it’s flaws and inherent inefficiencies, I still like to look at the Fear & Greed Index, which is officially in the “Extreme Fear” category!
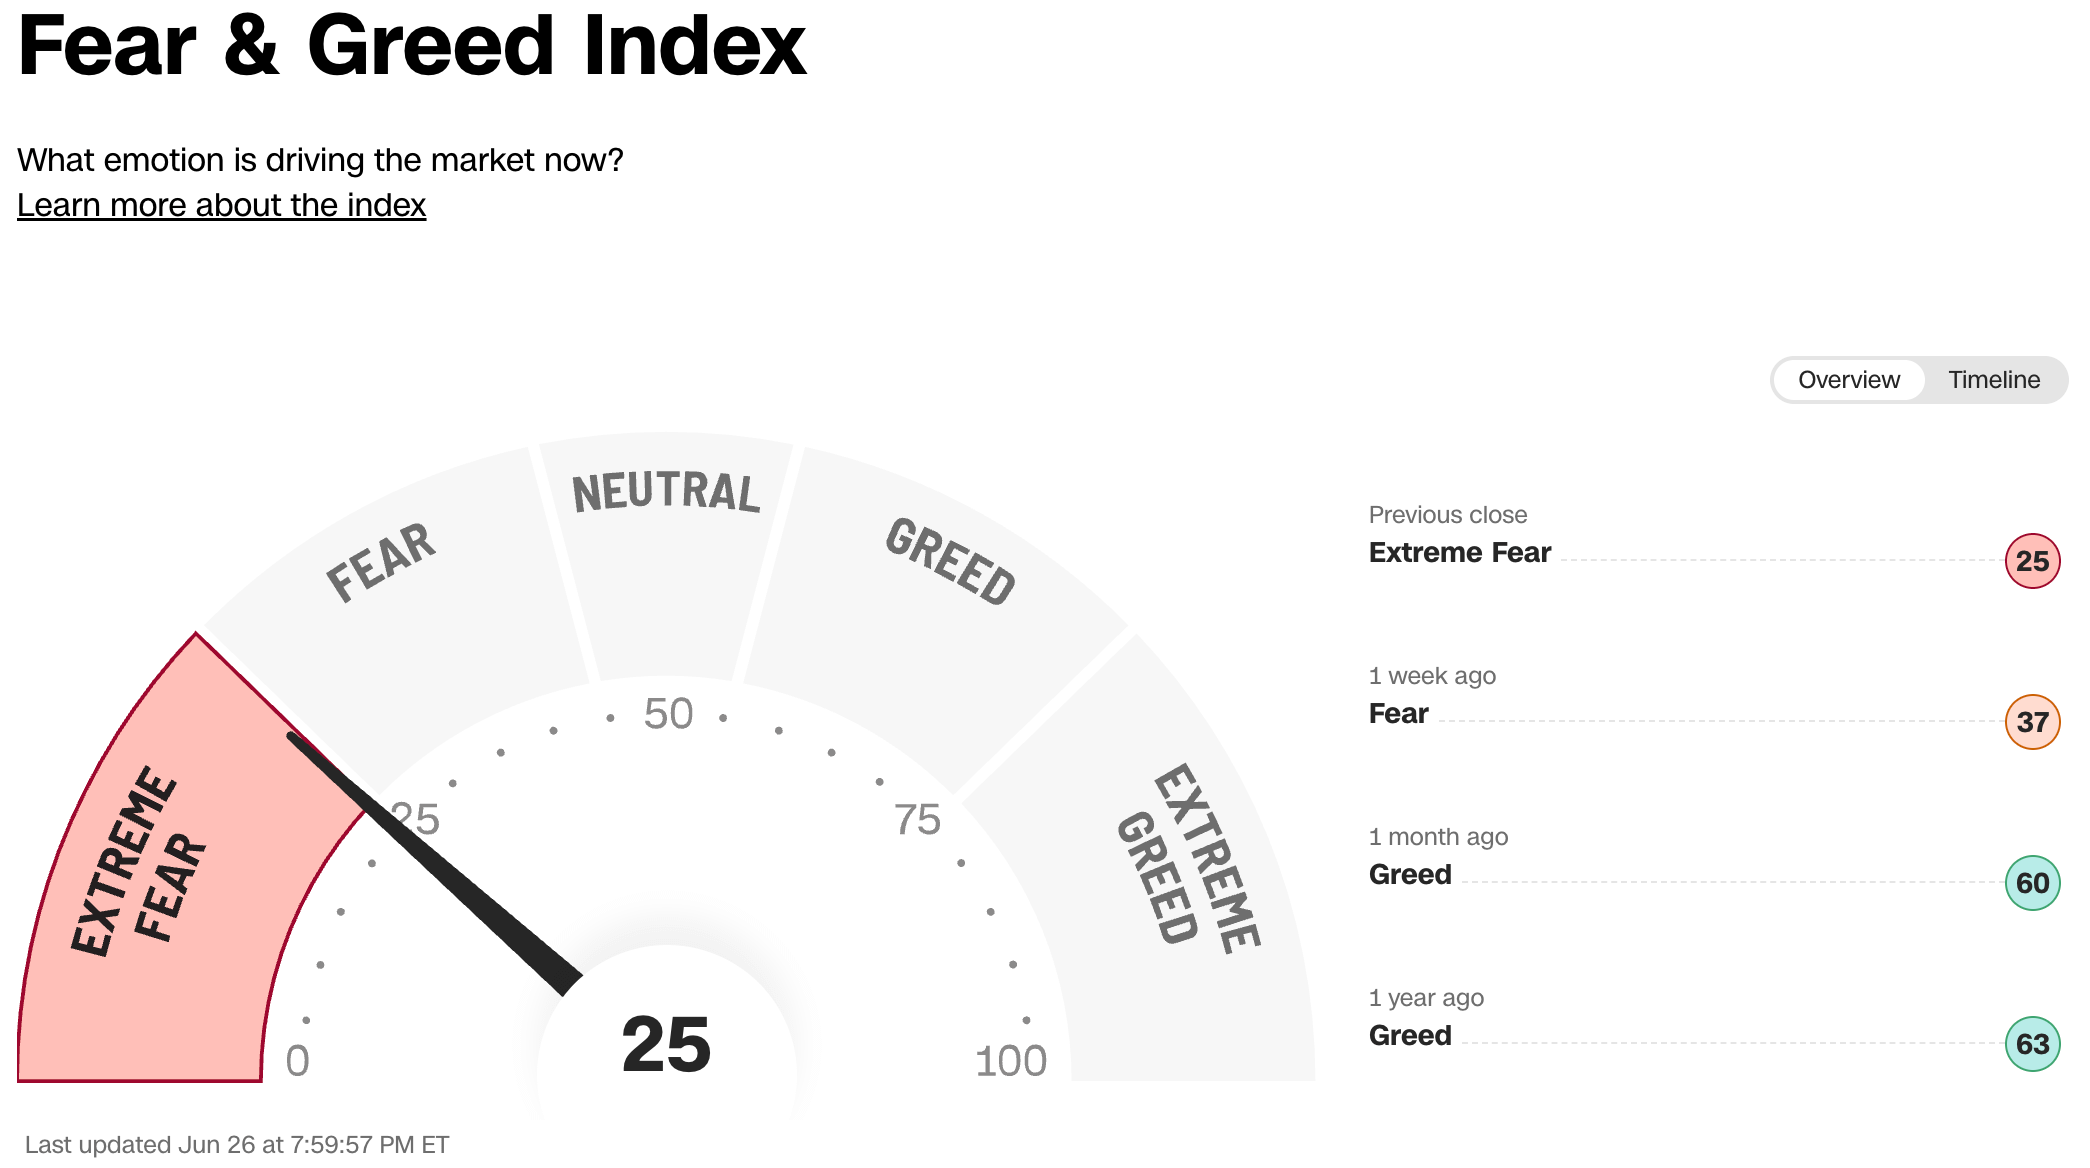
But what’s even more interesting to me is the “timeline” feature of the F&G Index:
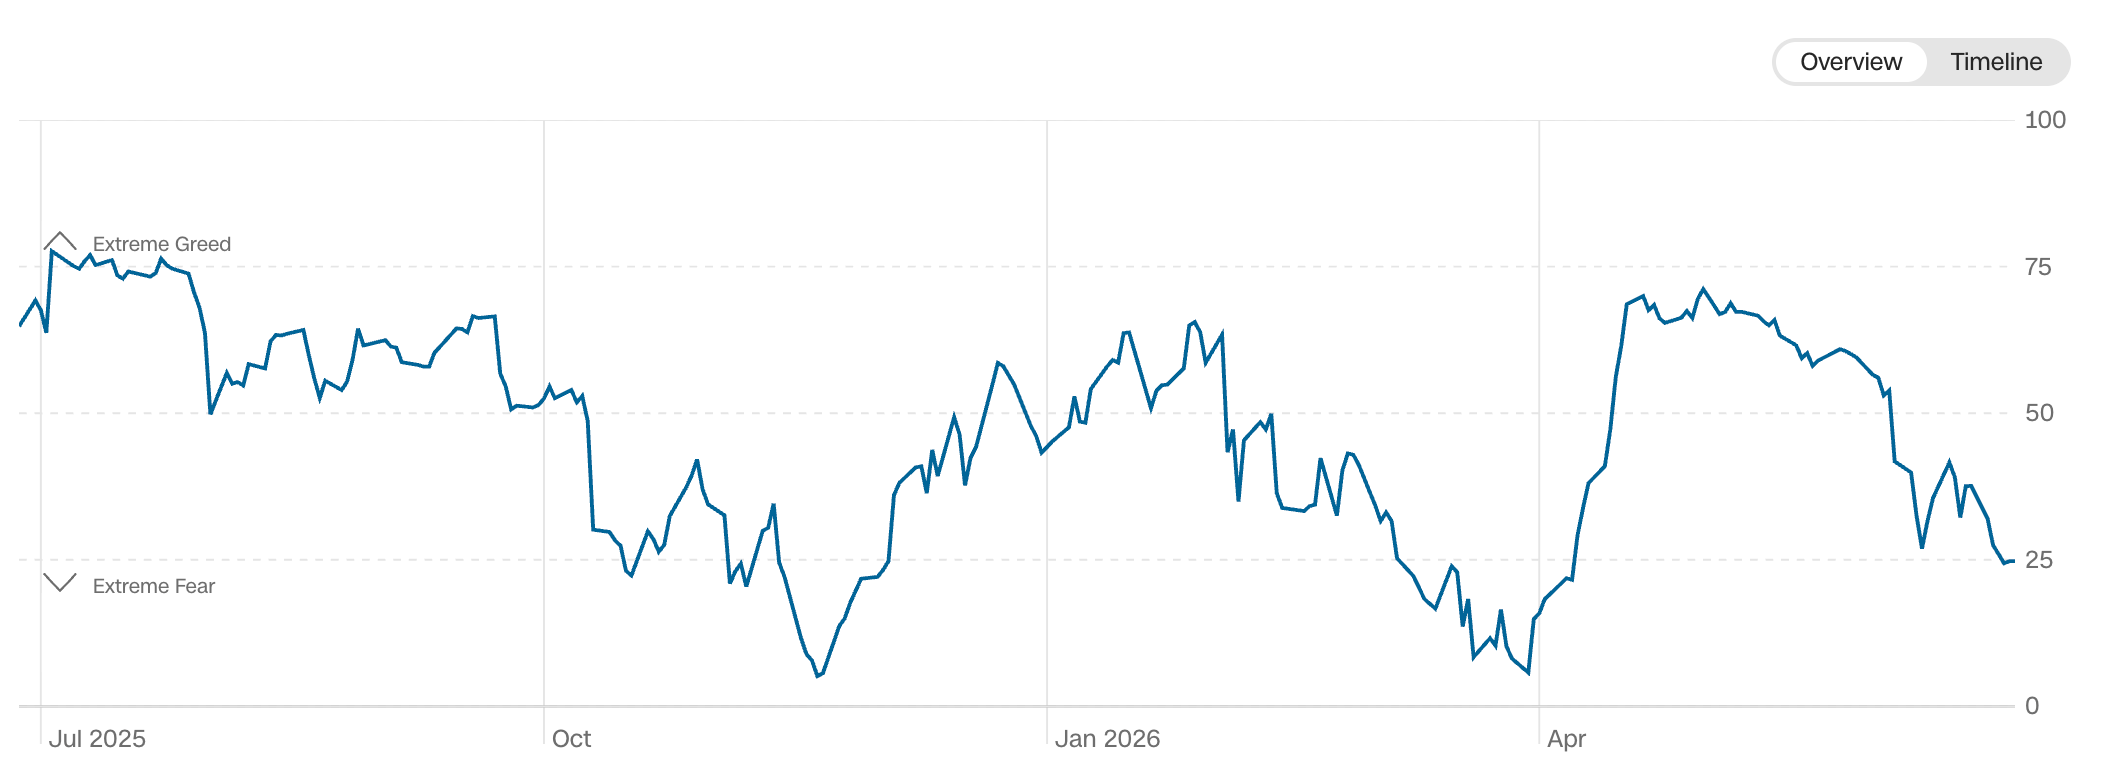
Greed peaked on May 1st, 2026…
Sentiment has rolled over, deeply, and pessimism has become widespread…
But the S&P 500 is up +1.19% during that period.
Yes, it’s a negligible gain.
But it’s a gain nonetheless.
And if this truly is a market-wide rotation, then how are the key areas performing?
The Dow Jones is up +4.6% during that period.
The Russell 2000 is up +7.36% during that period.
Industrial stocks ($XLI) are up +4.76% during that period.
Semiconductors ($SMH) are up +20.11% during that period.
Seems like a bull market fueled by disbelief to me (aka climbing a wall of worry).
Time to switch over to Bitcoin’s important signal that just flashed…