Investors,
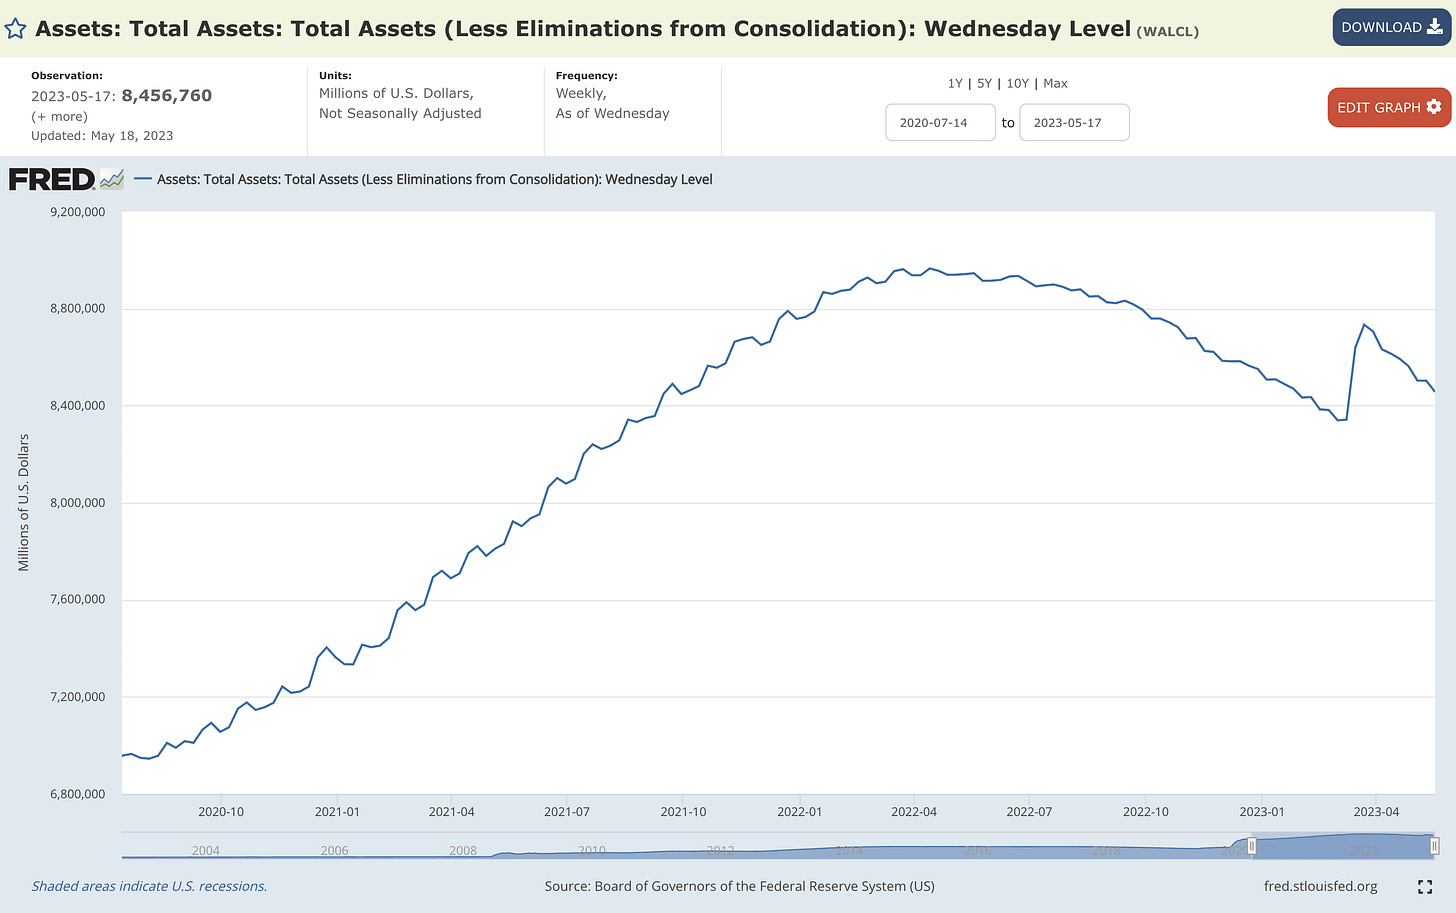
As of Wednesday, May 17th, the Federal Reserve’s balance sheet declined to $8.456Tn, marking the 8th consecutive week of declines in the aftermath of the bank failures.
While the Fed’s balance sheet hasn’t returned to the level it was before the crisis, it’s apparent that the Federal Reserve has normalized their policy and resumed balance sheet runoff. Based on the recent trajectory over the past two months, I think that the Fed’s balance sheet will reach new multi-year lows in the next 3-6 weeks.
Given the positive correlation between the Fed’s balance sheet and liquidity, which therefore impacts asset prices inversely, it’s interesting to see how equities have been able to shrug off the ongoing decline in the Fed’s assets. More specifically, since March 22nd, the Fed’s balance sheet has declined by -3.2% while the S&P 500 has gained +6.5% and the Nasdaq-100 has gained +9.8%.
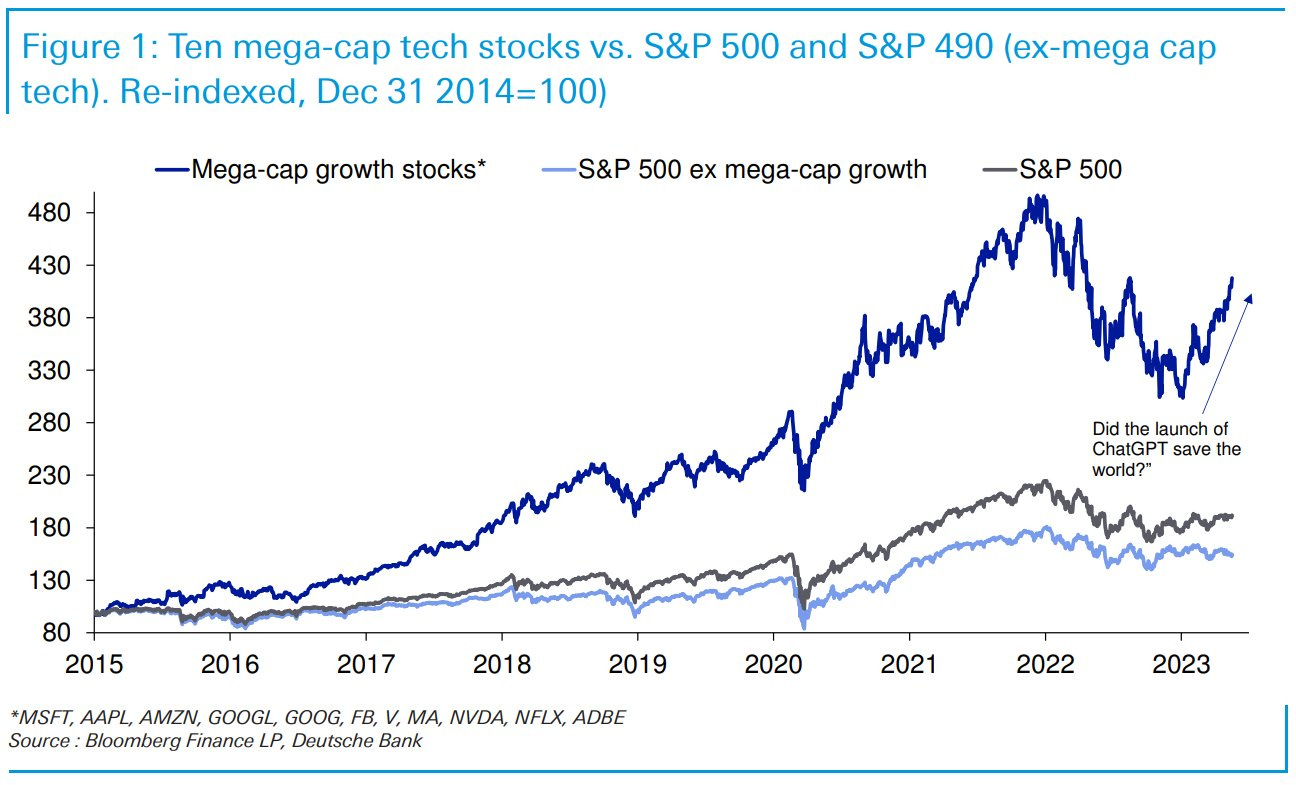
However, the equal-weighted version of the S&P 500 has returned +3.6% during this same time period, highlighting how “the rest of the market” is struggling to keep up with mega-cap tech stocks. This is best exemplified by the following chart from Deutsche Bank:
While this chart takes a long-term approach to analyzing these three aspects of the market, we can see that the S&P 500 ex mega-cap growth has struggled in recent months while mega-cap growth grinds higher at a rapid pace.
Many investors, particularly those who lean bearish, are using data like this to suggest that the market is not healthy and that leadership from the best stocks in the world is a harbinger of bad things to come. It’s hard for me to align with this perspective, simply because non-mega cap growth stocks are still doing fine in 2023. It’s not as if everything else is falling while mega cap growth is rising exponentially! Consider the YTD returns of the following sectors and industries:
Consumer Staples $XLP: +1.85%
Consumer Discretionary $XLY: +17.3%
Communications $XLC: +28%
Medical Devices $IHI: +5.4%
Basic Materials $XLB: +1.25%
Industrials $XLI:+1.6%
Transports $XTN: +8.1%
Cloud-Computing $CLOU: +9.5%
Expanded Tech Software $IGV: +22.2%
Even emerging market equities EEM 0.00%↑ are up +2.9% YTD and emerging market ex-China EMXC 0.00%↑ is up +6.2% YTD! Meanwhile, the Japanese Nikkei 225 Index hit new all-time highs this past week, up +19.7% YTD.
It’s not all sunshine & rainbows though, with the following U.S. sectors negative YTD:
Healthcare $XLV: -3.3%
Utilities $XLU: -6.25%
Real Estate $XLRE: -2.0%
Financials $XLF: -4.7%
Energy $XLE: -9.0%
As with any market environment, some sectors are working and others aren’t! It’s worth noting that many of these sectors are considered to be “defensive” sectors, designed to outperform when investors are seeking a form of safety within the equity market. With the S&P 500 up +9.2% YTD, investors aren’t seeking safety or defense!
Could this backfire? Yes. Is it reason to be bearish, in and of itself? In my opinion, no.
In the remainder of this report, I’ll cover more S&P 500 internals and share exclusive charts that investors should be aware of. I’ll also share new analysis of an interesting stock that I stumbled across on Friday evening, reviewing the qualitative and quantitative investment thesis of the company.
The stock has gained +602% over the past twenty years, versus the S&P 500’s total return of +344%. Given that the stock is extremely unknown and pays a juicy dividend above 3.5%, I thought it was worthwhile to share a full analysis of the stock and find out if it’s worth buying in today’s current market environment. I’ll be sharing conclusive thoughts in this report, backed by a thorough investigation of the fundamentals.


