Investors,
The service sector is not in a recession.
The manufacturing sector is not in a recession.
The broader macroeconomy is not in a recession.
Despite all of the pessimism we’ve heard about the manufacturing sector, which was contracting by several standard metrics, recent evidence implies that the sector is not only recovering, but thriving.
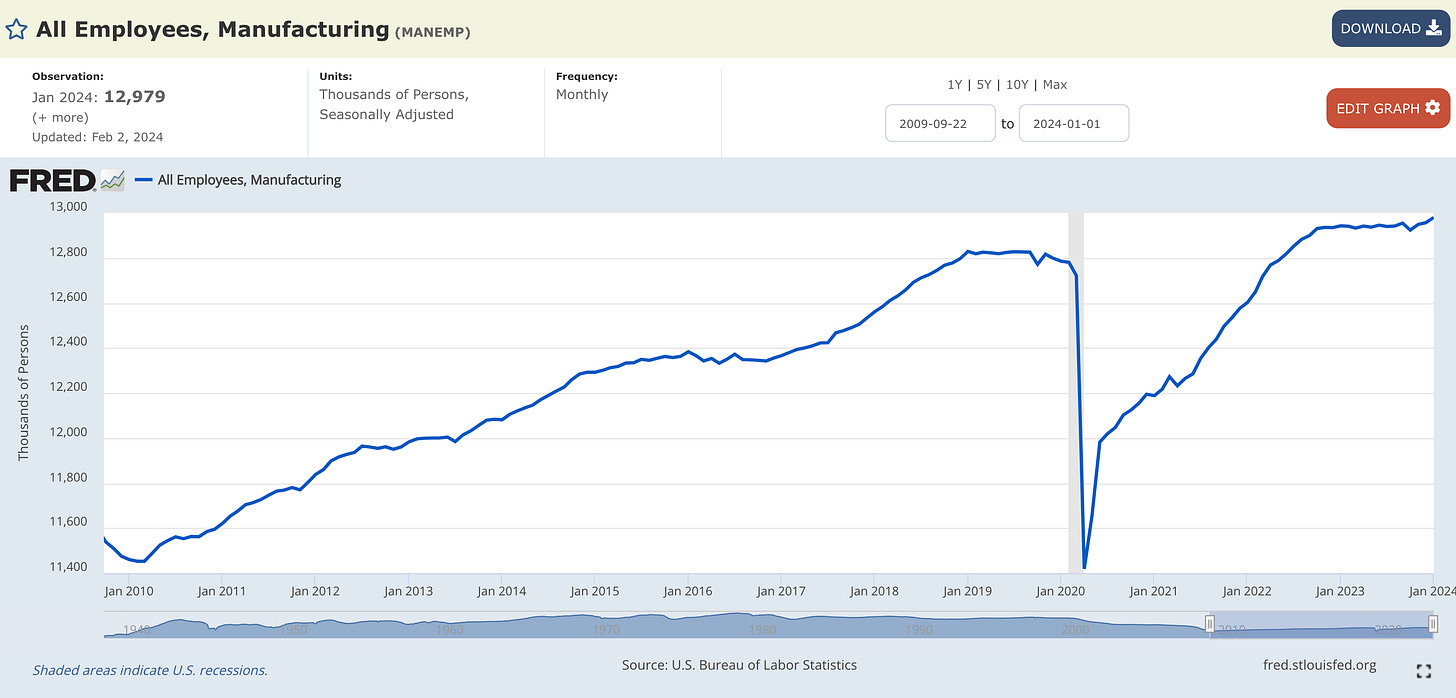
For example, it’s unequivocally a positive sign when the total amount of employees in the manufacturing sector hits new 15-year highs after a period of treading water.
Even during the sideways trend from Q4’22 to Q4’23, the amount of employees in the manufacturing sector never experienced a notable decline. If the manufacturing sector was in a recession, wouldn’t the companies in this sector be laying people off?
Quite simply, this isn’t recessionary behavior!
During the Great Recession, we see a clear decline in manufacturing headcount:
Therefore, a “stagnation” or outright increase in manufacturing jobs indicates that:
Manufacturing didn’t experience a recession in 2022 or 2023.
The broader economy didn’t experience a recession in 2022 or 2023.
Then take into consideration that total construction spending in the manufacturing sector was $213.89Bn in December 2023 & growing at a pace of +60% YoY!
Again, this isn’t indicative of a recession, in the manufacturing sector or otherwise.
On the contrary, it’s indicative of an economy that continues to be resilient & dynamic.
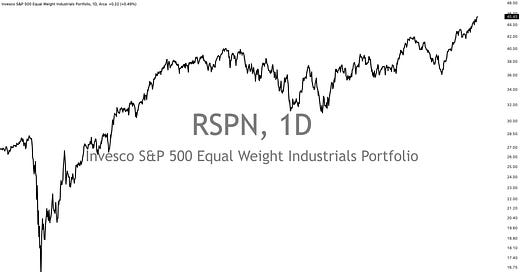
Coupled with the fact that industrial stocks (even the small caps) have been making new all-time highs since mid-2023, the market is telling us that manufacturing is okay.
I’ll share more data in the macro section below, but these datapoints deserve to be highlighted in order to reiterate & confirm that we aren’t in a recession.
Macroeconomics:
Picking up where we left off, the key manufacturing data this week (and arguably the most important macro release of the week) was the Flash PMI data for February 2024.
This isn’t the final/official data for February, but it’s the first estimate of a meaningful data series for the service sector, the manufacturing sector, and the broader economy.
The results were mixed, but all three components are in expansionary territory (x>50).
U.S Manufacturing PMI: 51.5 vs. 50.7 prior & estimates of 50.5
U.S Services PMI: 51.3 vs. 52.5 prior & estimates of 52.3
U.S S&P Composite PMI: 51.4 vs. 52.0 prior & estimates of 51.8
As I mentioned, the big takeaway from this data is that all three components are above 50, which means that the service sector, manufacturing sector, and broader economy are all expanding.
The second takeaway is that manufacturing was significantly stronger than the January data and came in higher than estimates, which were expected to come in lower than the January results.
The Flash PMI for manufacturing was the highest reading in 17 months, coupled with strong rhetoric about improving conditions. Specifically, the report from S&P Global describes the manufacturing sector as the following:
“Manufacturing firms meanwhile registered a renewed rise in production. Factory output increased for the first time in three months, and at the fastest pace since April 2023…
Goods producers signaled the steepest rise in new orders since May 2022, as customer demand improved for a second month running…
Optimism in the outlook led firms to build stocks of purchases and finished goods, as both returned to growth in February, with firms indicating the first expansion in pre-production inventories since August 2022.”
This data and the context provided within the report indicate an unequivocal improvement in the manufacturing sector and overall sentiment amongst firms.
Unfortunately, the expansion in services & the composite data decelerated while simultaneously coming in below estimates. Nonetheless, they are still expanding!
Chris Williamson, the Chief Business Economist at S&P Global, said it best:
“Sustained growth as manufacturing rebounds, accompanied by subdued inflation pressures.”
Moving on, we also received the weekly data for initial unemployment claims. Median estimates were projecting for claims of 216k, an increase vs. the prior results of 212k.
The result came in at 201k, with the 4-week moving average of initial claims falling to 215,250 vs. the prior result of 218,750! Once again, the labor market continues to flex its muscles and prove that it remains both resilient & dynamic.
Time and time again, we’ve seen pessimists & recession-callers cite the initial unemployment claims as a “canary in the coal mine” for weakness in the labor market, but each time they do this, initial claims trends lower rather quickly.
This time is no different… after listening to Doomers predict that the end is nigh, we’ve seen claims settle back towards the lower-bound of their 2-year consolidation.
Maybe they’ll get it right next time (I doubt it) or eventually recognize that the facts are contrary to their beliefs. I’d express my hope that they’ll be adaptive and change their minds, but I don’t have that hope based on their continued ability to dig their head in the sand and ignore objectively positive data & trends.
This data proves that the U.S. economy continues to remain resilient & dynamic, once again debunking the narrative that we had a recession, we’re in a recession, or that a recession is right around the corner.
Stock Market:
I don’t often talk about individual stocks, but I can’t help but address Nvidia NVDA 0.00%↑ after seeing such terrible takes this past week/year.
The stock smashed earnings, once again, despite the fact that doubters continued to grasp at straws to explain why they’d miss this time & come crashing down to Earth.
Instead, the stock gapped up +11% at the open on Thursday & finished the session up a whopping +16.4% to reach a market cap of $1.97 trillion.
So do earnings warrant such a significant reaction in the stock? Absolutely.
These results are stunning & reflect a continued ability to capitalize on a nascent & high-demand service in general compute & AI-related services. No other stock of similar size is growing at this pace. No other stock with a market cap of $500Bn is growing at this pace. They are literally in a world of their own.
Given the fact that revenue is growing +265% YoY with operating income up +984% and net income up +199% YoY, is it any wonder why the stock is up +235% YoY?
No, and it actually makes perfect sense! The company is flat out delivering on fundamentals in order to support the continued performance of the stock.
In fact, the stock is actually the cheapest it’s been since 2019, despite the fact that the stock has increased by +2,200% since the beginning of 2019!
How could this be? Rock-solid fundamentals with continued delivery on growth.
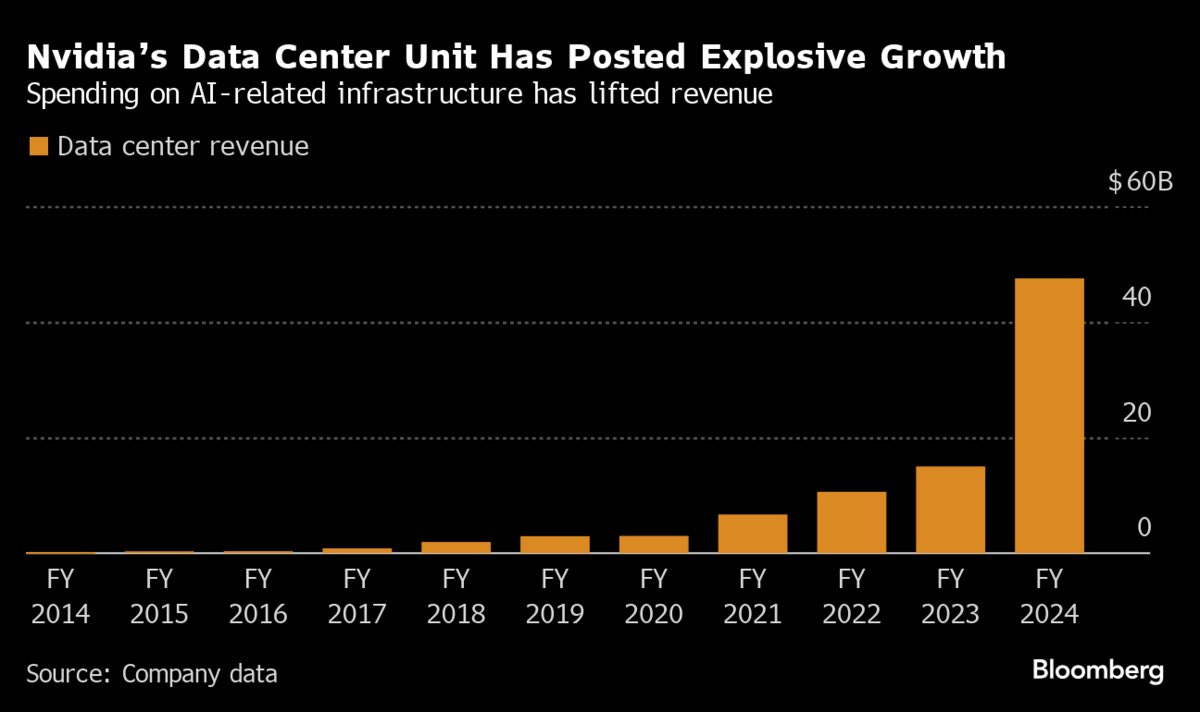
Just look at their Data Center segment:

When I first shared my long-term thesis for NVDA in 2022, the data center business (where they outsource compute power to businesses that need intense computational services) was one of the driving forces behind the thesis. While these results & the growth rate have far-exceeded my expectations, the overall trend should not be a surprise to anyone. Given the growth rate (and the well-supported expectation that it will continue to experience massive growth), I think it’s safe to slap a 10x multiple on this and determine that NVDA’s Data Center business alone is worth at least $500Bn.
Some folks don’t understand how this company deserves it’s current valuation, citing the massive divergence in market cap vs. the other chip giant, Intel Corp $INTC.
With Intel currently valued at $182Bn, NVDA is 10x larger in terms of market cap despite “only” having ~$7Bn more in quarterly revenue (INTC last reported quarterly revenue of $15.4Bn vs. NVDA’s $22.1Bn). The difference literally comes down to growth, and requires the ability to focus on projected revenue & earnings rather than past results.
For example, here’s INTC’s latest quarterly revenue report:
Instead of growing revenue at NVDA’s pace of +240% YoY, Intel is only growing revenue at a pace of +9.7% YoY. But here’s the thing… NVDA has been delivering massive revenue growth for the past year!
Here is the side-by-side comparison of revenue growth rates in the past four quarters:
Q1’23: NVDA = -13% vs. INTC = -36%
Q2’23: NVDA = +101% vs. INTC = -15%
Q3’23: NVDA = +205% vs. INTC = -8%
Q4’23: NVDA = +265% vs. INTC = +10%
They are in two completely different leagues!
On top of that, NVDA’s net income in the latest quarter was 4.6x larger than INTC’s and also growing at a significantly faster pace! At the end of the day, Intel’s stock is up +70% on a 1-year basis, highlighting how semiconductor stocks are beating expectations & delivering a tremendous amount of returns for shareholders.
Maybe, just maybe, a company who is delivering significantly stronger & faster results deserves to see their stock outperform its industry competitors…
I am not a Wall Street analyst who is going to update my own personal discounted cash flow model and tell you that NVDA is fairly valued today or that the stock will continue to experience massive upside going forward.
However, I am here to tell you that (so far) the insane performance of the stock isn’t actually insane for the people who take the time to actually analyze some basic financial results and compare them against other industry peers.
I’ve been sharing this perspective for most of the past year:
Bitcoin:
Regarding Bitcoin, I think one of the most important charts in the market right now is the ongoing bullish RSI divergence for Ethereum relative to Bitcoin (ETH/BTC):
This divergence from Q4’23 into January 2024 is what helped to provide a massive thrust in ETHBTC during the week that the spot Bitcoin ETFs were approved.
Because the market is a forward-looking pricing mechanism, investors immediately started to price in a higher probability that spot Ethereum ETFs would get approved following the approval of the BTC ETFs. For right or for wrong, that’s how markets work and that’s exactly what prompted the thrust in ETH relative to BTC.
In fact, it’s the reason why I came out on January 10th & said that ETHBTC bottomed.
Since January 9th, ETHBTC has risen +21%! In other words, the market has spoken.
Could that tone change in the near future? Absolutely. But it’s the tone right now.
I thought it would be meaningful to address my expectations for ETHBTC going forward, which is that I expect to see new highs in the coming weeks/months and a breakout above the blue zone in the chart above. That zone has acted perfectly as support and resistance over the past 8 months and it’s the key zone that we’ve grappled with over that time period. The recent rejection there in January tells me that ETHBTC should produce a higher high by breaking above this zone, providing a follow-through for the bullish RSI divergence highlighted in the chart above.
For what it’s worth, I think this is a bullish signal for Bitcoin, though it does imply that Ethereum is poised to outperform BTC in the interim.
Best,
Caleb Franzen
DISCLAIMER:
This report expresses the views of the author as of the date it was published, and are subject to change without notice. The author believes that the information, data, and charts contained within this report are accurate, but cannot guarantee the accuracy of such information.
The investment thesis, security analysis, risk appetite, and time frames expressed above are strictly those of the author and are not intended to be interpreted as financial advice. As such, market views covered in this publication are not to be considered investment advice and should be regarded as information only. The mention, discussion, and/or analysis of individual securities is not a solicitation or recommendation to buy, sell, or hold said security.
Each investor is responsible to conduct their own due diligence and to understand the risks associated with any information that is reviewed. The information contained herein does not constitute and shouldn’t be construed as a solicitation of advisory services. Consult a registered financial advisor and/or certified financial planner before making any investment decisions.
This report may not be copied, reproduced, republished or posted without the consent of Cubic Analytics and/or Caleb Franzen, without proper citation.


Great read as usual!
thanks for this article and replying my DM