I'm Buying Bitcoin
Investors,
This is a jam-packed report, analyzing the most important developments and charts from the past week. Before jumping into the data, I’m excited to introduce you to my first ever sponsorship - MicroSectors! MicroSectors is an ETN brand with a variety of solutions to gaining direct leveraged & inverse leveraged exposure to unique aspects of the market. I first came across the team behind the ETN’s, REX Shares, and the MicroSectors products when trying to find a way to directly go long on the NYSE FANG+ Index. I was getting very bullish on mega-cap tech and I wanted leveraged exposure to exercise my thesis, so I did some research and came across $FNGU. This 3x leveraged ETN is exactly what I was looking for and it was the only one of its kind.
After stumbling upon $FNGU and its inverse leveraged counterpart, $FNGD, I was amazed to see a variety of other products that MicroSectors offers, which fill unique niches in the market. Whether you’re interested in trading gold, mega-cap tech, oil stocks, or big banks, MicroSectors has bullish/bearish ETN’s to provide exposure.
I’ve gotten to know the REX Shares team over the past few months and I feel that this is the most natural fit for me in terms of a first official sponsor, especially since I’ve already been using and discussing the MicroSectors ETN’s prior to the sponsorship.
You’ll be hearing more about Rex Shares and MicroSectors in the next few editions of Cubic Analytics, and perhaps beyond!
Check them out on their website or on Twitter!
Macroeconomics:
Macro data was relatively thin this week, but there was a clear takeaway from the few reports that we received: the economy is getting constricted by the Fed’s rate hikes.
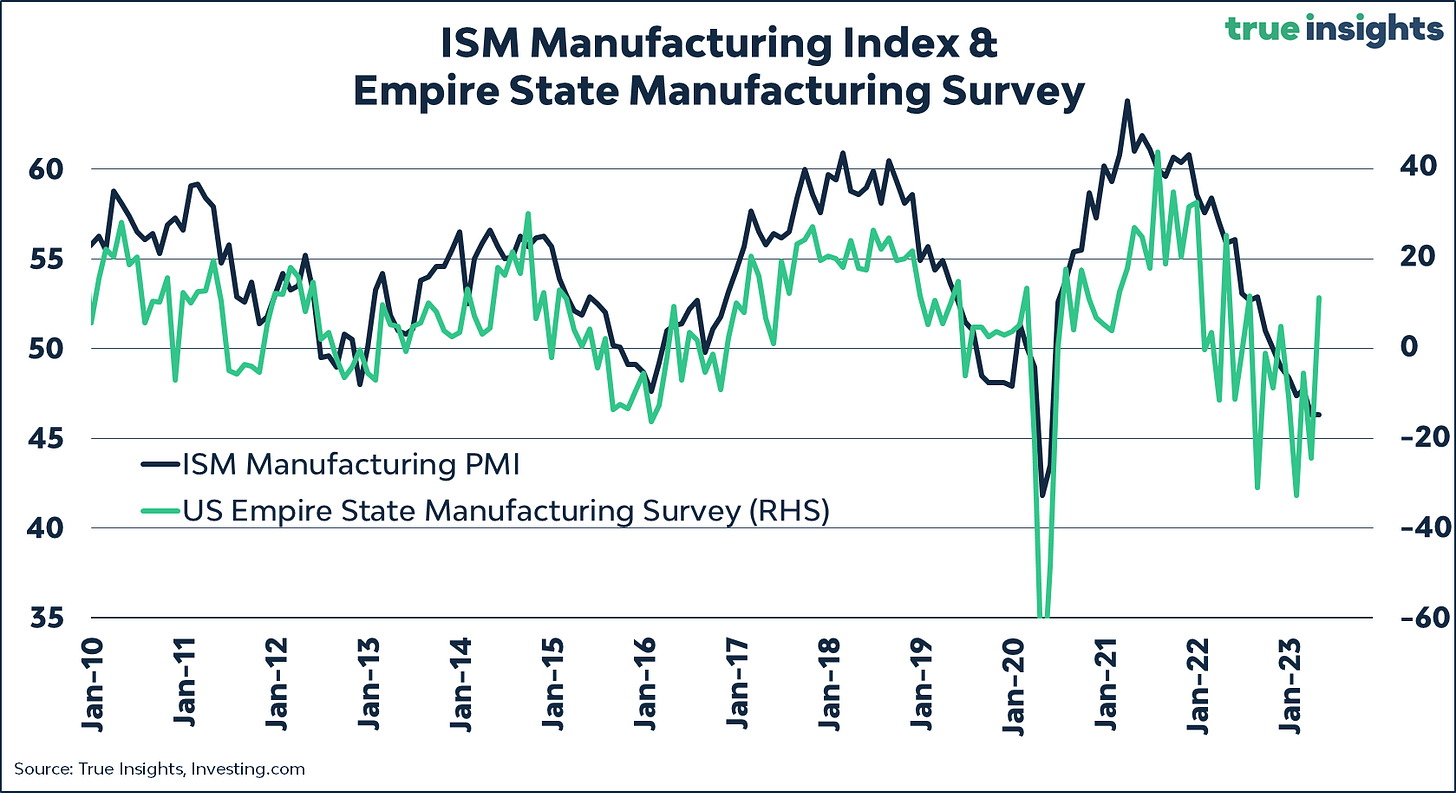
The Empire State Manufacturing Index was released for April, with a result of 10.8 vs. estimates of -18.0 and prior results of -24.6. This was a massive beat, potentially indicating some resilience in manufacturing activity. However, I wanted to highlight this great chart from Jeroen Blokland (
), which compares the Empire State Manufacturing Index with the ISM Manufacturing Index:You’ll notice that the ISM data is much smoother and less volatile than the Empire State data, which may experience head-fake improvements during a broader downtrend. My personal belief is that we’ll continue to see the ISM data, a more wholistic and representative measure of the U.S. manufacturing sector, contract in the months ahead.
We also received the Philadelphia Fed Manufacturing Survey this week, which painted a much worse picture than the Empire State Index. This survey came in at -31.3 vs. estimates of -19.2 and prior results of -23.2.
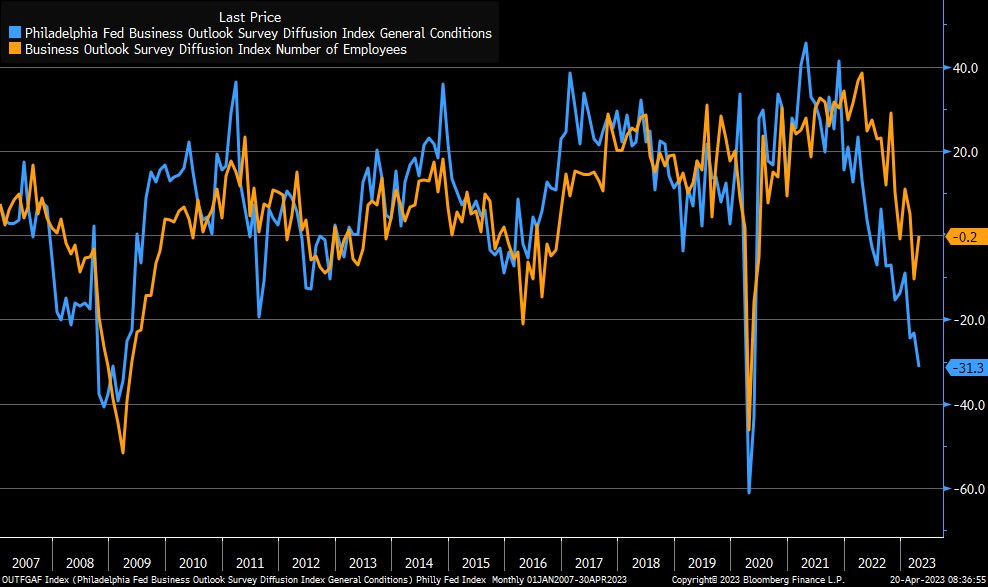
Therefore, while the Empire State data was a massive beat, the Philly data was an abysmal miss. Over the past 15+ years, the survey data was only this low during the Great Recession and the onset of COVID. To be clear, I’m not trying to say that the Philly data is more impactful than the Empire State data; however, it’s clear that we’re not seeing broad-based improvements in manufacturing.
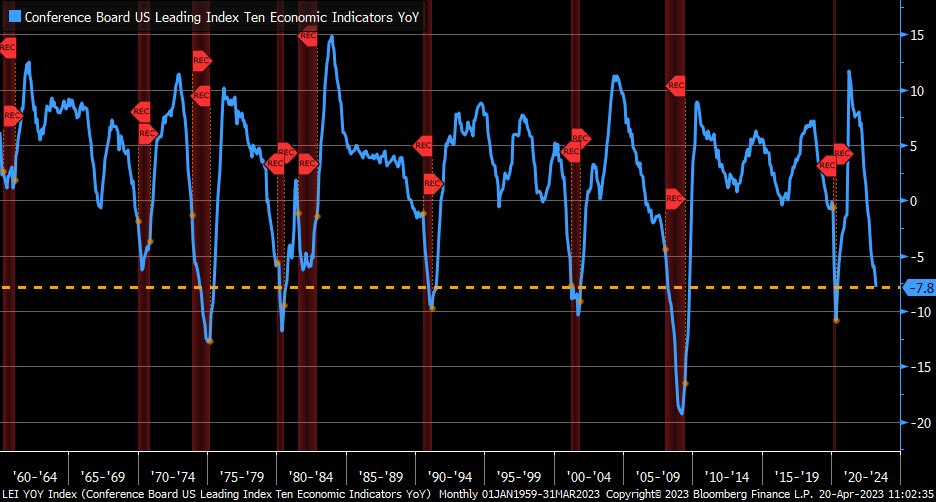
Taking this a step further, the updated version of the Conference Board’s Leading Economic Indicators was published on April 20th, contracting once again. This series continues to paint a dire picture for the U.S. economy:
“The Conference Board Leading Economic Index® (LEI) for the U.S. fell by 1.2 percent in March 2023 to 108.4 (2016=100), following a decline of 0.5 percent in February. The LEI is down 4.5% over the six-month period between September 2022 and March 2023—a steeper rate of decline than its 3.5% contraction over the previous six months (March–September 2022).
“The U.S. LEI fell to its lowest level since November of 2020, consistent with worsening economic conditions ahead,” said Justyna Zabinska-La Monica, Senior Manager, Business Cycle Indicators, at The Conference Board. “The weaknesses among the index’s components were widespread in March and have been so over the past six months, which pushed the growth rate of the LEI deeper into negative territory… The Conference Board forecasts that economic weakness will intensify and spread more widely throughout the US economy over the coming months, leading to a recession starting in mid-2023.’”
The LEI has been bleak for some time now, but the data has only gotten worse. Whenever the YoY percent change in the LEI has been this low, the U.S. economy has been in a recession. In fact, there are some recessions where the LEI didn’t even get this low (1970 & mid-1980’s)!
While the data could recover in the near future, the recent weakness in initial unemployment claims should add more fuel to the recessionary fire, based on the assumption that initial & continuing claims will cause the unemployment rate to rise. Weekly initial jobless claims jumped higher again for the most recent data, from 240k to 245k, reaffirming the idea that we’ll see weaker results for the unemployment rate in the April non-farm payroll data.
Nonetheless, the Atlanta Fed’s GDPNow forecast for Q1 2023 is projecting real GDP growth of +2.5%, so there is clearly data to suggest that underlying economic activity is still “strong enough”.
I continue to be surprised by the resilience of the broad-based measurements of economic activity, notably real GDP growth and the unemployment rate, despite the abhorrent weakness in the trenches of economic data. Nonetheless, I reiterate the expectation that I shared in my 2023 outlook, where my base-case expectation is for a recession in 2023.
Stock Market:
There’s no way around it — this was an extremely boring week for the stock market. The daily returns for the S&P 500 are indicative of this fact:
Monday: +0.33%
Tuesday: +0.09%
Wednesday: -0.01%
Thursday: -0.59%
Friday: +0.09%
On net, the index was slightly negative at -0.1% for the entire week, despite an array of important earnings reports. I actually view this as an accomplishment considering that so many regional banks reported their earnings, which could have moved the market lower if their results were worrisome given heightened concerns around the banking system. Even major banks like Goldman Sachs, Morgan Stanley and Bank of America reported earnings, but any stresses within the banking system from the shutdowns of Silicon Valley Bank and SBNY in mid/late-March weren’t apparent in Q1 operations. This shouldn’t be much of a surprise considering that the bank shutdowns occurred in the final stages of the quarter, so I think the real-time data from loans & leases provides better context about credit creation and bank health.
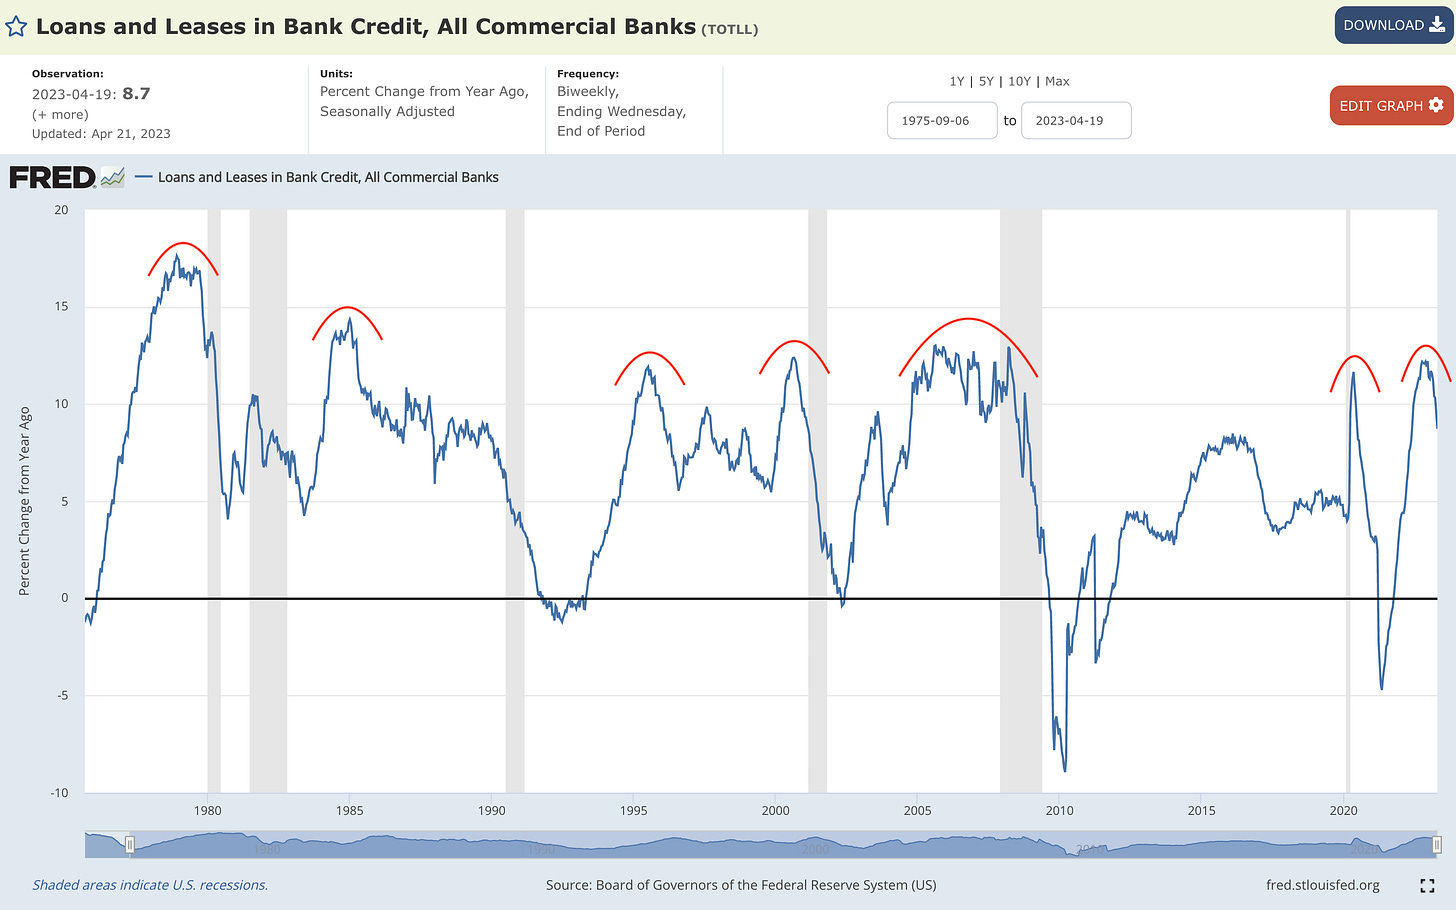
As of 4/19/23, the dollar value of all loans and leases from commercial banks in the United States was up +8.7% YoY, down from +12.2% in December 2022. There is clear & verifiable evidence that credit creation is slowing down, and I generally expect to see credit growth decelerate further in the months ahead. Typically, when loans and leases grow faster than +10% YoY and then start to roll over, credit growth continues to drag lower.
Given the pace of the recent deceleration, higher for longer interest rates, and the close scrutiny on the banking sector, I’m confident that credit growth will decelerate.
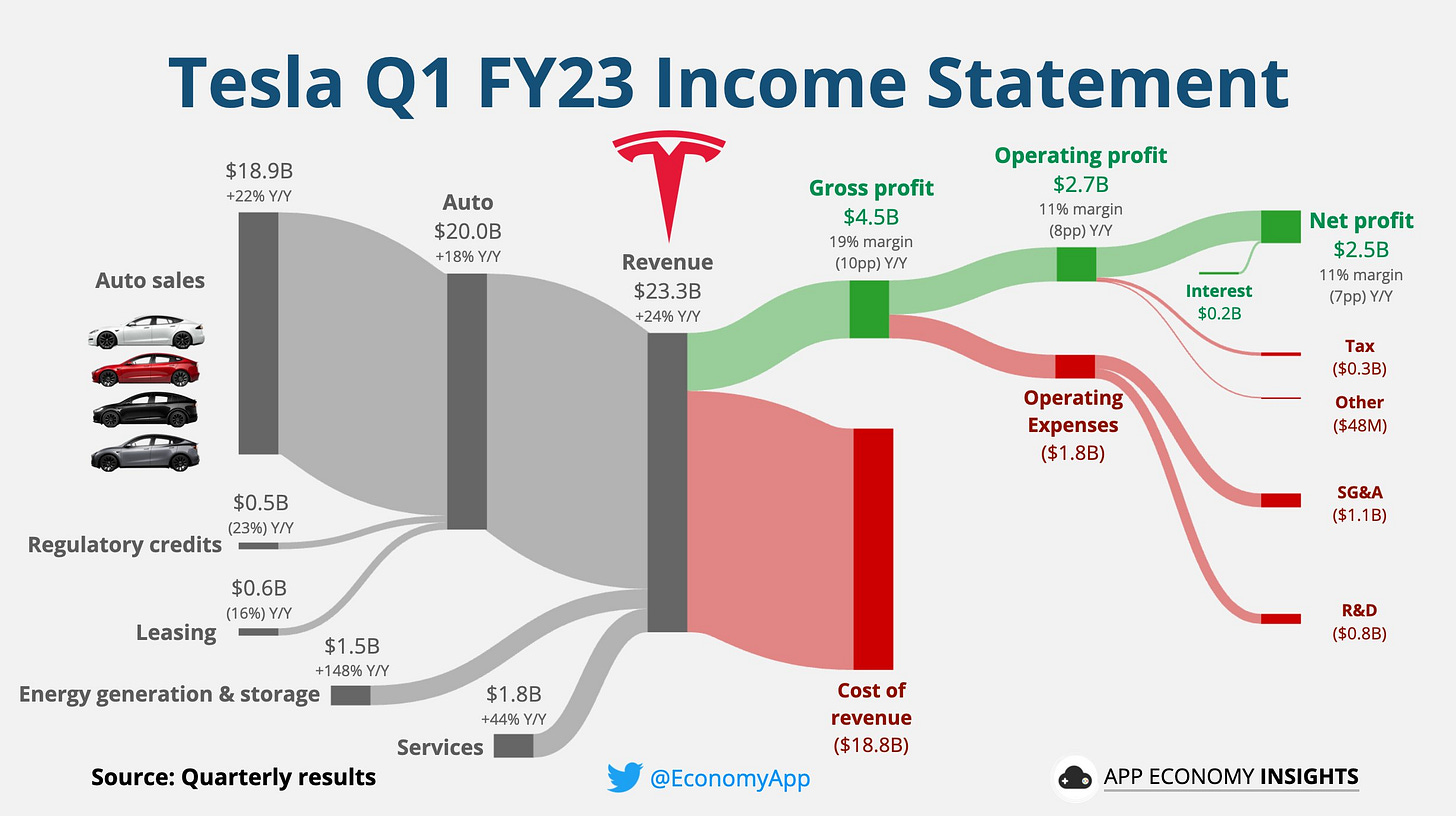
Back to overall earnings, Netflix and Tesla essentially dominated the headlines. Both mega-cap tech companies had disappointing results, particularly Tesla, which fell -9.75% in the first session after reporting earnings. Most notably, investors were very concerned about the company’s abysmal cash flow results, which fell -80% YoY to $441M vs. estimates of $3.24Bn. This graphic from
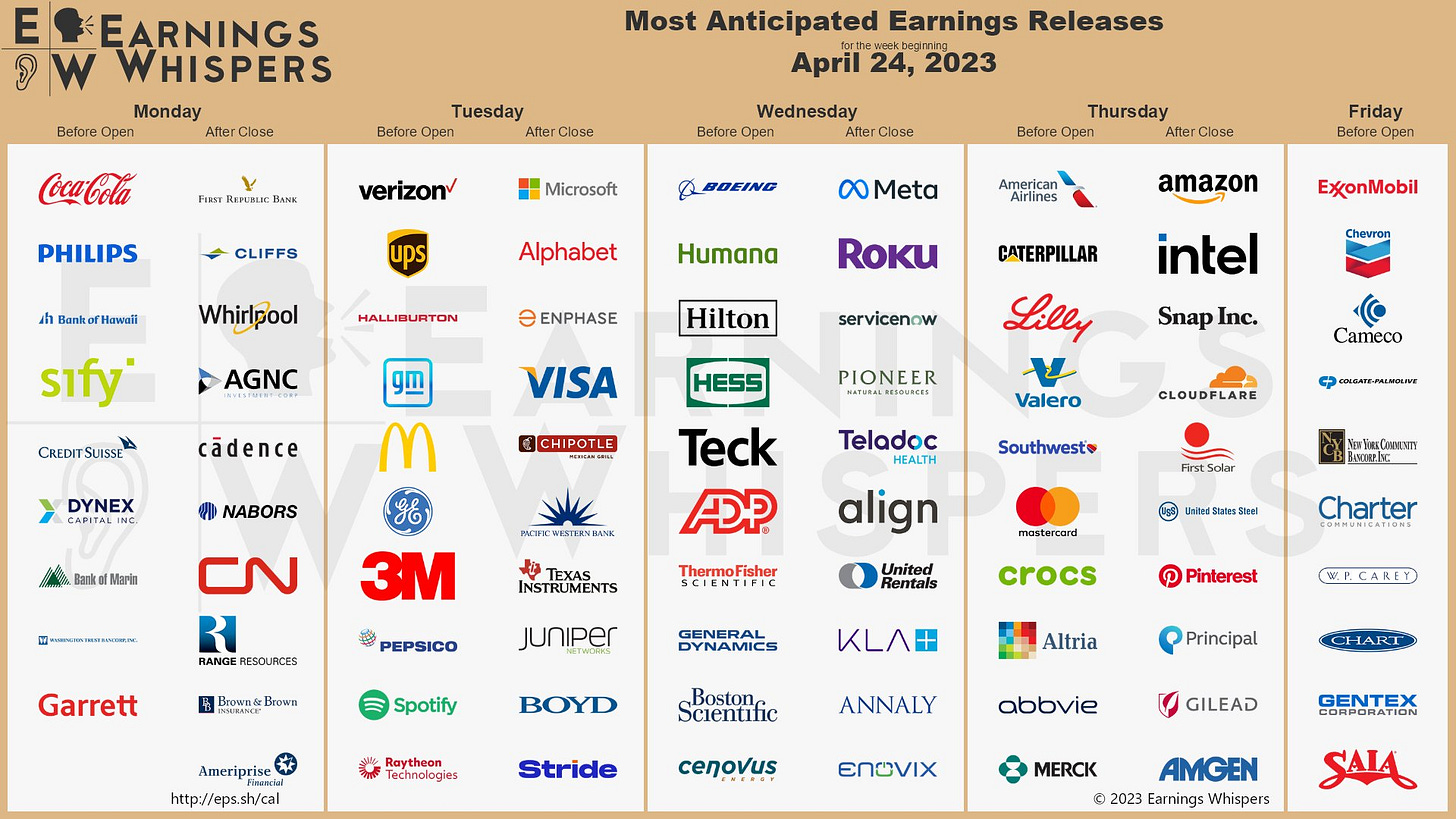
does an excellent job of displaying Tesla’s operating performance:This upcoming week will contain a bulk of the major earnings reports for the overall market, so I’m expecting to see more decisive action for the indexes this week:
I’ll be paying close attention to First Republic Bank, Microsoft, Alphabet, Visa, ADP, Meta, United Rentals, KLA Corporation, American Airlines, Mastercard, Amazon, and Chevron Corporation.
Bitcoin:
While the traditional stock market was a snooze-fest last week, Bitcoin and crypto faced distinct downward pressure without any rhyme or reason. Relative to the prior week’s close, Bitcoin fell -10.6% and is trading around $27.3k at the time of writing. As I had outlined on Twitter (italicized commentary below), I plan to be buying BTC on every -10% decline and I will be DCA’ing into the digital asset this weekend.
Specifically, here’s what I shared on Twitter:
“Bitcoin's 12 & 24-month Williams%R oscillators are no longer "oversold", which has historically meant that the lows of the BTC bear market are in & that a new bull market is starting. How do I intend to implement this analysis? Here's my plan: So long as both of these signals are still flashing, I think that all 10% declines should be bought, with much more size than during the accumulation zones. Specifically, I will allocate 10% of remaining capital into BTC on every -10% decline. This gives me the ability to DCA 10 times going forward! If BTC fell -10% ten straight times from the current price of $28.1k, the final DCA price would be = $9.8k. However, I don't think $9.8k is a reasonable outcome for these two reasons:
Price doesn't move linearly & will follow a choppy path. It's EXTREMELY unlikely that BTC tanks -10% ten times consecutively. There are always rallies that occur during a downtrend.
I just don't think $9.8k is a practical scenario at this point in the cycle, based on a variety of data I'm seeing. Even my most bearish outlook in 2022 was for $11k-$14k. We got pretty damn close. Falling to $9.8k would require a decline of -65% from the current price of BTC.
If the $9.8k scenario does occur, I'll be a happy buyer! This plan is path-dependent. If BTC rises from $28.1k to $33k in the coming weeks, without a -10% decline, my first purchase under this plan would occur if price fell from $33k to $30k. In other words, I'm not anchored to $28.1k. I'm simply anchored to -10% marginal declines. The accumulation zone based on the W%R oscillator allowed high-conviction investors to be patient & steadily increase their stack. Now, there's reason for haste while still exercising a degree of caution & prudence.
This new strategy allows me to do three things:
Increase my Bitcoin exposure.
Follow a clear & concise plan.
Reduce single-purchase risk.
If/when these respective indicators fall below their lower-bounds and reenter the accumulation zone, I'll revert back to small DCA drips. There are an abundance of TA, statistics, and on-chain signals that are extremely bullish, across a variety of timeframes. Ignoring any one of them could be a mistake, but ignoring their cumulative signal is certainly a mistake. This new DCA schedule is still defensive, but much more "aggressive" than I was DCA'ing during the bear market.”
When the Bitcoin started falling heavily on Wednesday morning, I snapped into action and published the following video on YouTube to highlight the key market dynamics that I am paying attention to.
At the time, I shared that I wasn’t worried (yet), but provided an array of downside targets and potential support zones that I’ll be closely monitoring for Bitcoin, Ethereum, and the total crypto market cap. Since posting this analysis, we’ve seen a further deterioration and breakdown below short-term structure, implying that there is still more downside pressure ahead.
The major downside targets are outlined in the video above, so be sure to check that out in order to understand what my expectations are going forward.
Best
Caleb Franzen
DISCLAIMER:
This report expresses the views of the author as of the date it was published, and are subject to change without notice. The author believes that the information, data, and charts contained within this report are accurate, but cannot guarantee the accuracy of such information.
The investment thesis, security analysis, risk appetite, and time frames expressed above are strictly those of the author and are not intended to be interpreted as financial advice. As such, market views covered in this publication are not to be considered investment advice and should be regarded as information only. The mention, discussion, and/or analysis of individual securities is not a solicitation or recommendation to buy, sell, or hold said security.
Each investor is responsible to conduct their own due diligence and to understand the risks associated with any information that is reviewed. The information contained herein does not constitute and shouldn’t be construed as a solicitation of advisory services. Consult a registered financial advisor and/or certified financial planner before making any investment decisions.
This report may not be copied, reproduced, republished or posted without the consent of Cubic Analytics and/or Caleb Franzen, without proper citation.
Please be advised that this report contains a third party paid advertisement and links to third party websites. These advertisements do not constitute endorsements and are not necessarily representative of the views or opinions of the newsletter author. The advertisement contained herein did not influence the market views, analysis, or commentary expressed above and Cubic Analytics maintains its independence and full control over all ideas, thoughts, and expressions above. The mention, discussion, and/or analysis of individual securities is not a solicitation or recommendation to buy, sell, or hold said security. All investments carry risks and past performance is not necessarily indicative of future results/returns.



So much great content here, but the new sponsor is particularly interesting. Despite having quite the list of ways to play different sectors I want exposure to (with low stock prices which makes options plays more affordable), I had to point out the tickers for 3X Gold / 3X Inverse Gold made me quite literally laugh out loud - SHNY and DULL, respectively. Fantastic!
Another awesome newsletter, Caleb! Thank you for your diligent research and insights! I look forward to these in my inbox every weekend (almost makes up for the stock market being closed... ;))
Caleb, have you considered publishing an analysis of Bitcoin mining stocks? Similar to the leveraged ETNs, BTC mining stocks trade like leveraged BTC derivatives. Would be an interesting way to learn about position sizing, fundamental analysis and risk management