Investors,
If you consider yourself to be a crypto investor or trader, you need to see this chart…
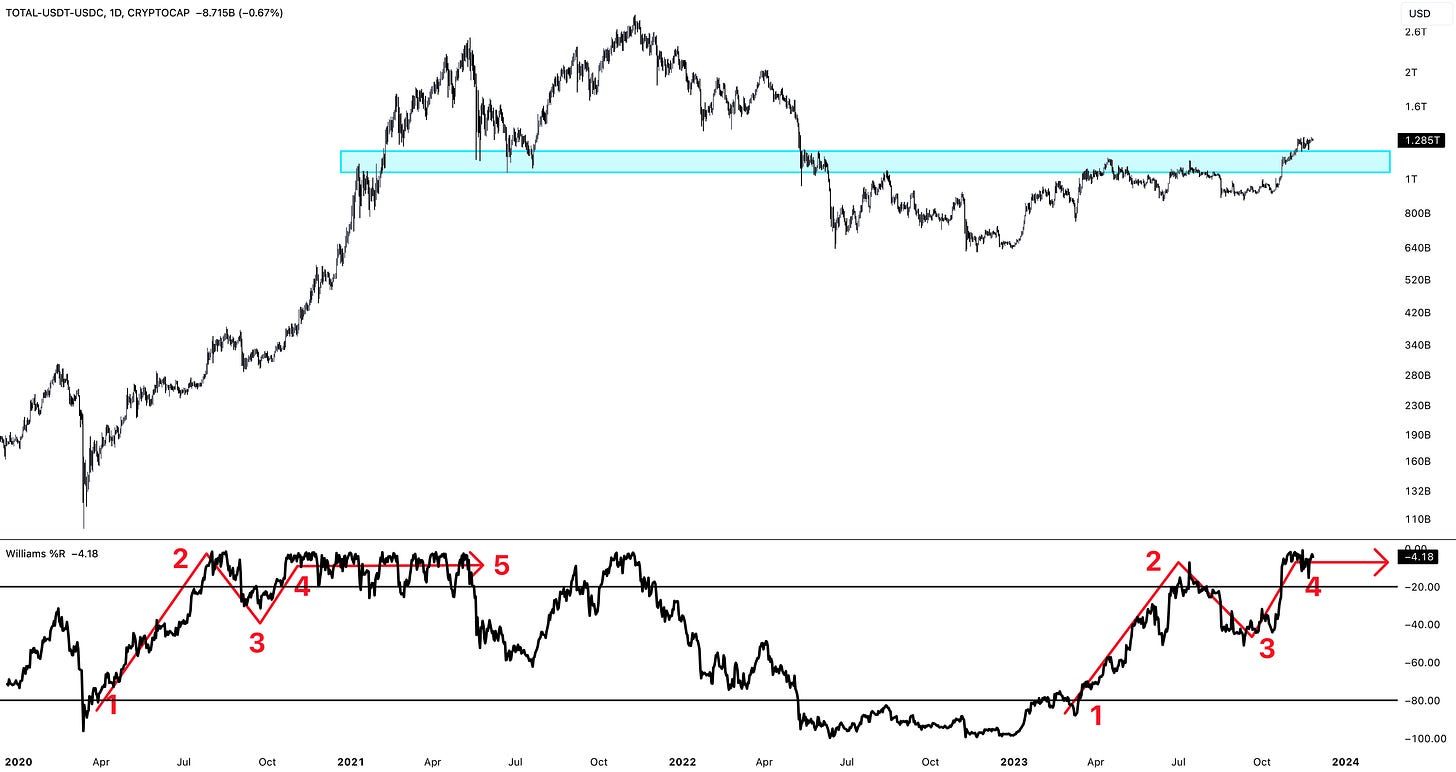
In the upper-bound, we have total crypto market cap excluding USDT + USDC.
In the lower-bound, we have the 365-day Williams%R Oscillator.
First of all, TOTAL - (USDT + USDC) has been breaking above key structure dating back to January 2021, highlighted in teal. Getting above this alternating support & resistance range is a major win for bulls, increasing the probability that it becomes support if/when we retest it again.
Second of all, focus on the 365-day Williams%R… you might be saying, “but Caleb, why 365 days instead of the default setting of 14?” The answer is simple:
Because I want to do long-term analysis and using a proxy for 1-year of price analysis is much more effective at producing long-term signals than the default 14-day length.
This Williams%R indicator is behaving extremely similar to the patterns of the 2020-2021 cycle, following 5 key steps:
Starting point from the lower-bound, meaning the crypto market cap is oversold.
Fast oscillation & momentum thrust into the upper-bound to become overbought.
Temporary reset & consolidation below the overbought level.
A second momentum thrust back above the upper-bound.
Persistent trend of being overbought as the bull market goes exponential.
At the present moment, we’ve achieved the first 4 steps of the pattern. If the pattern continues to mirror the past, step 5 is underway & is likely to persist for the next six months, which was the duration of last cycle’s pattern for step 5.
I was really impressed by the consistency of the behavior thus far, and while it’s not guaranteed to repeat in an identical fashion, we continue to stack evidence that we’re moving deeper into a bull market for crypto. Whether my analysis proves to be right or wrong over the coming months, I think this is worth highlighting as an objective, data-driven approach to analyzing market dynamics with statistics.
Before going into the in-depth analysis that I’ve prepared below, I want to highlight three Black Friday / Cyber Monday offers that you should take advantage of:
1. A 20% discount for the premium subscription to Cubic Analytics! If you enjoy the free weekly reports that your receive every Saturday, you’ll love the stock market & crypto analysis that I publish in these premium reports every Sunday. In addition, you’ll also have a chance to attend weekly Q&A sessions and a variety of other research & benefits. I’m currently offering a 20% discount on annual memberships, but there are only a few spots left before I drop the discount to 10%!
2. TradingView is officially offering their exclusive Cyber Monday deal, offering between 30% and 70% off their paid plans for advanced analysis & trading. By using the link below, you’re not only getting the best possible price for TradingView, but you’re also helping to support Cubic Analytics!
3. I just recently reached out to the team at Hodlers Official, an epic apparel company focused on Bitcoin, who agreed to do a special promo for Cubic Analytics members!
So here’s the deal… they’re offering a 21% discount this weekend + an additional 5% with free shipping in the U.S. & Canada if you use the link below. Just make sure to use the code CUBIC at checkout so they know who sent you!
With that out of the way, let’s jump right in to the alpha! Within this report, I’ll cover:
Under-the-hood metrics for the S&P 500 in order to stay on top of the market trend and to get a pulse on the health of market internals.
The difference between hard & soft data, using recent University of Michigan data as a contrarian indicator for asset prices.
Why disinflation is extremely bullish for asset prices, using data from Goldman Sachs to show how the current market environment is performing exactly as history suggests it should.
An updated analysis on Bitcoin miners and what I’m seeing for them right now.


