
Have You Seen This Correlation?

Investors,
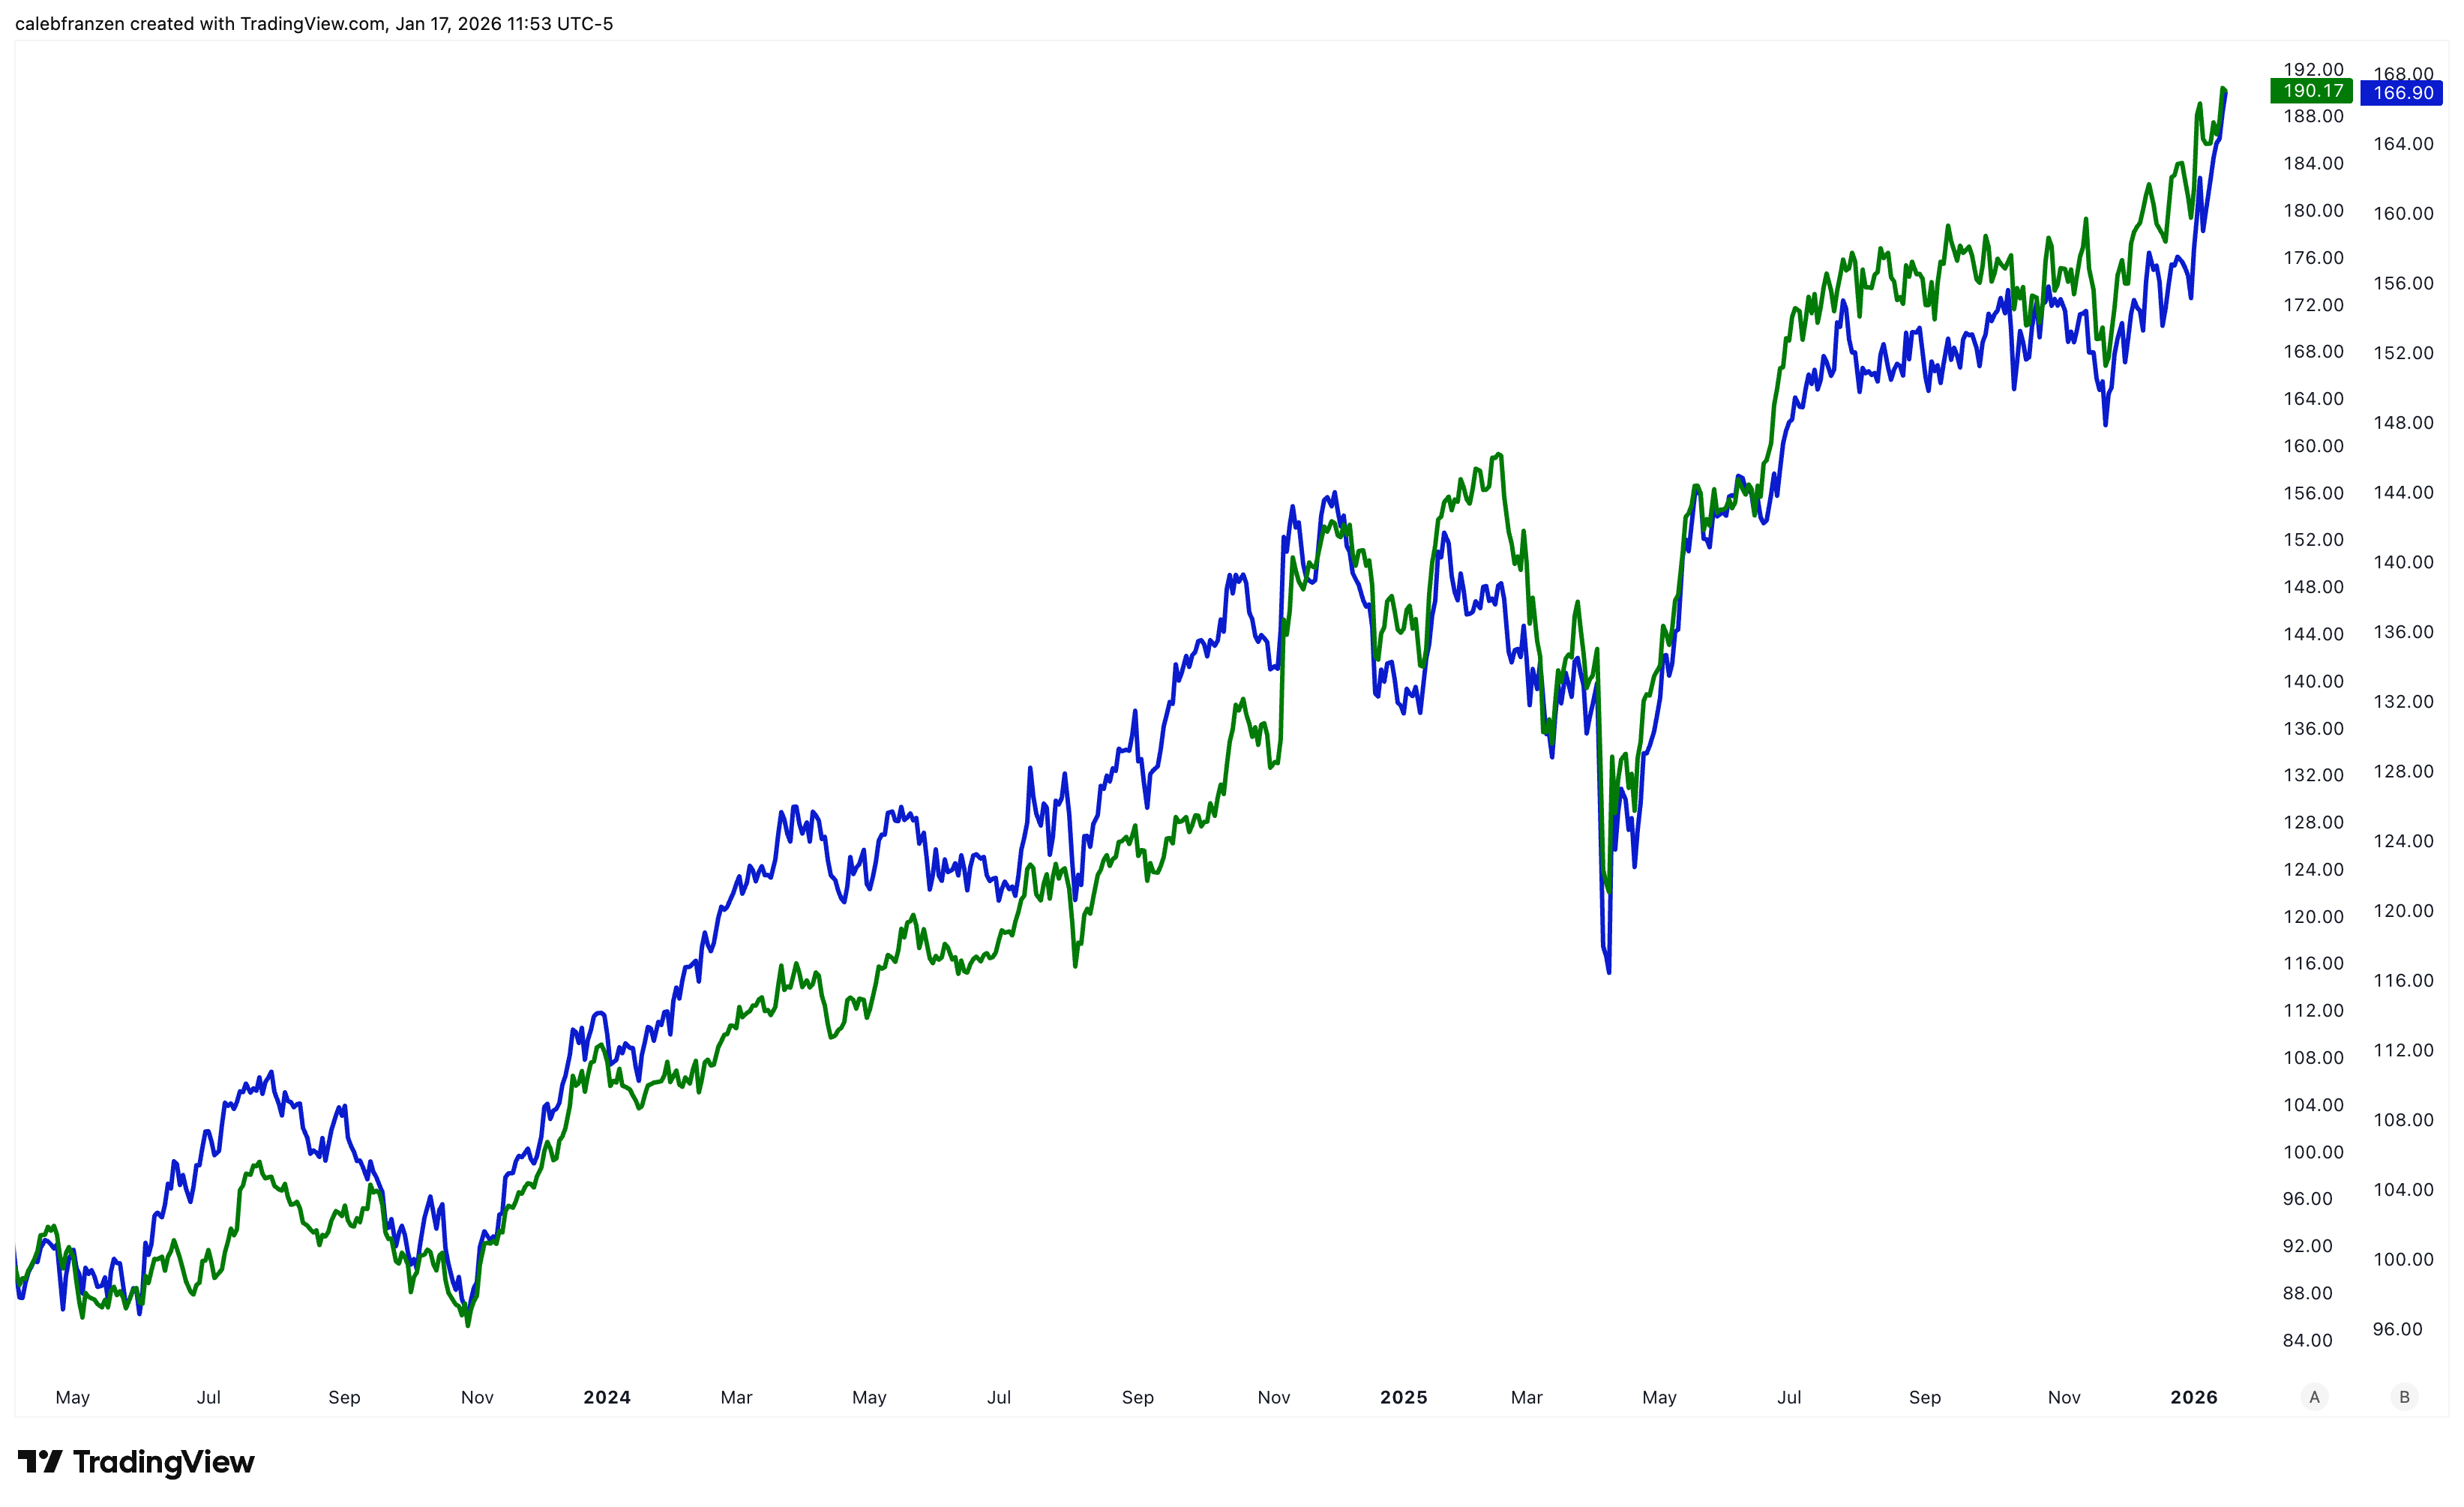
What if I told you that these assets represent two completely different types of stocks?
The average investor would conclude that these lines tracked two stocks within the same industry or sector, or that they resembled each other in terms of fundamentals.
But the reality is completely different.
One is a sector & the other is a sub-industry group in a completely different sector.
And yet they’ve moved in almost total lockstep for ~2 years!
What are they?
🔵 Industrials ($XLI)
🟢 Broker-dealers & Securities Exchanges ($IAI)
Broker-dealers in the financial sector have nothing to do with industrials!
We can even compare the top 5 holdings in each ETF…
XLI Top 5 Holdings:
General Electric
Caterpillar Inc.
RTX Corporation
Boeing
Uber Technologies
IAI Top 5 Holdings:
Goldman Sachs
Morgan Stanley
Charles Schwab
Moody’s Corporation
S&P Global
So why are these completely unrelated assets moving in lockstep, both jumping to new all-time highs in this market environment?
At the risk of sounding arrogant or dismissive, I actually don’t care.
All I care about is the fact that it is happening and that both are making new ATHs.
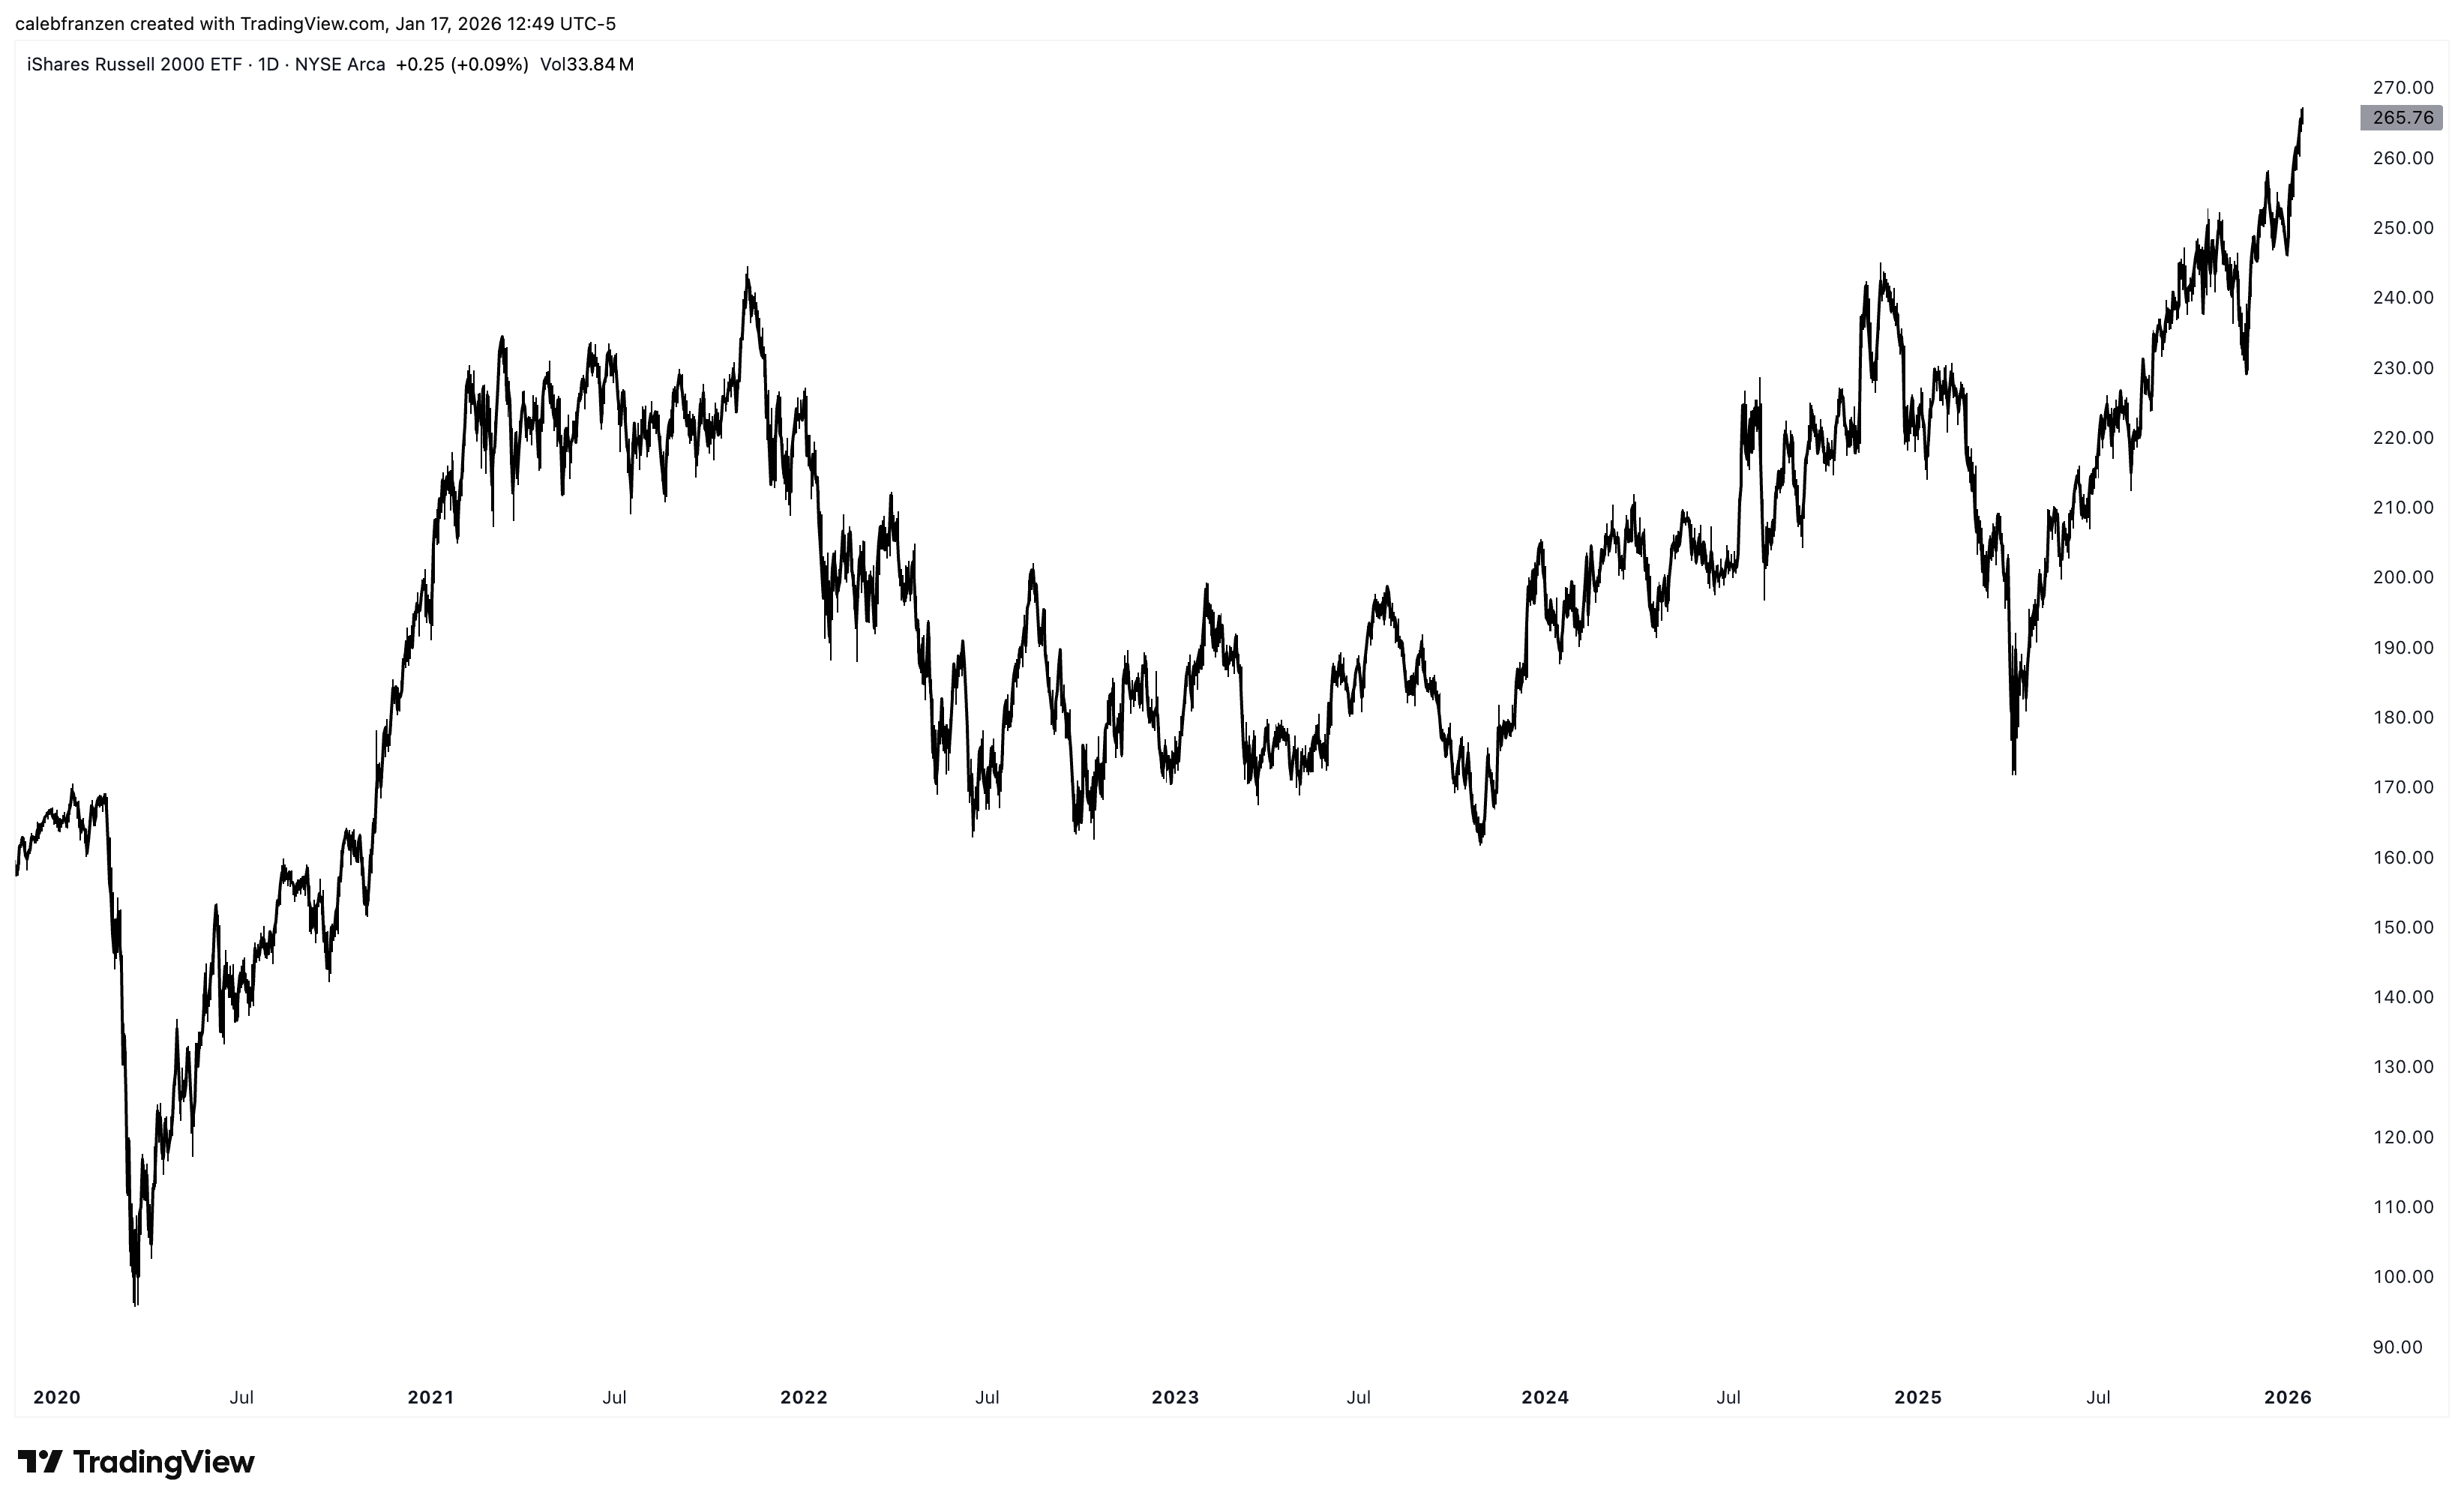
Particularly in an environment where the Russell 2000 is making new all-time highs.
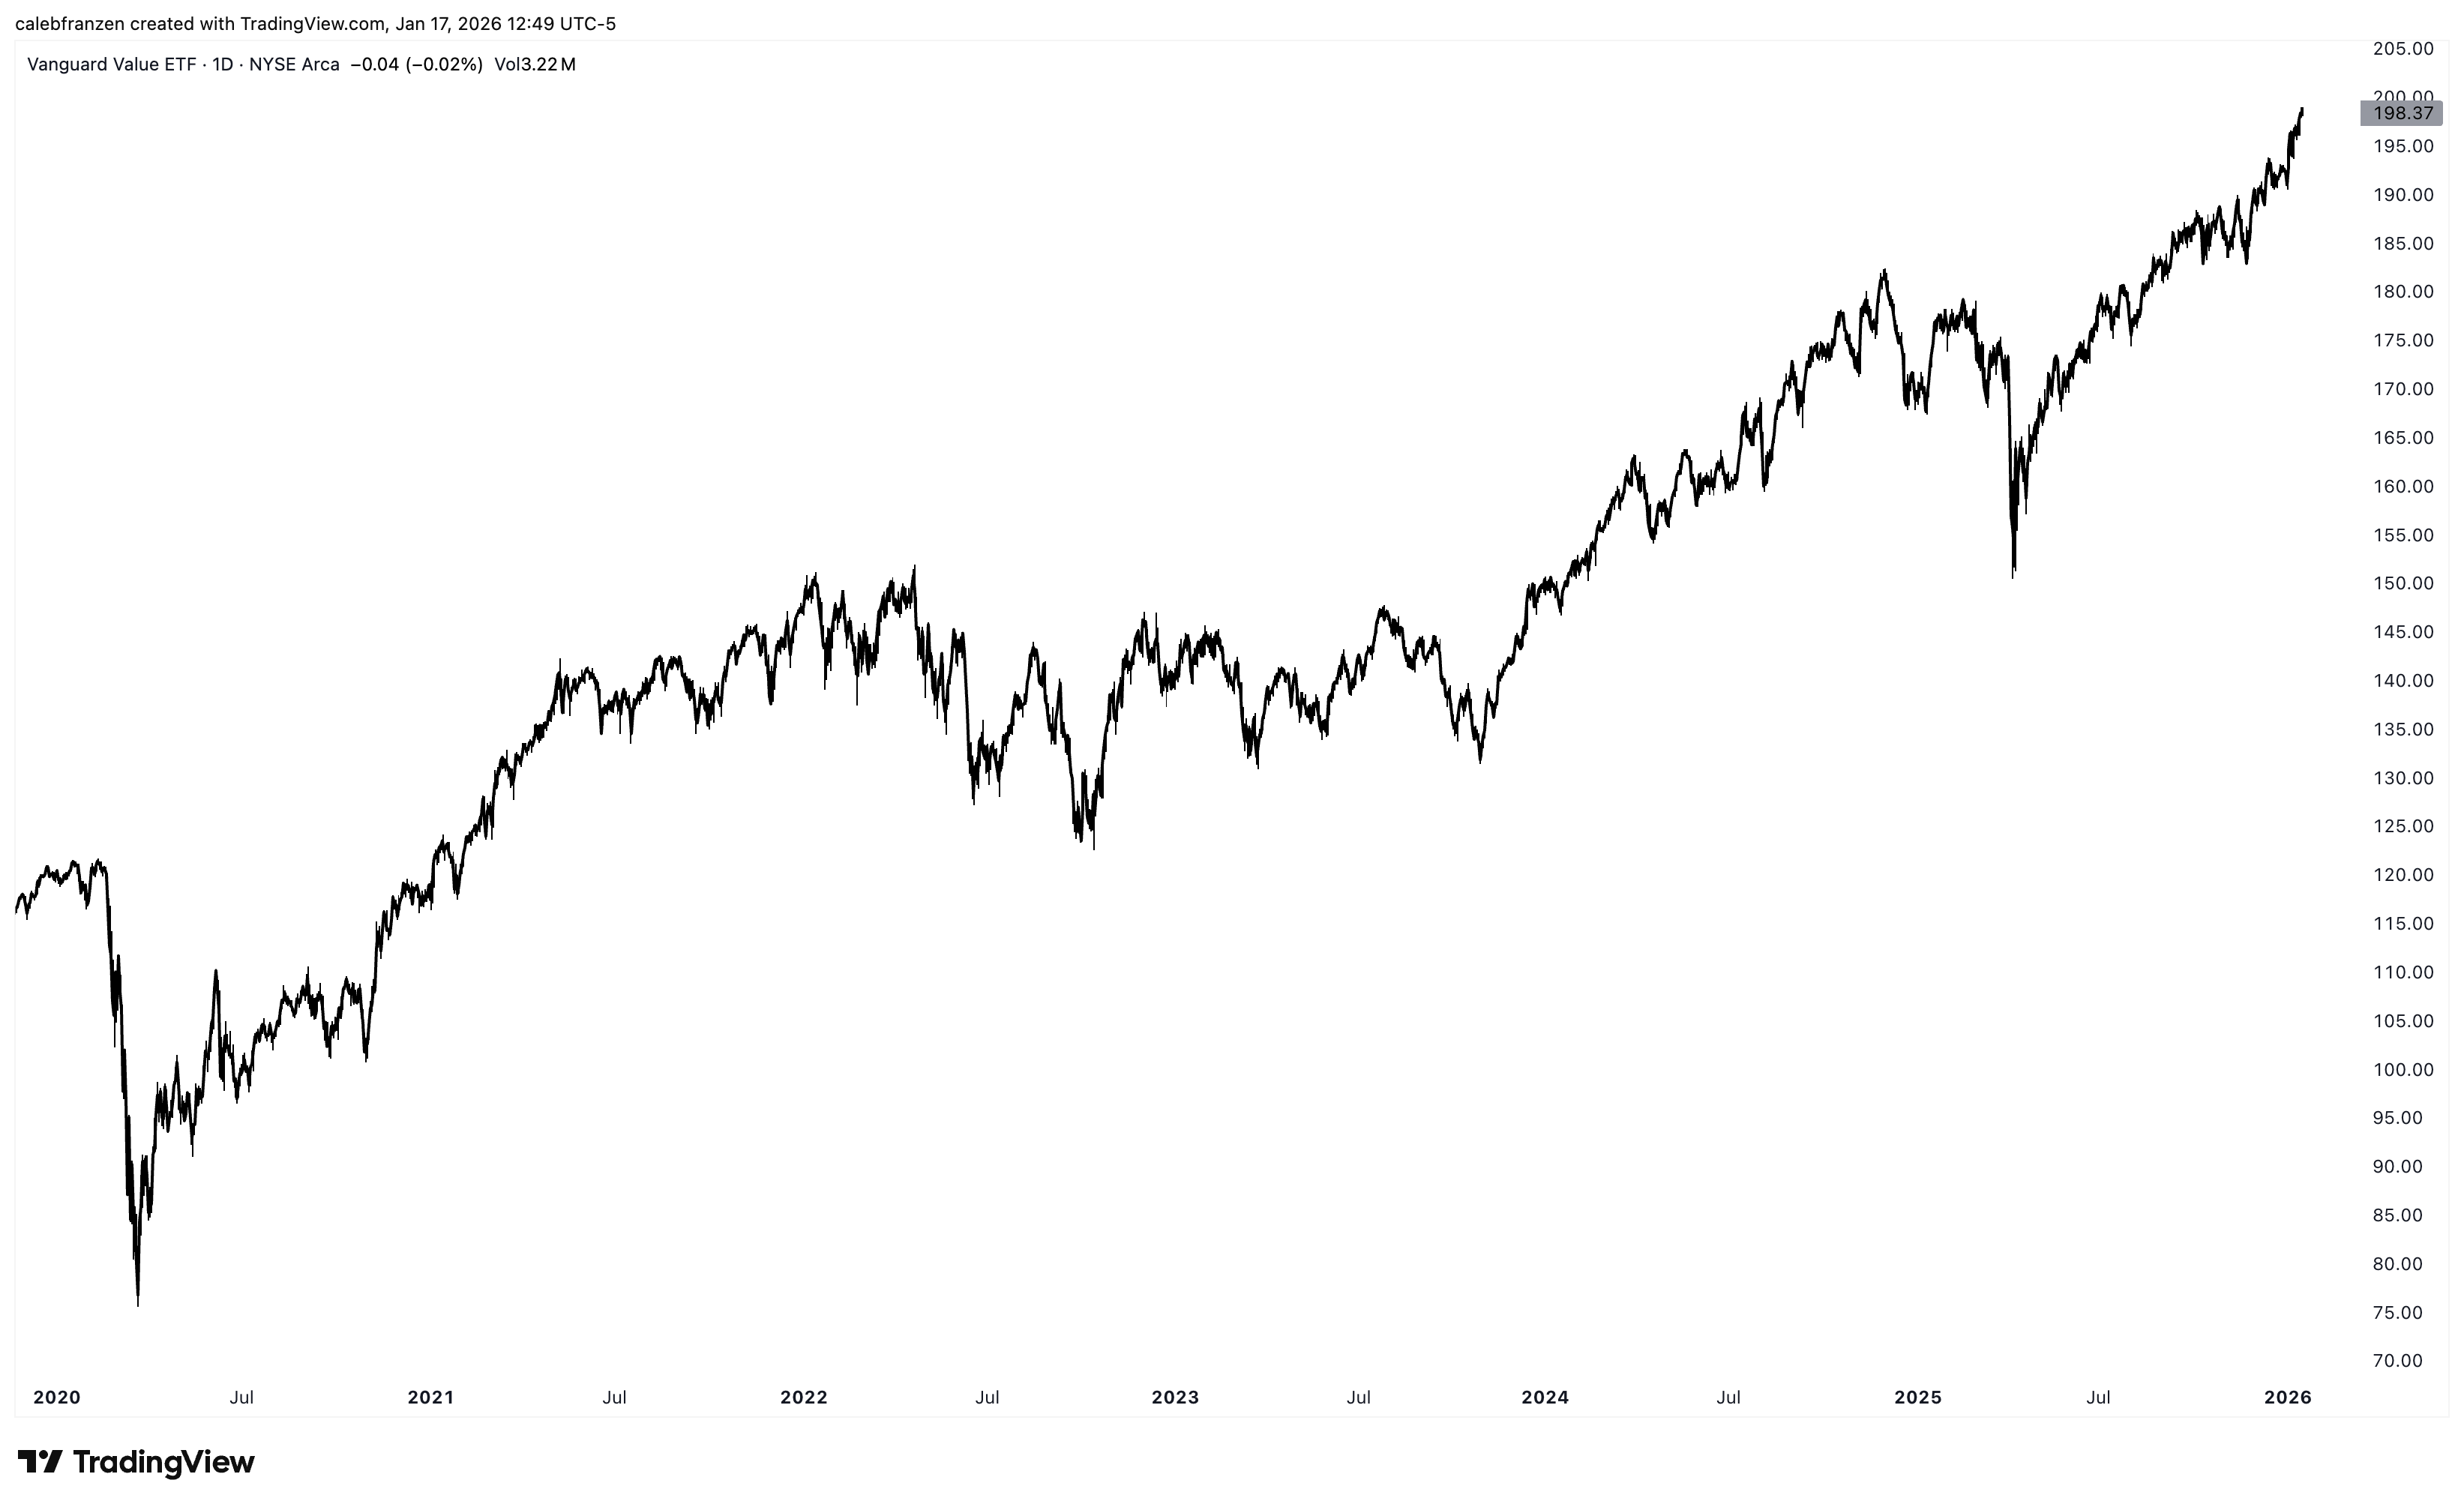
Value stocks ($VTV) are making new all-time highs.
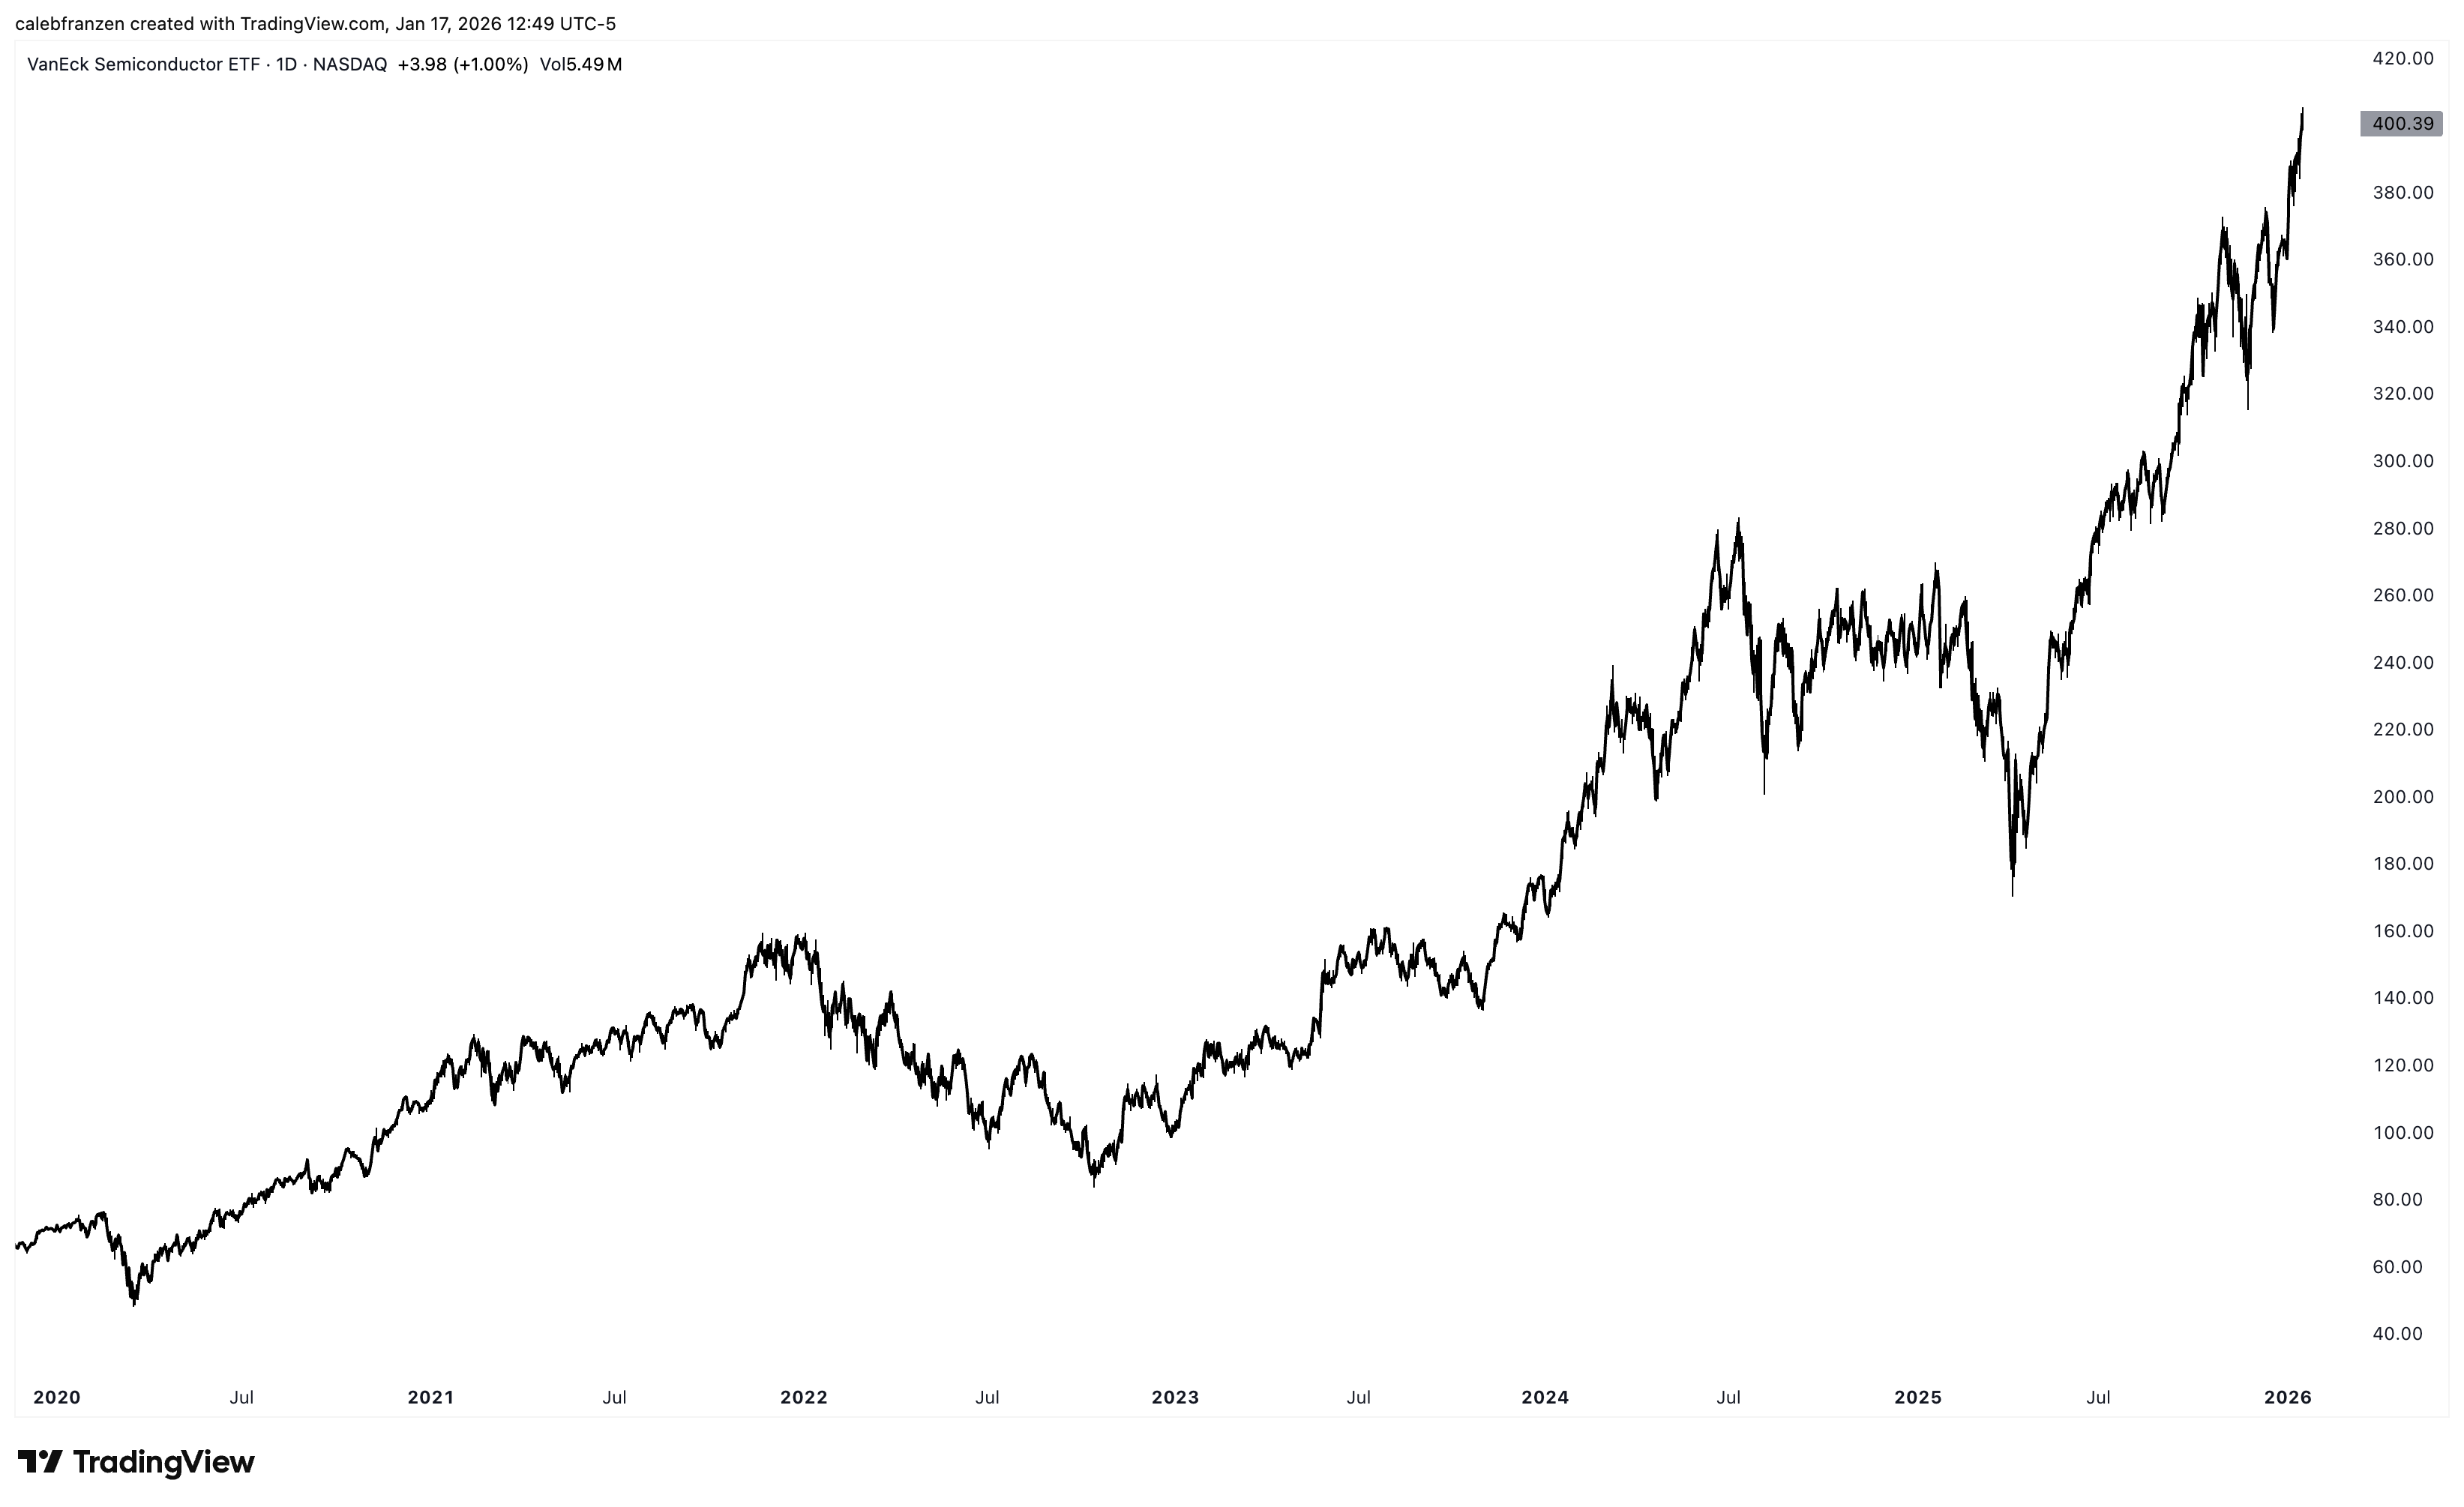
Semiconductor stocks ($SMH) are making new all-time highs.
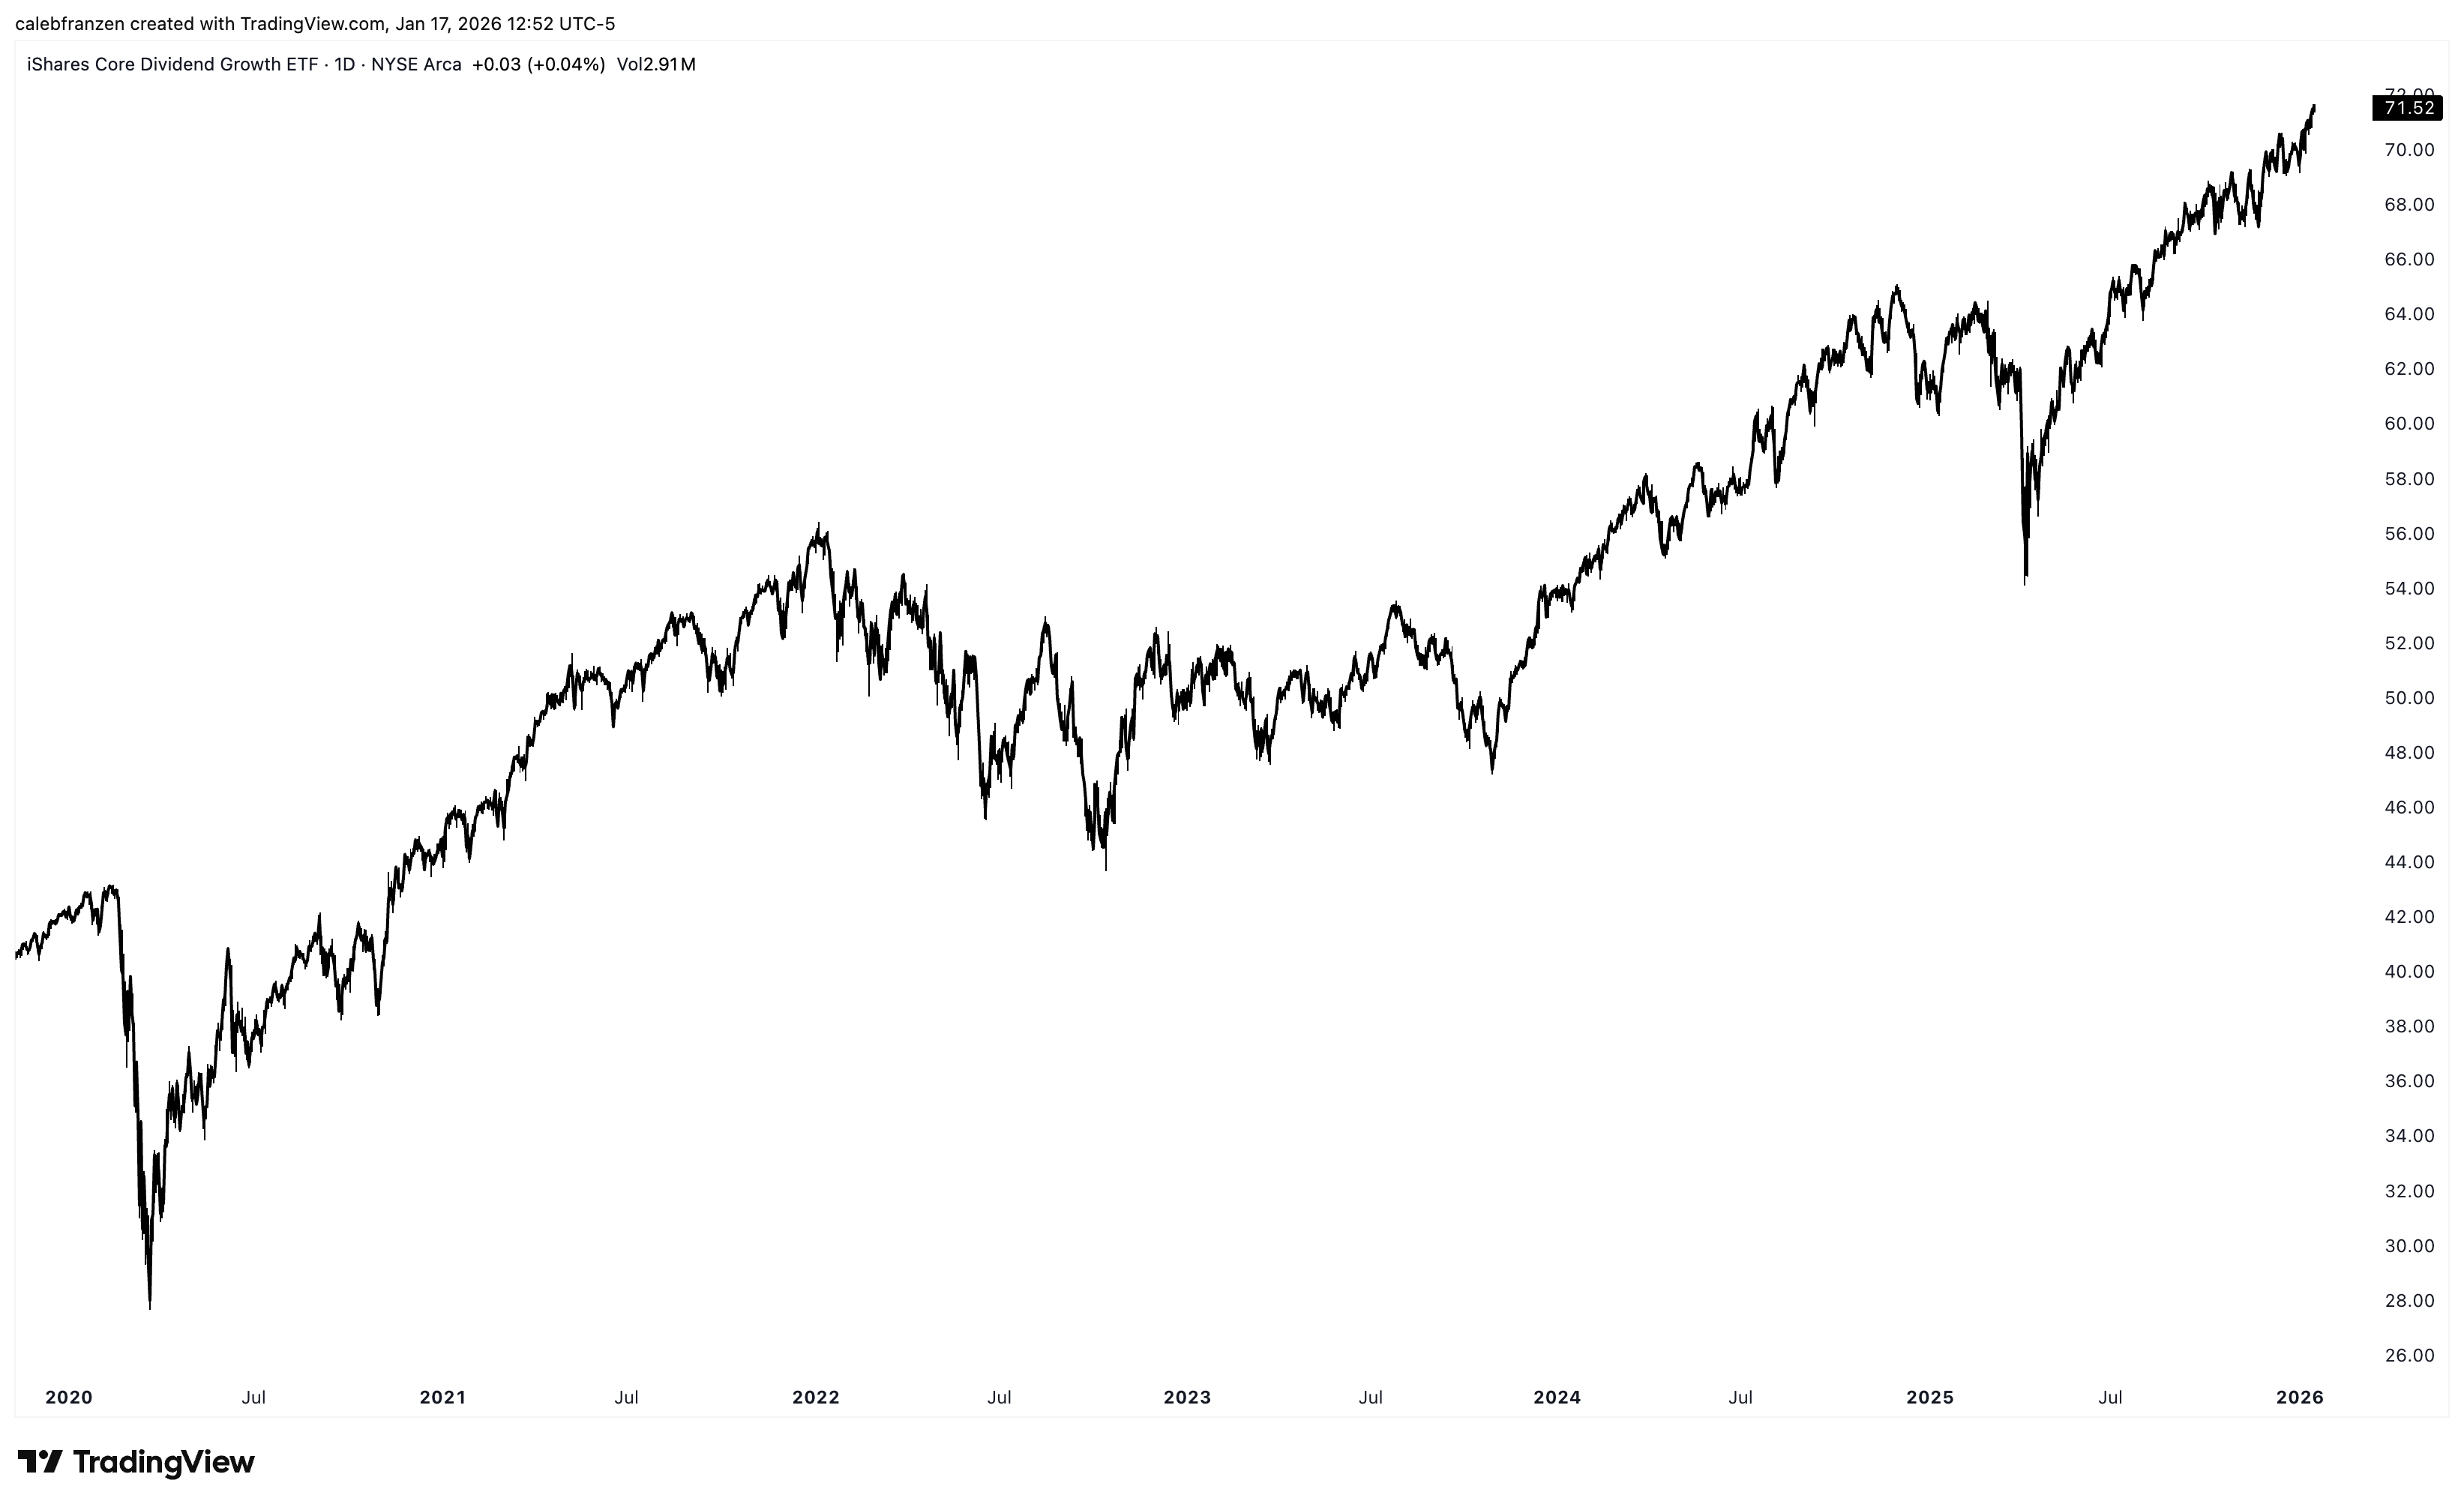
Dividend growth stocks ($DGRO) are making new all-time highs.
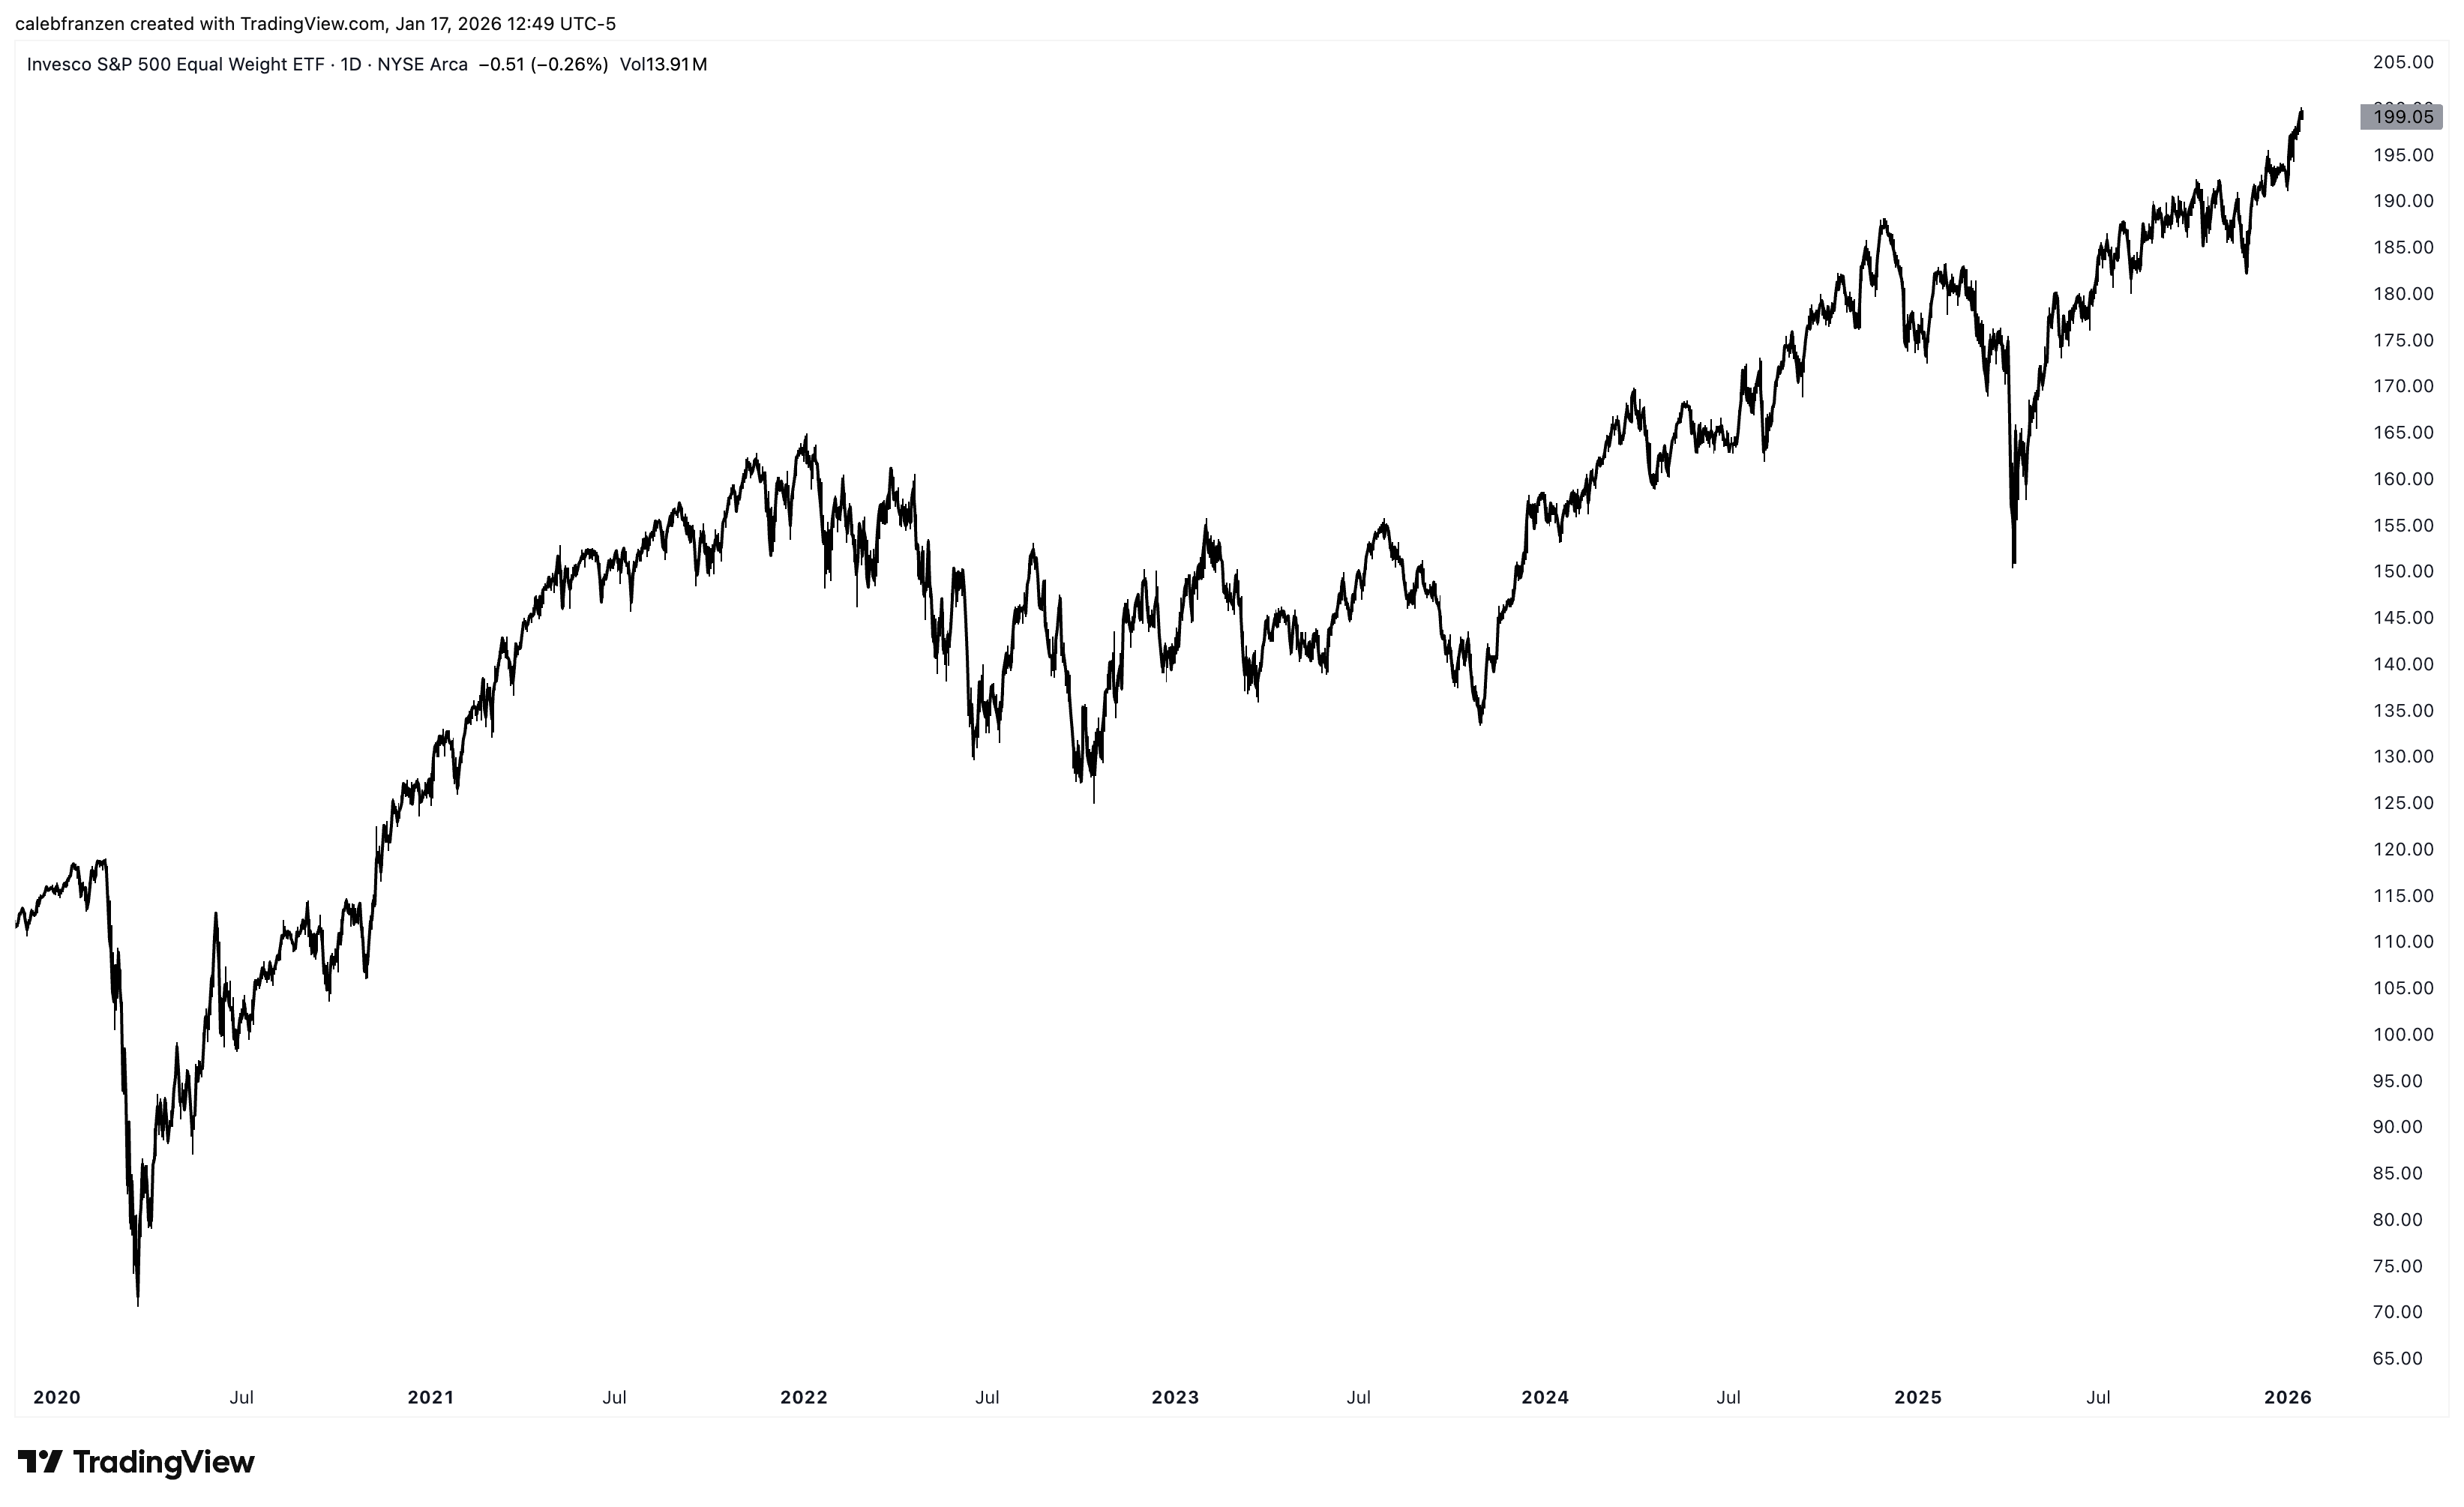
And the equal-weight S&P 500 ($RSP) is making new all-time highs.
I could continue on and on about the vast levels of participation in this market.
Why is all of this so important?
Because it speaks to optimism about the future.
At the end of the day, would investors be willing to value these stocks at their highest prices in human history if they had a pessimistic view about the future?
Of course not.
And the fact of the matter is, these stocks have been making new all-time highs, or at least trending higher, for months, quarters, and even years.
In other words, not only are investors optimistic about the future, but they’re getting increasingly more optimistic about the future!
And who can blame them?
Particularly when we look at current macro conditions…
The Q3’25 real GDP data was released this past week, showing annualized growth of +4.3% and building on the success of prior quarters:
Q1’23: +2.92%
Q2’23: +2.53%
Q3’23: +4.69%
Q4’23: +3.42%
Q1’24: +0.84%
Q2’24: +3.59%
Q3’24: +3.34%
Q4’24: +1.85%
Q1’25: -0.65%
Q2’25: +3.84%
Better yet, recent estimates from the Atlanta Federal Reserve are predicting +5.3% growth (annualized) for Q4’25, per their latest GDPNow forecast.
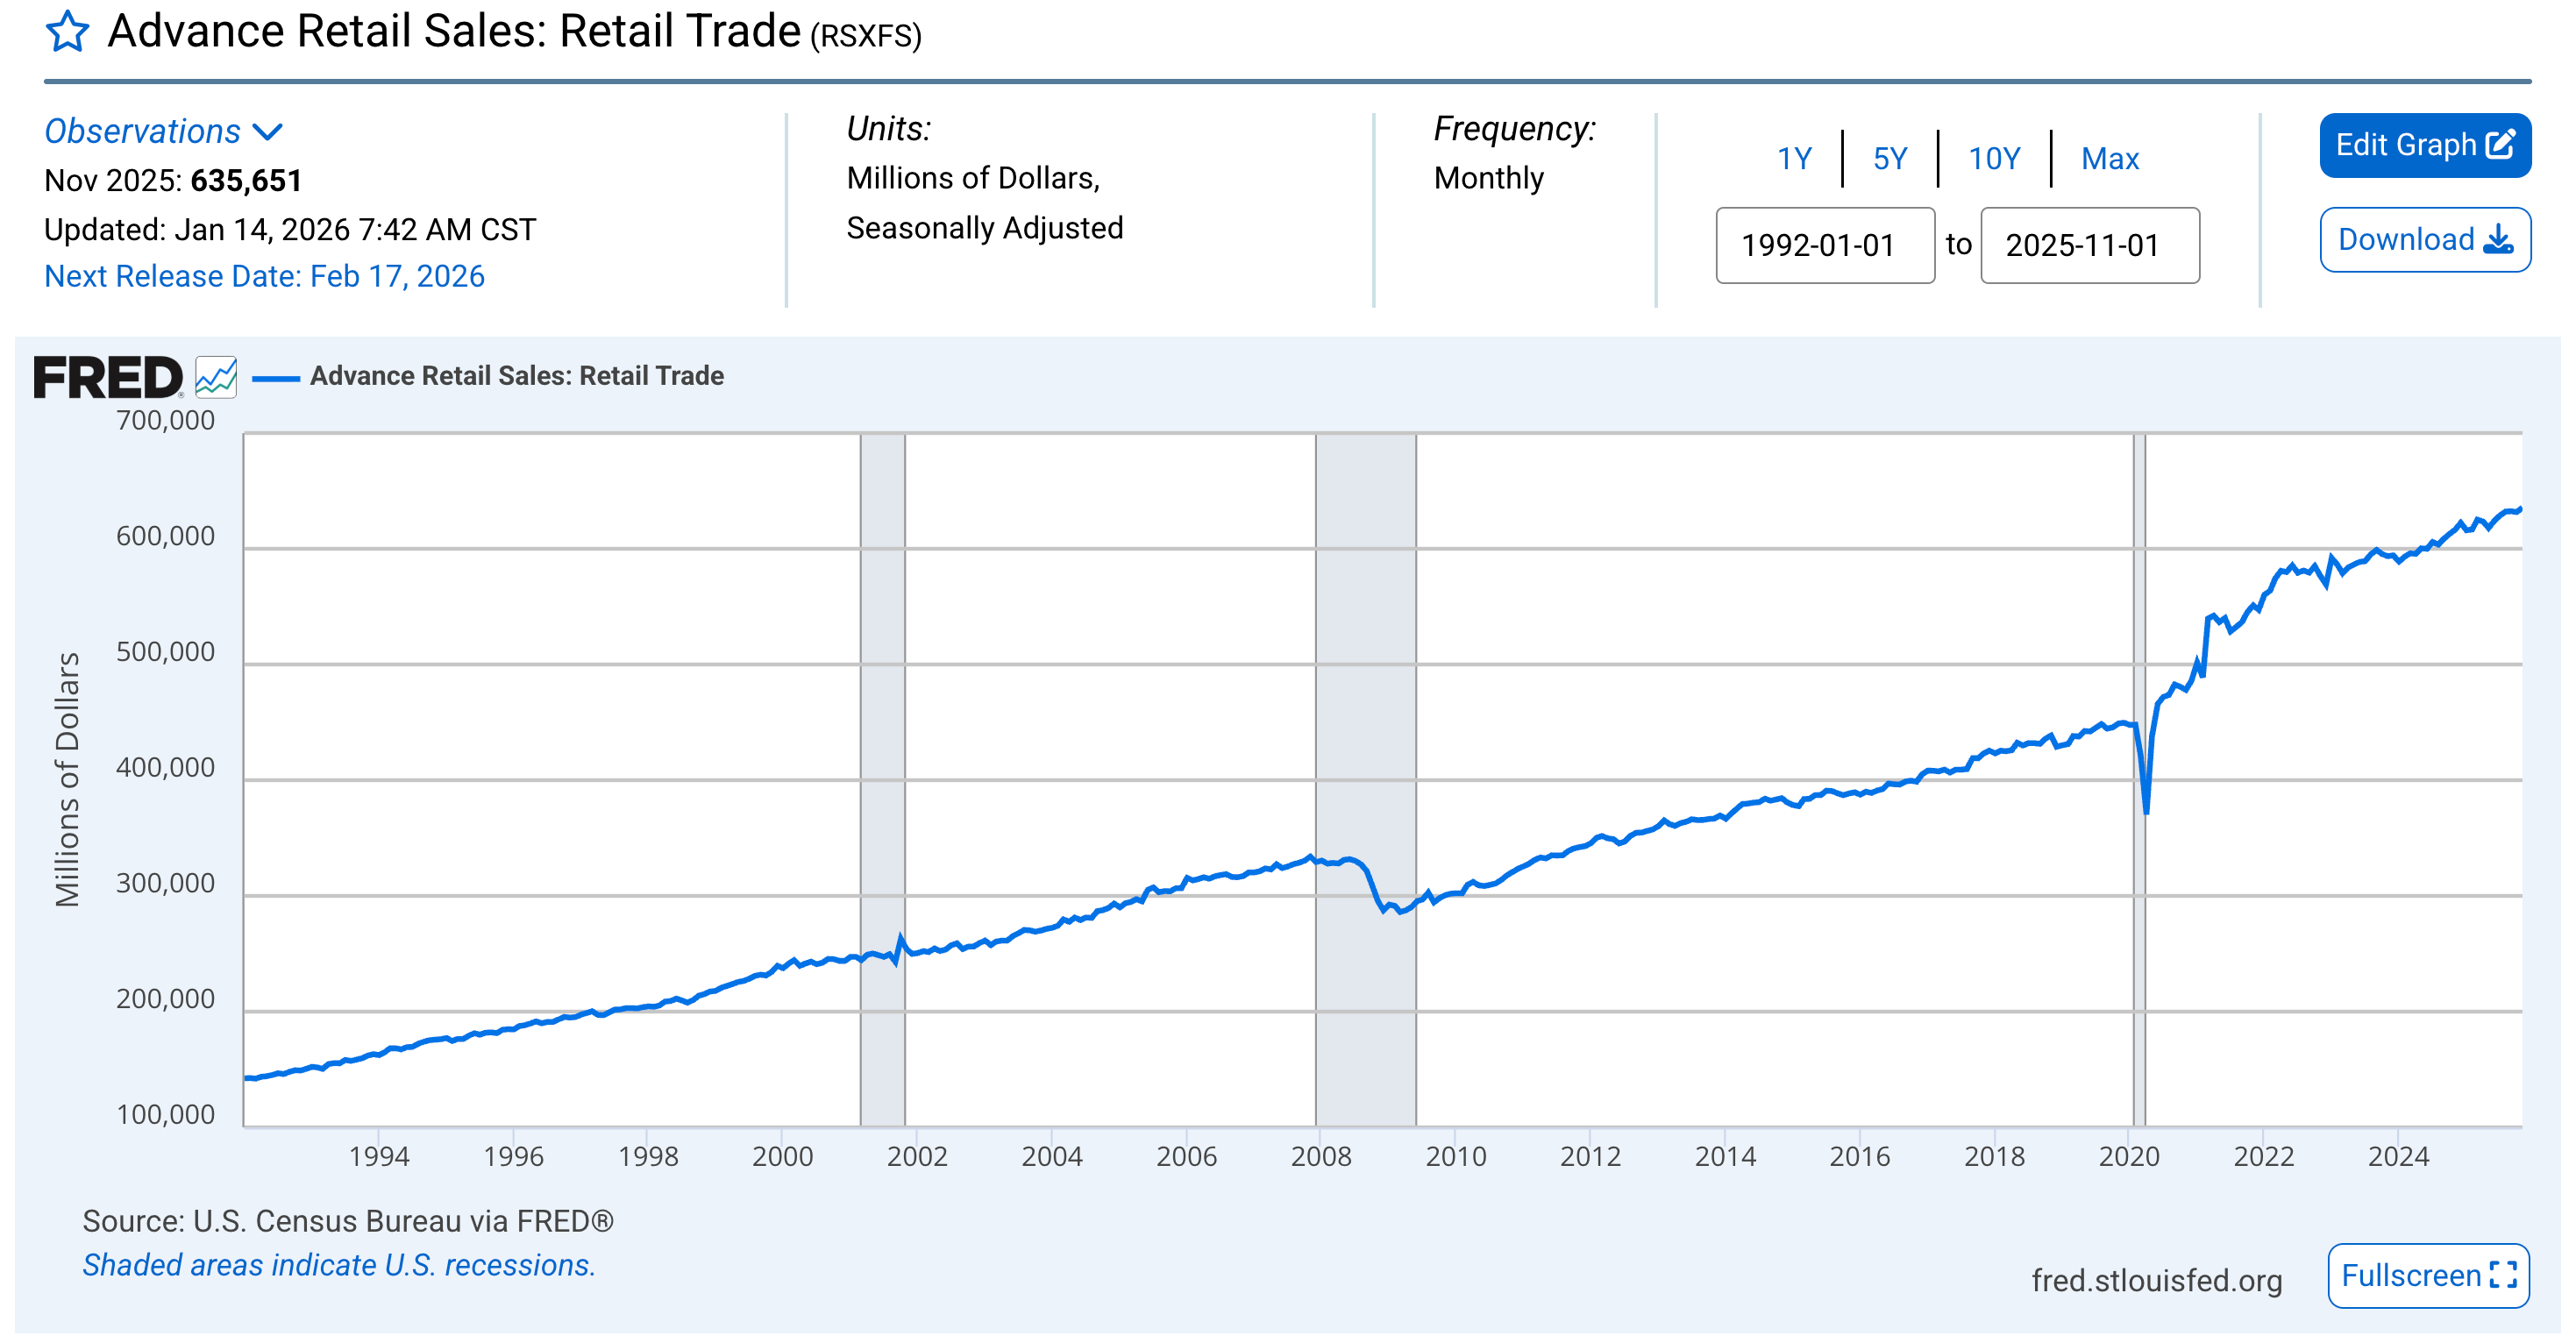
Retail sales continues to reflect the fact that the U.S. consumer is resilient & dynamic.
The latest figure, for the delayed data of November 2025, just came in at +0.6% MoM and slightly beat out the estimates of +0.4%, which also marks a YoY increase of +3.1%.
The more real-time data from the Redbook Retail Sales has the latest figure growing at +5.7% YoY, for the week ending January 10th.
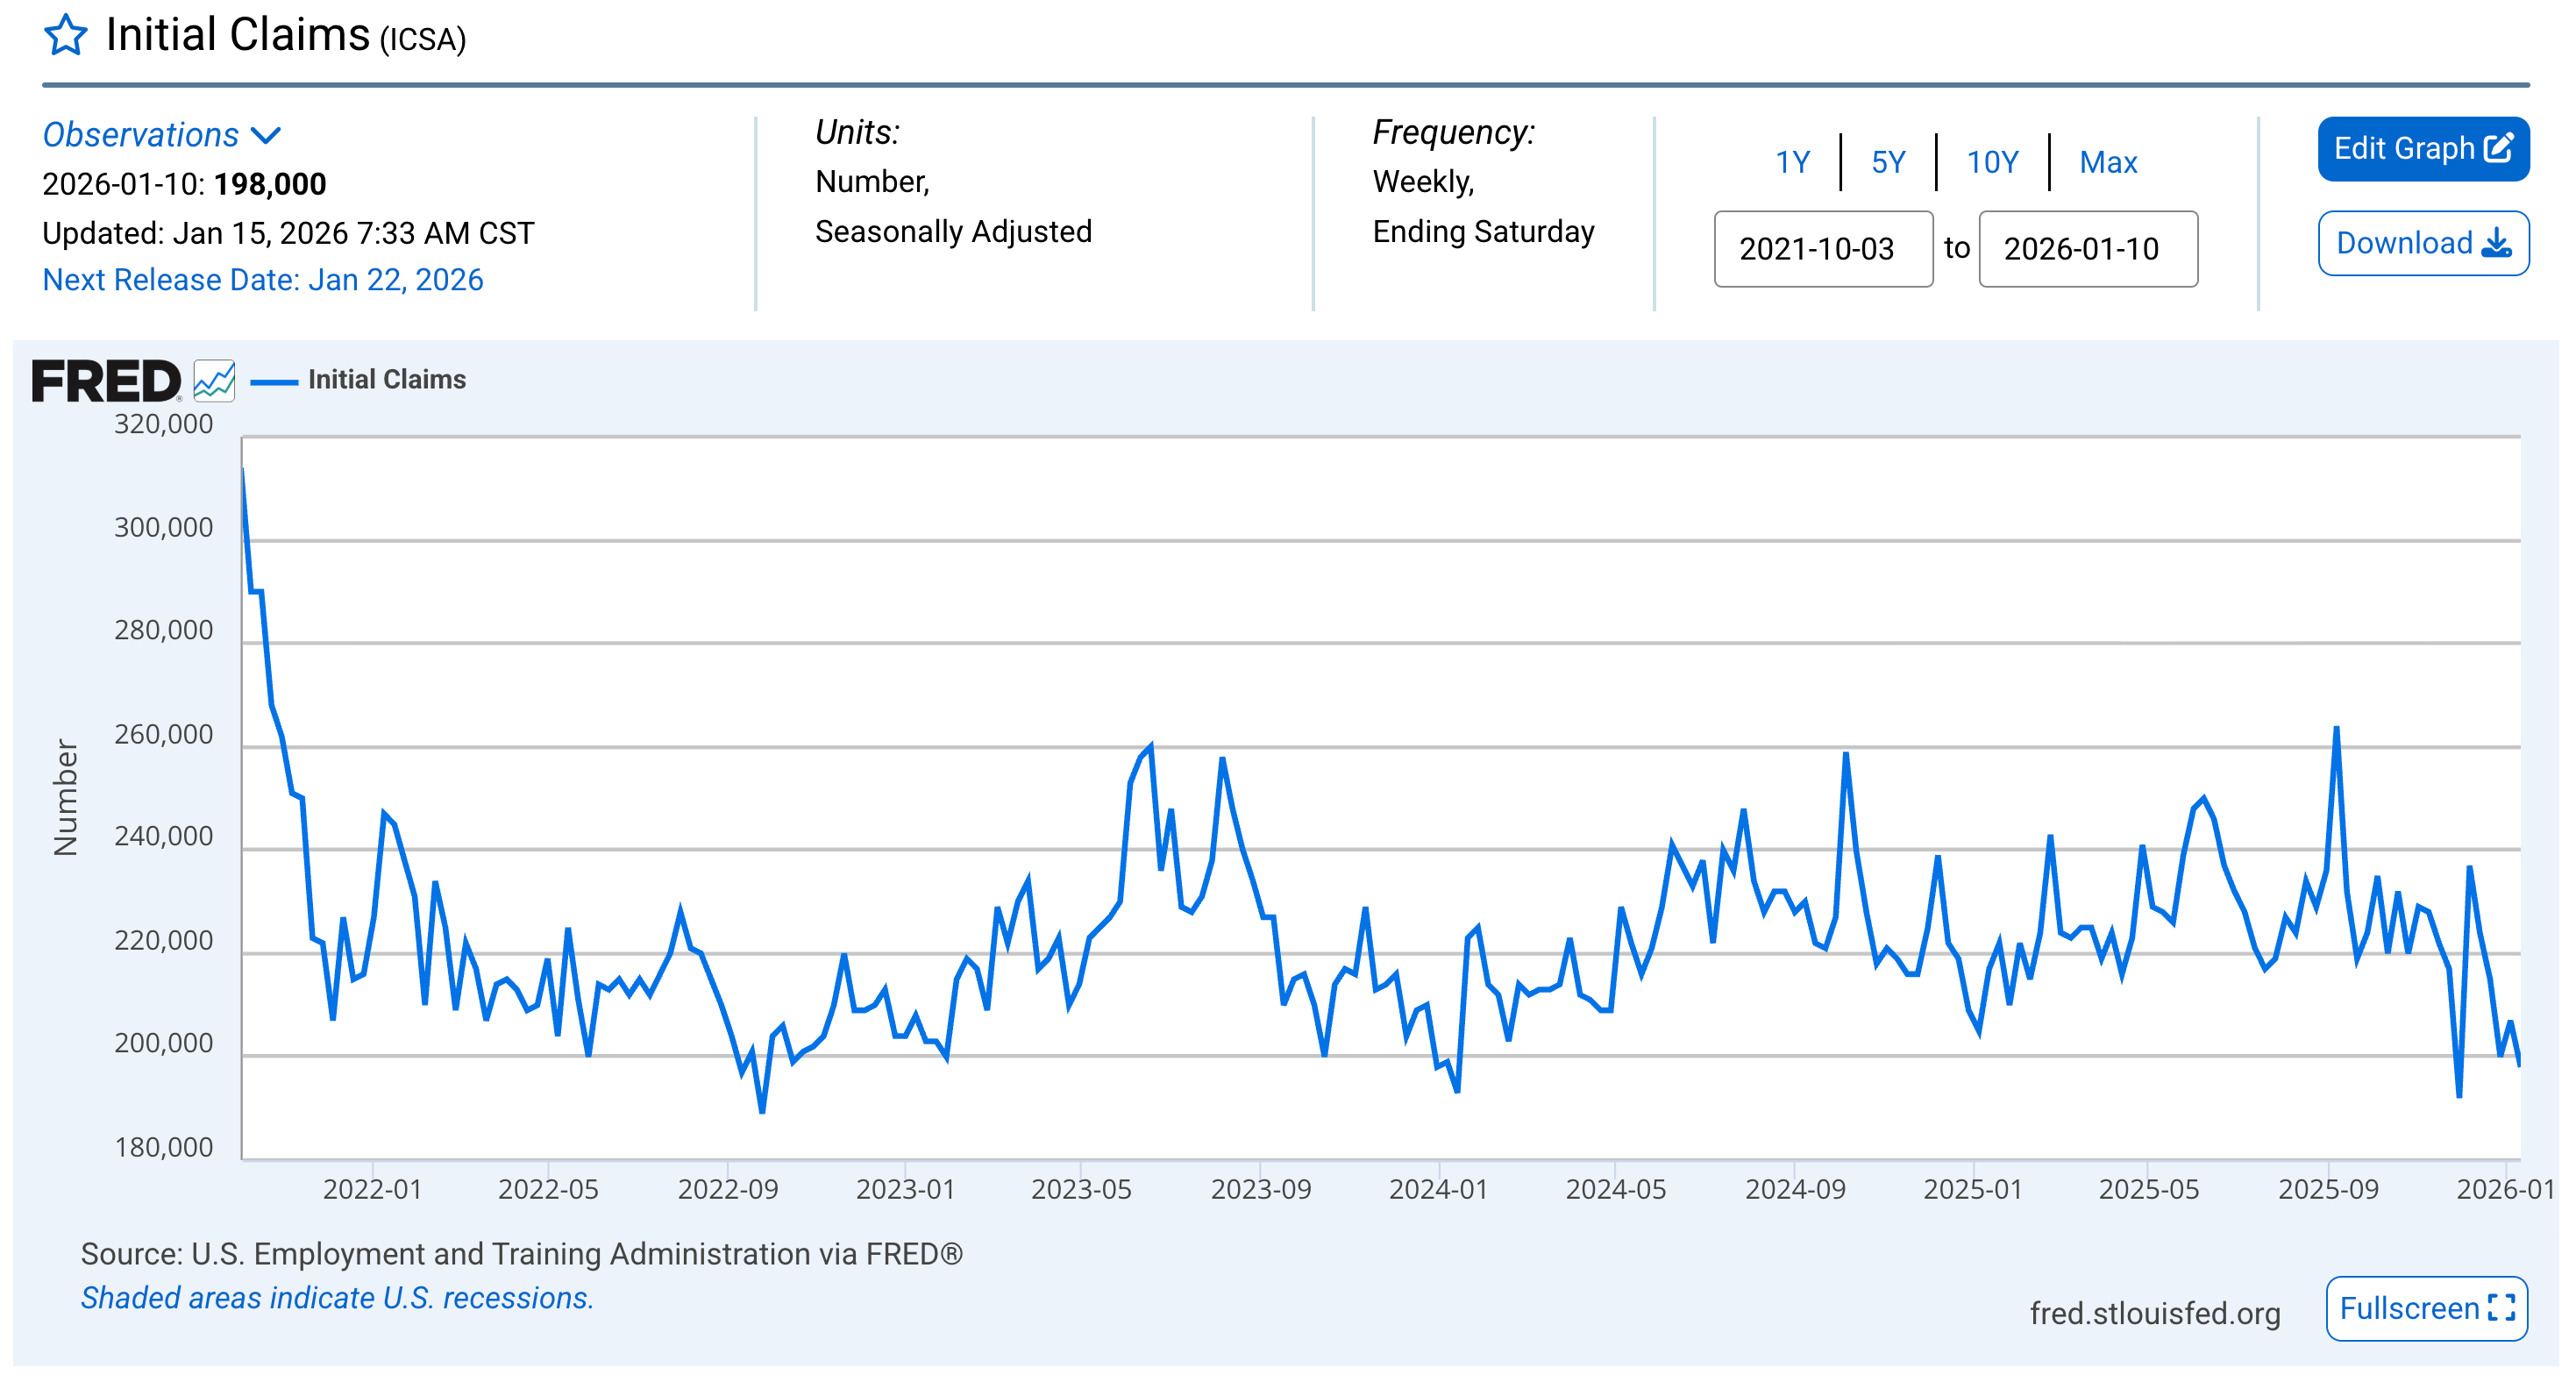
Then add on the fact that initial weekly unemployment claims have leveled off at multi-year lows, while the latest unemployment rate data shows prime-age unemployment (for those in the labor force between ages 25-54) at 3.5%.
So I ask, what’s not to like? Why are so many people complaining? Why the long face?
I guess I’ll keep spreading the message that I’ve consistently shared over the past few years, since I first turned overwhelmingly bullish on stocks again in April 2023…
The U.S. economy is resilient and dynamic.
The stock market is in an uptrend.
Macro data isn’t perfect, but they don’t need to be perfect to support the uptrend.
While there may be occasional reasons to be concerned, either fundamentally or technically, this market generally deserves the benefit of the doubt.
As an investor, the best way for me to make money in the market is to align with the uptrend and to take advantage of the themes that historically produce the best returns during bull markets.
If/when the data changes, then I’ll change my mind.
Until then, while the music’s playing, I have to dance.
And my feet aren’t tired yet.
Best,
Caleb Franzen,
Founder of Cubic Analytics
This was a free edition of Cubic Analytics, a publication that I write independently and send out to 14,500+ investors every Saturday. Feel free to share this post!
To support my work as an independent analyst and access even more exclusive & in-depth research on the markets, consider upgrading to a premium membership with either a monthly or annual plan using the link below:
There are currently 1,150+ investors who are on a premium plan, accessing the exclusive alpha and benefits that I share with them regarding the stock market, Bitcoin, and my own personal portfolio.
DISCLAIMER:
This report expresses the views of the author as of the date it was published, and are subject to change without notice. The author believes that the information, data, and charts contained within this report are accurate, but cannot guarantee the accuracy of such information.
The investment thesis, security analysis, risk appetite, and time frames expressed above are strictly those of the author and are not intended to be interpreted as financial advice. As such, market views covered in this publication are not to be considered investment advice and should be regarded as information only. The mention, discussion, and/or analysis of individual securities is not a solicitation or recommendation to buy, sell, or hold said security.
Each investor is responsible to conduct their own due diligence and to understand the risks associated with any information that is reviewed. The information contained herein does not constitute and shouldn’t be construed as a solicitation of advisory services. Consult a registered financial advisor and/or certified financial planner before making any investment decisions.
Each investor is responsible to understand the investment risks of the market & individual securities, which is subjective and will also vary in terms of magnitude and duration.