Has the Market Gotten Ahead of Itself?
Investors,
There are two house-keeping items that I wanted to share with you.
1. Meetings: I am fully available for 1-on-1 meetings to discuss any questions you might have about market conditions, macroeconomic dynamics, and my expectations for the future. I had my first few bookings this past week & we had such a valuable chat! If you’d like to book a 1-hour slot on my schedule via the following link:

Book a meeting with Caleb Franzen
2. Recommendations: I’m officially recommending the following newsletters regarding macroeconomics, markets and investing. Over the course of my time on Twitter, I’ve made excellent connections with several analysts with whom I’ve built a lot of trust. I’m confident that you’ll gain value from each of their perspectives, analysis, and ideas:
Without further ado, let’s dive into the latest edition of Cubic Analytics:
Macroeconomics:
Macro dynamics in 2022 have entirely been driven by the Federal Reserve, which is influenced by inflation & labor market conditions. While we didn’t receive any major labor market data this week, we did get an updated view on an important gauge of inflation, the Producer Price Index (PPI). While the Fed doesn’t target a particular rate of inflation for producer prices, the PPI creates important context alongside the CPI regarding the direction of inflation.
The latest PPI for the month of October was expected to come in at +8.3% YoY vs. +8.4% in the month of September; however, the result came in significantly below expectations at +8.0%. On a core basis, excluding food & energy, the PPI increased at a pace of +6.7% YoY. This was a major win for the “inflation has peaked” argument, wherein we continue to see decelerating inflation rather than accelerating inflation.

In other words, disinflation appears to have become the current state of affairs, in which broader inflationary pressures seem to be declining.
After better-than-expected results for the October CPI data, the latest PPI report is reaffirming (for now) that inflationary pressures are cooling. With that said, the U.S. economy is still experiencing historic levels of inflation, far beyond the norm. While the Federal Reserve might be sighing in relief that we’re finally seeing a deceleration in the rate of inflation, I don’t believe that they can interpret these developments as an outright win. Clearly, there’s much progress required in order to achieve their long-term target for inflation at 2%.
Regarding how the Federal Reserve is viewing the potential path of monetary policy, there was a critical speech this week worthy of being highlighted. The President of the St. Louis Federal Reserve, James Bullard, gave an interesting presentation in the middle of the week. Titled “Getting into the Zone”, Bullard made a compelling case that the Federal Reserve has a significant amount of tightening yet to do. According to Bullard, the significant monetary tightening (via rate hikes & balance sheet reduction) “appears to have had only limited effects on observed inflation” and that the Federal Reserve still needs to get to a “sufficiently restrictive” policy stance.
In other words, expect more tightening.
Specifically, Bullard provided a target range at which point the federal funds rate could be considered “restrictive” based on the Taylor Rule, a policy tool proposed by Stanford professor, John Taylor, 30 years ago.
Bullard proposed two variations of Taylor’s model, one much more restrictive than the other, in order to produce the recommended policy rate required to tame inflation. With the effective policy rate currently at 3.8%, the targets in this model indicate a much higher rate of ~5% to ~7%. While these models are dynamic, meaning that they will continue to adjust as time & data evolves, this slide helps to acknowledge where policy rates are likely to go.
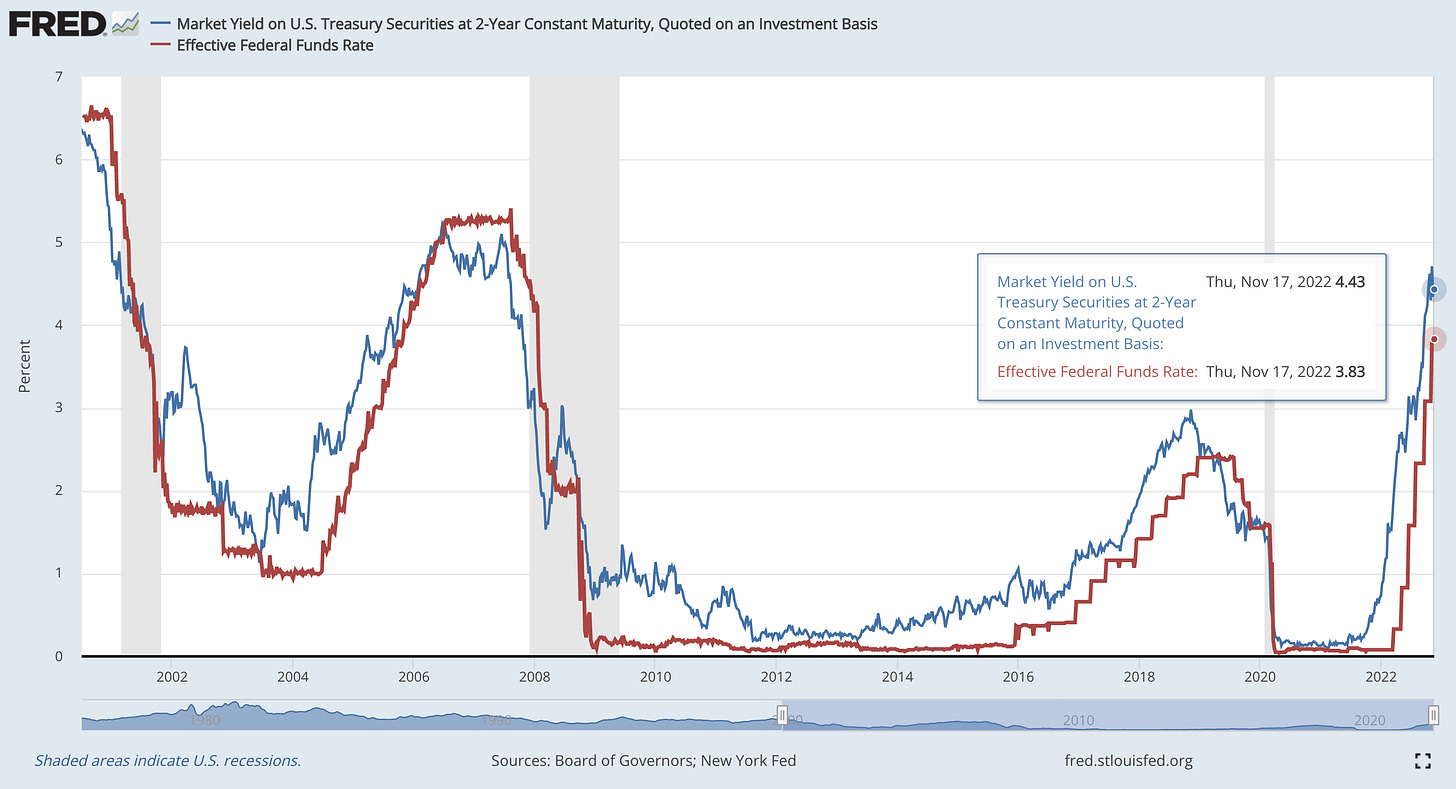
From my perspective, this policy range is reasonable based on what the bond market is currently telling us the “neutral” rate is. However, the Fed doesn’t want to be neutral in order to tame multi-decade high inflation readings — they want to be restrictive. Take this analysis, for example, analyzing the relationship between the 2-year Treasury yield and the effective federal funds rate:
Long-time subscribers & Twitter followers will know that I’ve been sharing this exact chart since February 2022, telling investors that the Federal Reserve’s policy rate is going to follow the 2-year Treasury yield, based on their historic relationship. The spread, or difference, between these two variables tells us how much room the bond market is giving the Federal Reserve to raise rates. At the present moment, the spread is exactly 0.6% (4.43% - 3.83%); however, it’s also important to note that this is a dynamic range. In fact, there is a recursive feedback loop created between the Federal Reserve and the 2-year yield. Why? Because the Fed & FOMC officials have the ability to guide the market via forward guidance, or at the very least, provide clues about where future policy is going to go. Bond investors, considered the “smart money” on Wall Street, skate to where the puck is likely to go rather than where it is right now.
Remember, markets are forward-looking mechanisms. Investors interpret current/lagging data, make an educated prediction about where data will be at various points in the future, and then develop an appetite for risk & valuation for asset prices.
Considering that the bond market is providing a “neutral” rate of 4.43% as of Thursday, the Federal Reserve is likely to raise rates until the federal funds rate is greater than the 2-year Treasury yield. Once that is accomplished, the job isn’t done, as the Fed will need to keep rates “sufficiently restrictive, for some time”, as Powell has repeated. All-in-all, we continue to see evidence from the bond market & outright solicitations by Federal Reserve members that rates still have room to rise. The market continues to digest this information and adjust accordingly, based on the dynamic outlook of how the path of monetary policy is likely to evolve.
Stock Market:
U.S. stocks had a relatively boring week, pulled in opposite directions by recent upward momentum & Federal Reserve forward guidance that hinted towards “higher for longer”. Each day was rather choppy, but generally in favor of the bears. While the Dow was able to remain unchanged for the week, the other major indexes all closed in negative territory.
Dow Jones Industrial Average $DJX ±0%
S&P 500 $SPX -0.7%
Nasdaq-100 $NDX -1.2%
Russell 2000 $RUT -1.75%
Aside from these four primary indexes, the NYSE FANG+ Index $NYFANG generated a weekly return of -0.33%, which I was rather impressed by considering how weak mega-cap tech has performed recently.
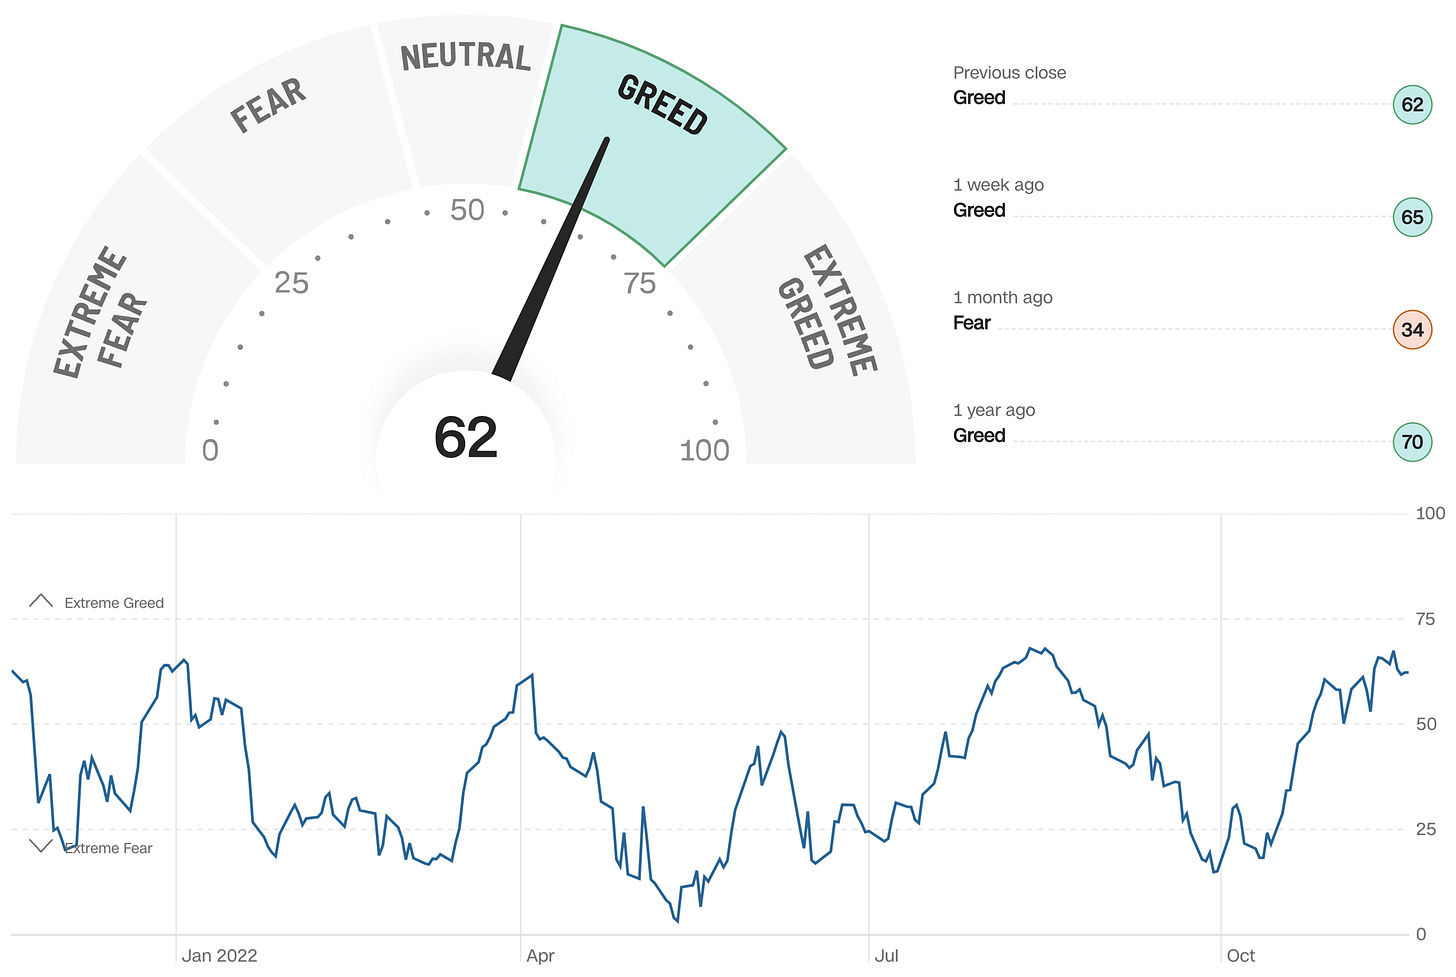
After such a significant rally since the mid-October lows, investors appear to be extremely split on their outlook for stocks in the short term. Greed has certainly returned to the market, reaffirming one of my favorite quotes about the market:
“There’s nothing like price to change sentiment” - Helene Meisler
While this saying can apply to both market direction, it’s clear how this dynamic is influencing investor psychology today.
As investors see stocks continue to climb higher, the immediate reaction is to justify why the stock market is increasing in value. After an extended period of upward momentum, all the investors who were too afraid to buy the bottom (perhaps rightfully so) become greedy, capitulate, and FOMO into the market. Emotional trading & investing prompts “weak” money to come into the market, often acting as exit liquidity for institutional investors. As the market inevitably slows down, “weak” money often gets left holding the bag, thinking that the parade was likely to continue.
In the current market environment, that’s exactly what we’re seeing today, though it’s certainly impossible to know if the indexes have reached a local top. Greed has returned to the market, illustrated by the Fear and Greed Index:
We’ve officially entered the greed phase, reaching the highest level of greed since the mid-August peak. As mentioned above, we don’t know the exact moment or level where the market will hit a local peak, but I think this is a reasonable time to reduce risk in the market. All year, we’ve seen investors become distressed because they weren’t quick enough to raise cash & didn’t take advantage of market rallies to do so. While this current rally could be different, continuing to extend higher, my preference is to raise capital in order to take advantage of potential lower prices in the future.
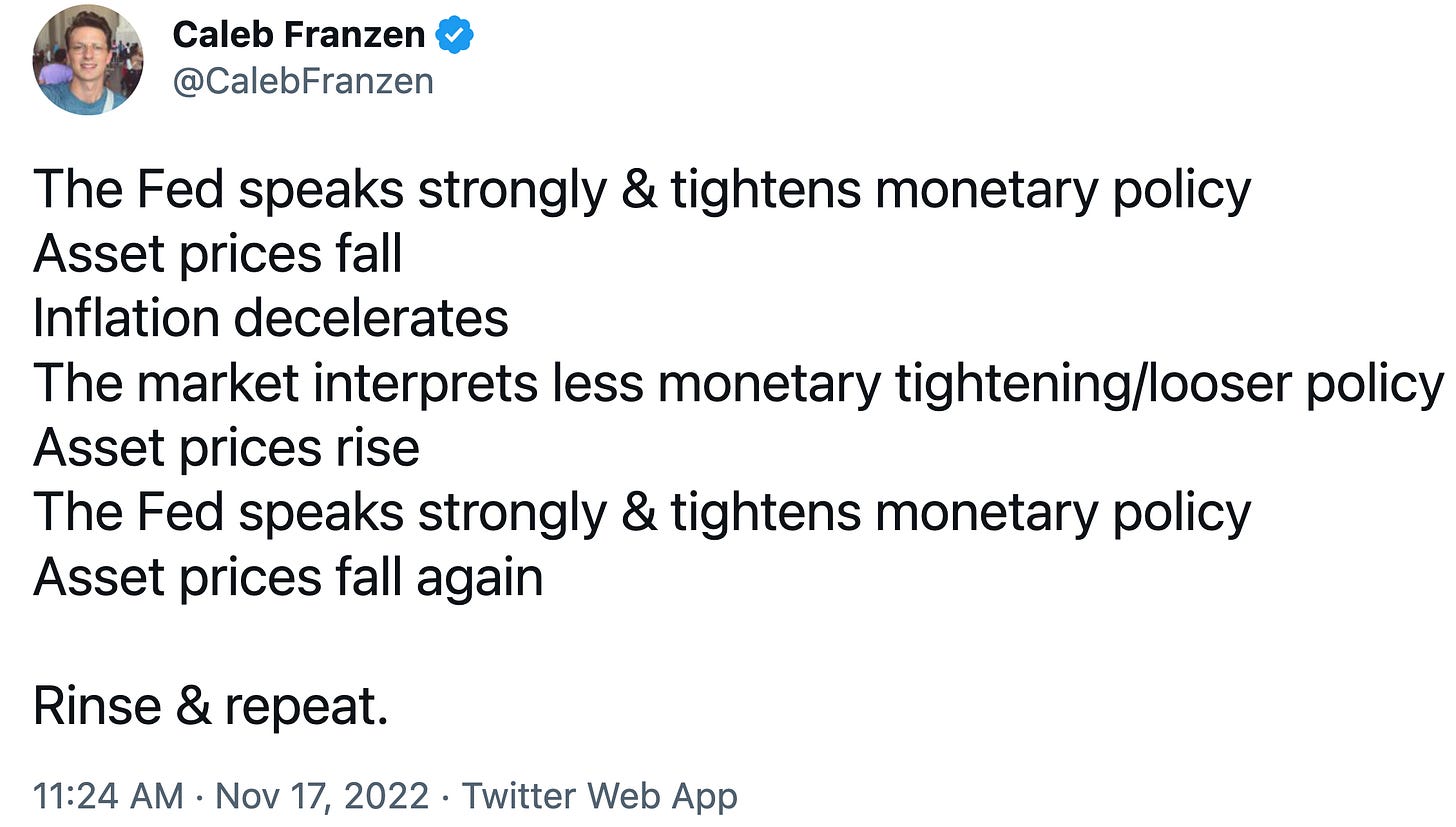
At the present moment, I think markets have gotten ahead of themselves and are likely to get punished by the ongoing monetary policy environment. I discussed this topic earlier in the week when I outlined the continuous market cycle we’ve been facing in 2022:
If you want to know exactly what I’m buying and why, I’d encourage you to read my latest installment of “Portfolio Strategy”, where I share the exact ETF’s I’ve been dollar-cost averaging into lately.
Bitcoin & Crypto:
Without question, the most significant news regarding crypto revolves around the FTX situation and the curious behavior of Sam Bankman-Fried. Generally speaking, I don’t have much value to add on this front, and I think most people are either:
A) Up-to-date on recent developments
B) Tired of hearing about the story
Personally, I’m in both camps & I think it’s safe to say that I don’t have much value to add in this story. At the time of writing, Friday evening, Bitcoin is hovering above $16.6k, modestly above the new YTD lows that occurred on 11/9/22. My general bias is that BTC continues to make new lows over the coming weeks and/or months, particularly considering that we are still facing headwinds from rising interest rates. In my view, there’s no need to front-run the Fed. Why?
Markets (stocks & crypto) bottomed in December 2018, when the Federal Reserve officially announced that they were pausing rate hikes.
Markets bottomed in March 2020, when the Federal Reserve launched a bazooka of monetary stimulus, purchasing Treasuries, mortgage-backed securities, and corporate debt.
Markets peaked in November 2021, when the Federal Reserve announced that they would be tapering asset purchases & reducing the amount of QE that they were injecting into the financial system. As QE turned to QT in March 2022, asset prices have faced even more headwinds.
I’ll repeat: there’s no need to significantly front-run the Fed.
Returning back to Bitcoin, one chart in particular caught my attention this week. Below is the relative performance of Bitcoin vs. Treasuries TLT 0.00%↑:
This long-term chart visualizes the outperformance of Bitcoin relative to the premier risk-less asset, in which we can discern clear levels of price structure. With BTC/TLT breaking below a multi-year support trendline, I’m fearful that momentum continues to manifest in a bearish way. This latest breakdown significantly increases the likelihood that BTC/TLT retests the 2017 peak from the former bull market, at which point we will need to reassess if price is able to rebound or continue to break down.
Considering that Bitcoin denominated by M2 money supply has already fallen below the 2017 cycle peak, my best estimate is that BTC/TLT will follow suit.
In fact, BTC/M2 has already fallen to the 2019 peak & has started to dip below it. It’s too soon to know if this is a decisive breakdown or if BTC/M2 is starting to rebound, but I wouldn’t expect to see any deviation between BTC/USD, BTC/TLT and BTC/M2. From my perspective, we should actually be willing to accept the fact that BTC/M2 is leading BTC/TLT lower, which is leading BTC/USD lower, especially considering that we are in a market environment dominated by monetary policy.
By analyzing the price structure of BTC/M2 above, trading just on the 2019 peak, that gives an implied price of BTC/USD equal to $11,600. This price target aligns with other targets that I’ve derived from a variety of different analysis, generally ranging between $10k and $13.7k. Once again, I reaffirm my expectation for more crypto downside.
Best,
Caleb Franzen
DISCLAIMER:
My investment thesis, risk appetite, and time frames are strictly my own and are significantly different than that of my readership. As such, the investments & stocks covered in this publication are not to be considered investment advice and should be regarded as information only. I encourage everyone to conduct their own due diligence, understand the risks associated with any information that is reviewed, and to recognize that my investment approach is not necessarily suitable for your specific portfolio & investing needs. Please consult a registered & licensed financial advisor for any topics related to your portfolio, exercise strong risk controls, and understand that I have no responsibility for any gains or losses incurred in your portfolio.


