Forward-Looking Returns Are Enticing
... and could become even more attractive
Investors,
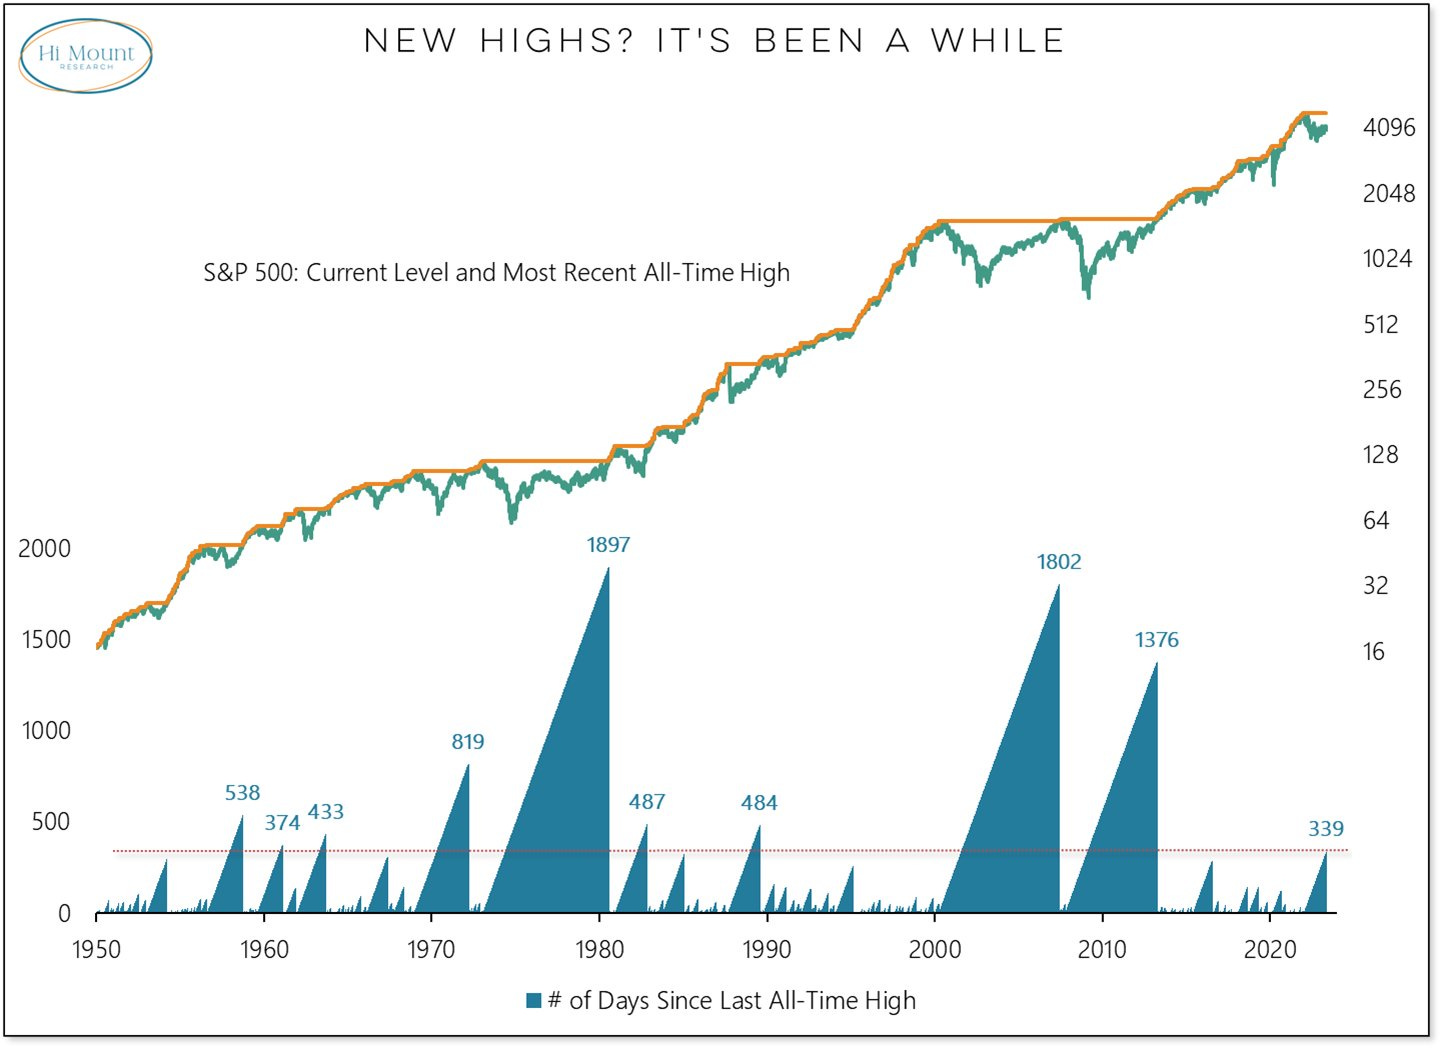
There have been 340 trading days since the S&P 500 produced new all-time highs, which, according to Willie Delwiche, is the longest such streak over the past decade and the 10th longest streak since 1950.
For context, it took 1,376 trading days (or roughly 2,000 calendar days) for the S&P 500 to recover the losses from the Great Recession and produce new all-time highs. Of all the cases since 1950 that took at least 340 days to reach new ATH’s, they required an average of 855 trading days to reach the next all-time high milestone.
I found this to be extremely interesting and decided to build a forward-looking study based on some assumptions around this data. Here are the key assumptions:
Understanding that the current time since the last ATH’s is 340 days, the implication is that similar periods have lasted for an average of 855 total days before reaching new ATH’s.
Therefore, the data suggests that the market could be less than halfway to the next all-time high, considering that 855 minus 340 is 515 trading days.
This implies that the next ATH would occur in 2025.
For the sake of simplicity, let’s assume that new ATH’s are exactly 2 years away, meaning that the S&P 500 hits a new ATH in May 2025.
We can then extrapolate this S&P 500 data and apply the timeline to other indexes and individual stocks. In other words, if the S&P 500 is hitting new ATH’s in May 2025, it’s probable that the Nasdaq-100 and other great stocks are doing the same thing plus/minus a few months.
Using these assumptions, I decided to calculate the forward-looking return implications for the S&P 500 and other notable stocks, calculating the potential returns per share, compounded annual growth rate (CAGR) over a two-year period, and the total annual return based on the current dividend yield.
The results were quite amazing, though I will note that I hand-picked these stocks to highlight some of the intriguing opportunities I’m seeing in the market and to show strong results across a variety of different companies.
First of all, you’ll notice that the CAGR for the S&P 500 is roughly +8%, which is the average calendar year return for the S&P 500 in a post-WW2 era. In other words, this outcome is “standard” and absolutely within the realm of possibilities!
I also included some notable stocks that you should be familiar with, which are all multi-billion dollar corporations that have a long track record of success. While each of these companies have risk, they aren’t high-flyer bets on unprofitable companies or recent IPO’s with relatively unproven technologies or customer bases. They range from mega-cap tech stocks to semiconductors, consumer discretionary, healthcare, financials, REIT’s, and consumer staples.
Including the dividend yield to calculate the total implied return, we can see that there are an abundance of opportunities in the market that have an ability to outperform the historical returns for the S&P 500 based on our assumptions.
Could my assumptions be wrong? Yes.
Could it take 4 years instead of 2? Yes.
Could these stocks go much lower? Yes.
Could it be a volatile path en route to new ATH’s? Yes.
However, all of these questions/risks/doubts are ever-present in financial markets and they are simply unavoidable. The purpose of this study and the table above is simply to highlight that the S&P 500’s return profile is normal relative to historical data and that an investor with a 2-year holding period has an abundance of opportunities in the market to consider, even after such strong market returns over the past 6 months.
And here’s something else to think about: If the market goes lower from here, which is probable by all metrics that I look at, the forward-looking returns that are shown above will only become even more attractive. This is one reason why I encouraged investors to be opportunistic (but defensive) in the second half of 2022 and why I continue to reiterate this same message today.
In the remainder of this report, I’ll cover important market data and developments that are occurring under-the-hood, particularly focusing on:
S&P 500 internals & my expectations for the market.
Analyzing earnings and my outlook for earnings going forward.
On-chain Bitcoin fundamentals
In addition to the material above, this report will cover a wide range of datapoints and focus on 9 important charts for the stock market and Bitcoin.
I’d also like to offer free members a 10% discount using the link below, so that you can access the full capabilities of a Cubic Analytics membership and read the remainder of this report (and future weekly premium reports).
Please reach out if you have questions!


