Investors,
I’m back.
After taking a brief vacation, traveling to Dubai, Hong Kong, Bali, and Malaysia (see photos below), you can expect for all Cubic Analytics research to return to the regularly scheduled programming.
As a reminder, before we dive into this free report & analysis, this is the schedule:
Every Saturday, you will receive a free edition of Cubic Analytics, analyzing a variety of significant developments in macroeconomics, the stock market, and Bitcoin. This three-pillar approach is why I named my company Cubic Analytics.
Every Sunday, a paid edition of Cubic Analytics will be published, exclusive only for monthly/annual members here on Substack. This in-depth reports are designed to focus explicitly on how both investors and traders should view market conditions, for both stocks and crypto. These reports are actionable and provide a real-time pulse on how I’m viewing the market based on weekly data.
On a weekly basis, I host a conference call for premium members of Cubic Analytics. These calls allow me to provide a mid-week diagnosis on the market and it also acts as a Q&A forum to give premium members to ask me specific questions directly.
If you’re ready to upgrade to a premium membership, join 950+ other investors, and access the full capabilities of my research at Cubic Analytics, sign up using this link:


I’m currently in Seoul, so if you live here or happen to be visiting here, please reach out and I’d love to meet up with any market-related nerds like me!
Let’s begin this latest edition of Cubic Analytics…
Macroeconomics:
Disinflation is intact, it’s just happening slower than I’ve hoped for.
Both the CPI and PPI data for December 2024 came in below estimates, but the results weren’t decisively a “win” from the Federal Reserve’s perspective.
Nonetheless, a win is a win and good data is sufficient to support the bull market.
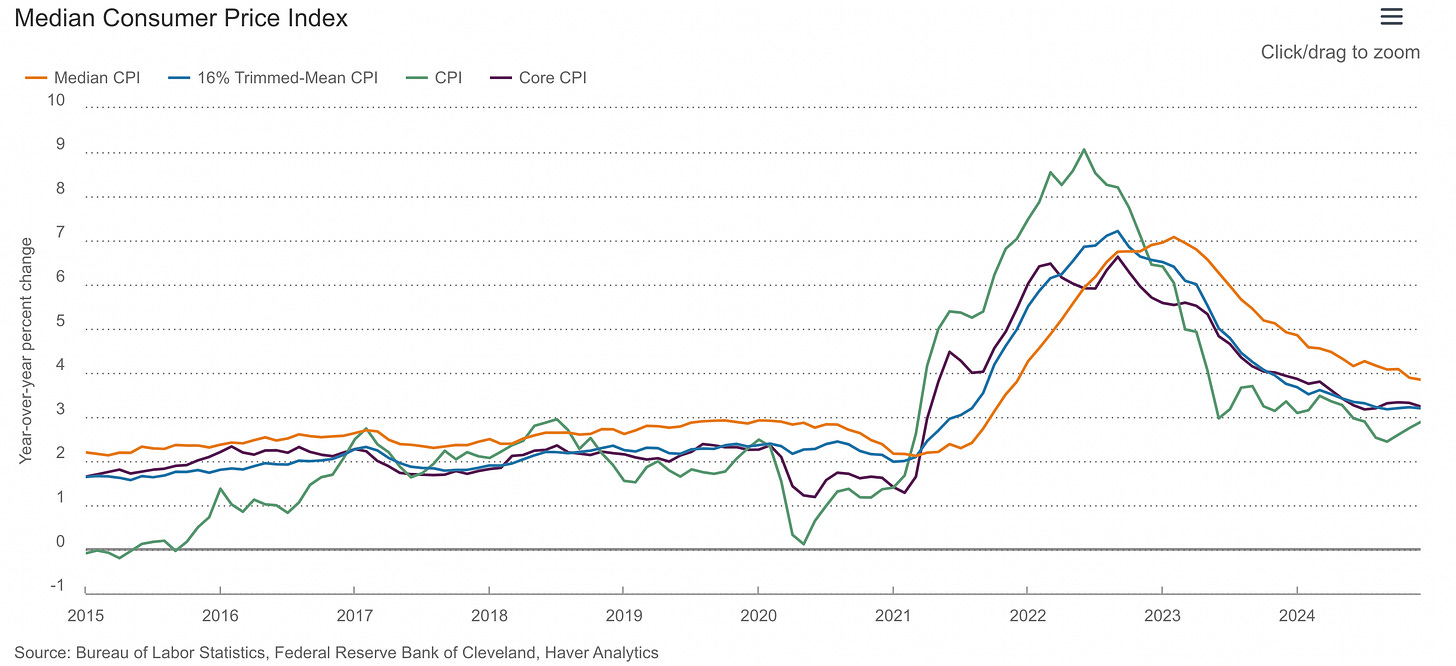
Focus on the orange line below, tracking median CPI inflation on a YoY basis:
All I see is a steady & persistent, albeit slow, deceleration of inflation.
For those who aren’t aware, that’s the definition of disinflation: A deceleration in the rate of inflation.
The latest result came in at +3.85% YoY, down from +3.89% YoY in November 2024 and down from +4.92% YoY in December 2023.
Again, we can nit-pick about how the pace of disinflation isn’t happening fast enough, but it’s widely apparent that the median component within the CPI basket is still experiencing disinflation.
The Shelter component of CPI continues to experience disinflation on a YoY basis, marching lower after being historically elevated, now down to +4.6% YoY. This is significant because Shelter alone is 33% of the headline CPI weighting and 41% of the core weighting.
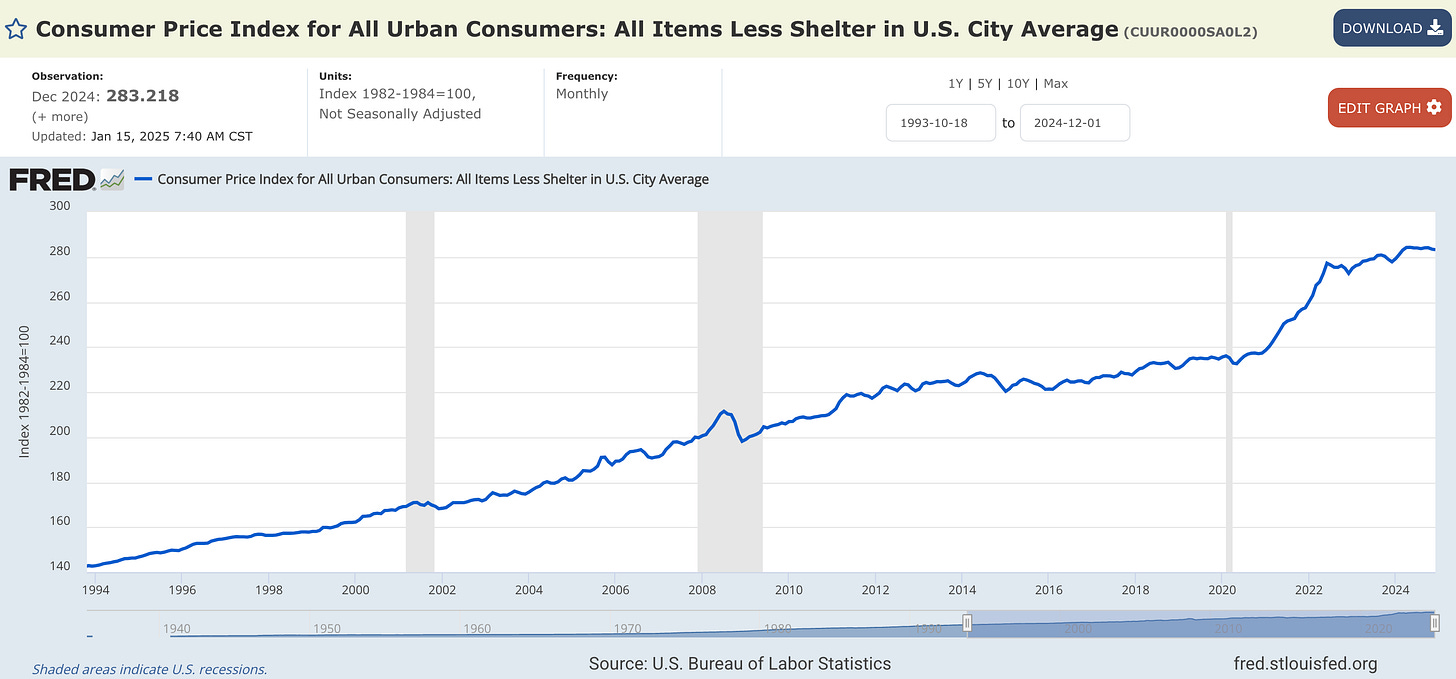
If we strip Shelter out of the inflation reading and simply measure the All Items Less Shelter component, this datapoint is experiencing an inflation rate of +1.9%.
While it’s unfortunately been reaccelerating for the past several months, not emblematic of disinflation, the good news is that this datapoint is (and has been) below the Federal Reserve’s 2% inflation target.
Even if it moderately accelerates in the months/quarters ahead, I still don’t think it would pose a significant threat to the ongoing bull market in equities.
The second piece of good news with this datapoint is that the index itself is starting to roll over, or that it’s at least stopped rising at a significant pace:
From the Fed’s view, that’s a sufficient success story, especially if it continues alongside a resilient & dynamic labor market (which I expect).
Another important piece of the macro puzzle is the continued resilience of industrial production, which grew at a pace of +0.9% MoM in December 2024. Historically, over the course of the past ~15 years, strong bull markets have been able to occur during periods where industrial production is steadily chopping around these levels.
So long as broad-based disinflation occurs amidst a backdrop of a resilient & dynamic macroeconomic environment, then investors should continue to experience tailwinds.
Stock Market:
The S&P 500 ($SPX) gained +2.9% this week, now only +1.7% away from its highest daily close of all time. The index has achieved a bull flag breakout, while continuing to hold above the mid-2024 highs (green) and its 200-day moving average cloud.
I also want to highlight the daily bullish RSI divergence that’s occurring, which could be very constructive, though I typically prefer these divergences to occur once they reach an oversold reading.
While many of the bulls who I respect threw in the towel on this bull market, I’ve continued to believe that this market deserves the benefit of the doubt and that we should allow the market to produce a higher low.
Maybe that higher low is officially in.
Maybe we have a bit more pain left and retest the green support zone.
I don’t know.
But the beautiful thing about being so heavily allocated over the past 18+ months is that I’m not in a rush to make decisions or let emotions get the best of me.
I can simply sit back, relax, and let the market do what it does.
Thankfully, that’s given me the patience and the willingness to be fully invested during this week’s rebound and re-capture any of the pain that I recently experienced.
We must remember that bull markets (or uptrends) have two phases:
The production of higher highs
The production of higher lows
Therefore, we must accept that uptrends/bull markets are going to experience inevitable pullbacks that don’t feel good in the short-term, but it’s up to each and every single one of us to do the work and build the conviction to trust that it’s going to produce a higher high once again.
And that’s exactly what I’ve been comfortable to do.
Bitcoin:
The apex digital asset is back above $100k.
Better yet, Bitcoin even hit $105k Friday night, with the asset now trading at $103k at the time of writing (6am ET).
I continue to remain bullish, based on the weight of the evidence of the data, but I also recognize that we might have to digest some of these recent gains after the rip from $89k to $105k in less than a week.
Specifically, I’ll be paying attention to this range, shown using 4hr candles:
A decline between $98k to $100k would provide an opportunity to use the blue range as support once again after the recent breakout, and would also align with the two anchored volume-weighted average prices, shown in red and green.
These “AVWAP pinches” are classic setups with proven price memory that the market is tethered to, and it just so happens that these dynamic levels are roughly aligned with the blue horizontal range.
Zooming out, Bitcoin continues to trade above its key exponential moving averages:
🔵 21-day EMA
🔴 55-day EMA
🟢 200-day EMA
All three EMAs have a positive/rising slope and are in a bullish formation, where the short-term EMA is trading above the medium-term EMA and the medium-term EMA is trading above the long-term EMA.
For bulls, this is fantastic news.
You’ll also notice the near-perfection with which Bitcoin used the 55-day EMA as dynamic support during the local lows in December 2024 through January 2025.
This looks like a classic bullish retest, as far as I’m concerned.
Based on this data, I continue to reiterate that we are in a bull market and that we should act accordingly (long & strong) in order to capture as much wealth creation as possible.
My price target of at least $175,000 for this cycle is intact and I remain committed to this target until we have sufficient evidence that the bull market is deteriorating and/or outright ending.
If/when that evidence arises, I’ll be objective enough to recognize it.
Best,
Caleb Franzen,
Founder of Cubic Analytics
This was a free edition of Cubic Analytics, a publication that I write independently and send out to 12,200+ investors every Saturday. Feel free to share this post!
To support my work as an independent analyst and access even more exclusive & in-depth research on the markets, consider upgrading to a premium membership with either a monthly or annual plan using the link below:
DISCLAIMER:
This report expresses the views of the author as of the date it was published, and are subject to change without notice. The author believes that the information, data, and charts contained within this report are accurate, but cannot guarantee the accuracy of such information.
The investment thesis, security analysis, risk appetite, and time frames expressed above are strictly those of the author and are not intended to be interpreted as financial advice. As such, market views covered in this publication are not to be considered investment advice and should be regarded as information only. The mention, discussion, and/or analysis of individual securities is not a solicitation or recommendation to buy, sell, or hold said security.
Each investor is responsible to conduct their own due diligence and to understand the risks associated with any information that is reviewed. The information contained herein does not constitute and shouldn’t be construed as a solicitation of advisory services. Consult a registered financial advisor and/or certified financial planner before making any investment decisions.
Each investor is responsible to understand the investment risks of the market & individual securities, which is subjective and will also vary in terms of magnitude and duration.


Caleb - I have been a subscriber for a while now - as such my investing strategy has been altered by what I've learned - by the investing strategy I see you living out daily.
I saw the initial changes seep in during early '23 as I became comfortable with my interpretation of your strategy. I did research and much DD and identified a major holding in each of 2 accounts to which I rebalanced such that my major holding was 35% of the account balance. I also trimmed my holdings to no more than 6 equities total. In account 1, my major holding is $PLTR and the initial rebalance was done in early '23.
In the 2nd account my major holding as to be $BTC held as an ETF, in my case $FBTC. I had originally planned this rebalance for mid-2023, but ETC approval dragged and I implemented the rebalance in January of 2024.
What has been great is to do my research, map out my plan and then let the plan play out. The first real test was this most recent drawdown where some significant gains were in short term jeopardy - but I stuck to the plan.
I am a Christ follower - so he gets the credit, but he used you over the past couple of years to effect real change in my investing approach. So that credit belongs to you. Many thanks.
Great thoughts as usual. It is interesting how some well-respected bulls are starting to throw in the towel one by one. I kind of like that though. Some folks will be early, and that's necessary for the market to continue with further upside.