Far From Perfect
Investors,
Inflation is stabilizing while labor market conditions remain resilient & dynamic.
Specifically, the latest round of CPI data showed headline inflation at +2.57% YoY (the 2nd lowest print since March 2021) and initial unemployment claims were 217k (the lowest result since May 2024).
The economy is far from perfect, and yet…
The S&P 500 is up +23.3% YTD and has made new all-time highs 51 times in 2024.
Despite this week’s sell pressure, the U.S. stock market is still trading above key medium and long-term moving averages:
🔵 50-day EMA
🔴 100-day EMA
🟢 200-day EMA
Meanwhile, Bitcoin is trading at $91,300 at the time of writing (4:30am ET, Saturday).
The apex digital asset is up nearly +20% since the market close on Friday, November 8.
Clearly, the economy hasn’t needed to be “perfect” in order to produce material returns.
And to be clear, there is no such thing as a perfect macroeconomic environment that is absent of risk, concerns, or pockets of outright weakness. Risk is ever-present and a constant feature of the market (and the world).
To be an investor, fundamentally, one must be willing to accept risk.
Those who are unwilling to accept risk are faced with a different type of risk — the risk that asset prices continue to trend higher and reward market participants with a long-term mindset.
So however you slice it, the investor faces risk and the non-investor faces risk too.
I don’t know about everyone else, but I prefer the risk where the reward allows me to grow my net worth and improve my quality of life over time.
Before we dive into the rest of the report, I want to express my appreciation to have so many investors who are interested in my work. Cubic Analytics has recently surpassed 11,000 investors (again, after removing 2,500+ inactive subscribers) who are receiving my free research every single Saturday. If you enjoy my research and benefit from the analysis, please share Cubic Analytics with anyone who might be interested, or even consider upgrading to a premium membership to get even more insights/benefits.
Macroeconomics:
There are two charts that I want to highlight.
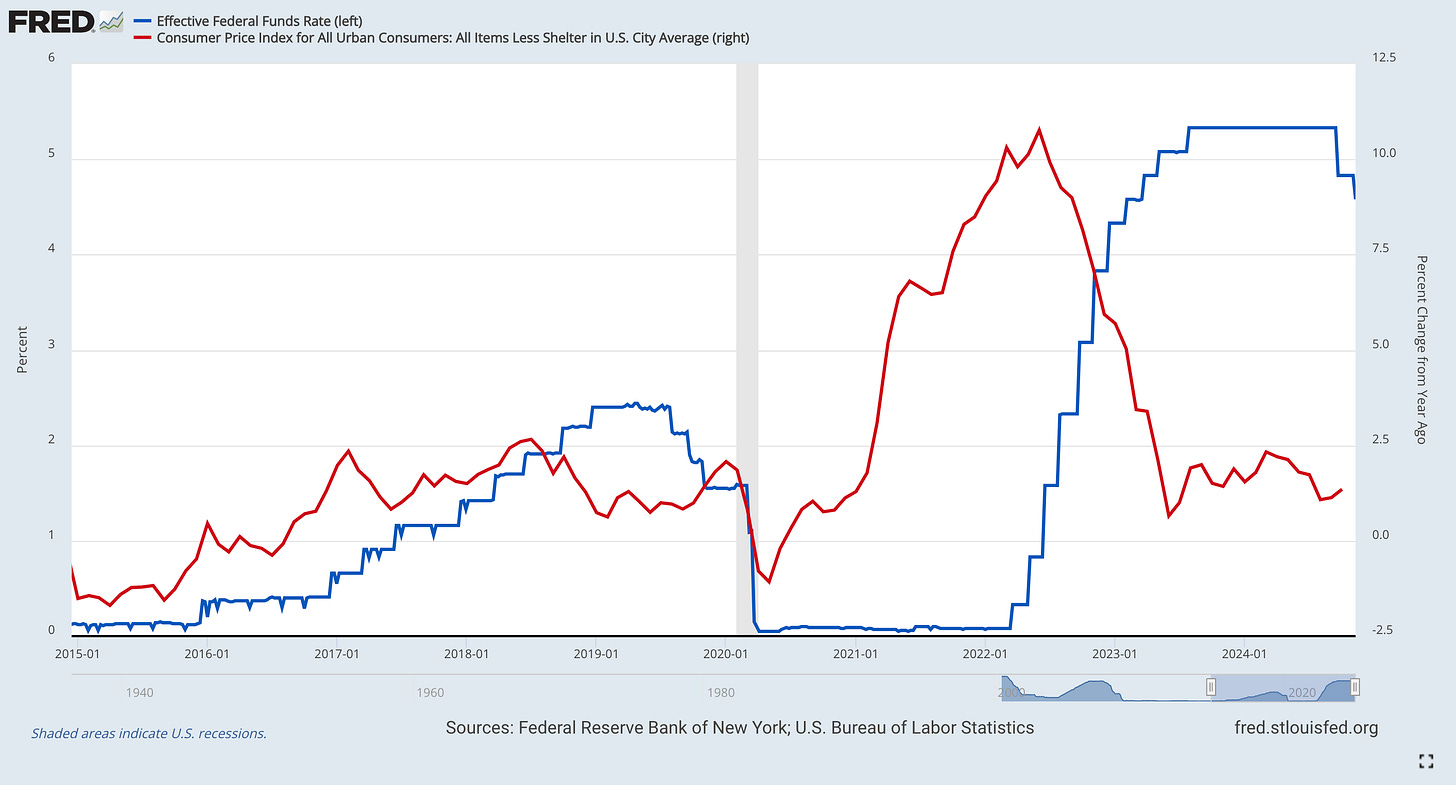
First, regarding inflation and monetary policy, the chart below shows the relationship between the Federal Reserve’s effective fed funds rate and the year-over-year rate of CPI inflation for the All Items Less Shelter measurement:
The current rate of aggregate non-Shelter inflation in October 2024 is +1.3% YoY (a moderate acceleration vs. the +1.1% result in Sept.’24); however, it’s clear that non-Shelter components within the CPI are experiencing stable annual inflation in the 1% to 2% range for the past ~18 months. This is important because the Fed’s inflation target is +2%, so this measurement (which excludes the lag effects & outsized weighting of Shelter) is already well-below the Fed’s target.
The Fed is a slow-moving institution (although you probably didn’t need me to tell you that), and this chart proves that their policy is reactive based on the direction & trend of inflation dynamics. Given the significant spread between non-Shelter CPI inflation and their current fed funds rate, I think it’s clear that the Federal Reserve will continue to lower interest rates in the months/quarters ahead, barring a material and sustained acceleration of inflation.
I also wanted to highlight an unrelated chart, looking at the recent Empire State Manufacturing Index:
The index, designed to track manufacturing conditions in the state of New York, just reached its highest levels since December 2021 and had one of its highest readings (31.2) over the past 10 years. Given that Wall Street estimates predicted that the result would come in at -0.3 and the prior result was -11.9, this was a substantial beat!
While other manufacturing data is less than perfect, like industrial production coming in at -0.3% YoY or the manufacturing PMI’s in contractionary territory, I think this data provides important context about ongoing state of affairs.
Stock Market:
In similar fashion to the macro section, these two datapoints need to be on your radar:
1. This has been a historic rally for the U.S. stock market, particularly on a relative basis vs. international stocks. We can prove this in two ways, looking at a long and short-term view:
A) The S&P 500 is making new all-time highs relative to non-U.S. stocks, as shown by the all-time chart of SPX/VXUS, which therefore highlights the superiority of U.S. capital markets, their companies, and their ability to generate shareholder returns.
For my entire 11-year career as an investor, I’ve heard talking heads & pundits predict that international stocks are going to start outperforming U.S. stocks, due to a wide range of justifications. They called it a catch-up trade. They called international stocks better value and “safer”. Regardless of their justification, they’ve been consistently wrong and suffered extreme underperformance vs. U.S. stocks.
B) As of November 12, 2024, the S&P 500 completed its best 5-day returns relative to international stocks since the Great Financial Crisis, as shown by this chart from Mike Zaccardi:
So as we think about the U.S. stock market taking a breather after the ATH print on Monday, I think it’s important (if not vital) to contextualize the ongoing pullback against the strength of the rally over the past several weeks, months, and quarters.
The S&P 500 is up +23.3% YTD, +30.5% YoY, and +53.2% since the start of 2023.
Bull markets have pullbacks, corrections, and periods of consolidation.
If this is one of those periods (currently down -2.16% from the ATH daily close on Monday), then it would likely be completely normal and healthy behavior as investors digest some of the market’s phenomenal returns.
2. As we think about long-term performance of the stock market, this chart from Ben Carlson at Ritholtz Wealth Management provides a key perspective for investors, showcasing the frequency of +30% calendar year returns for the S&P 500:
The fact of the matter is that +30% calendar year returns are much more common than you think, occurring in 18 times in the past 96 years (or 18.8% of the time). With 6 trading weeks left in 2024, it’s possible that the S&P 500’s current YTD return of +23.3% could cross the +30% threshold…
And if it did, this data tells us that it probably wouldn’t be too surprising.
Bitcoin:
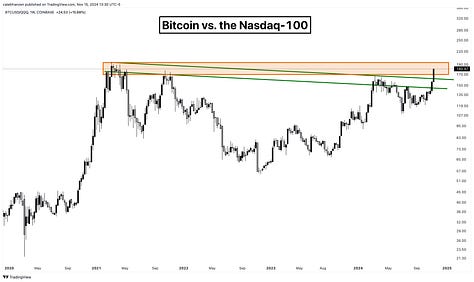
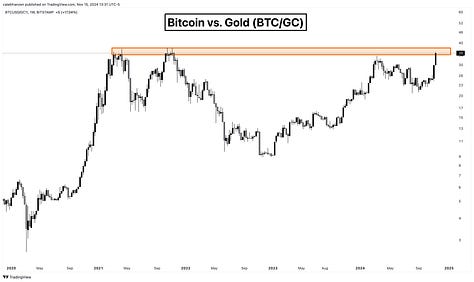
This post that I shared on X highlights the key Bitcoin dynamics that I’m watching.
You can access each of these four charts in full-size directly on X or below, in addition to two other relevant comparisons that I think are worth watching closely:


We are in a bull market folks. I think it’s important to stay aligned with the uptrend.
Best,
Caleb Franzen,
Founder of Cubic Analytics
This was a free edition of Cubic Analytics, a publication that I write independently and send out to 11,000+ investors every Saturday. Feel free to share this post!
To support my work as an independent analyst and access even more exclusive & in-depth research on the markets, consider upgrading to a premium membership with either a monthly or annual plan using the link below:
DISCLAIMER:
This report expresses the views of the author as of the date it was published, and are subject to change without notice. The author believes that the information, data, and charts contained within this report are accurate, but cannot guarantee the accuracy of such information.
The investment thesis, security analysis, risk appetite, and time frames expressed above are strictly those of the author and are not intended to be interpreted as financial advice. As such, market views covered in this publication are not to be considered investment advice and should be regarded as information only. The mention, discussion, and/or analysis of individual securities is not a solicitation or recommendation to buy, sell, or hold said security.
Each investor is responsible to conduct their own due diligence and to understand the risks associated with any information that is reviewed. The information contained herein does not constitute and shouldn’t be construed as a solicitation of advisory services. Consult a registered financial advisor and/or certified financial planner before making any investment decisions.
Please be advised that this report contains a third party paid advertisement and links to third party websites. The advertisement contained herein did not influence the market views, analysis, or commentary expressed above and Cubic Analytics maintains its independence and full control over all ideas, thoughts, and expressions above. The mention, discussion, and/or analysis of individual securities is not a solicitation or recommendation to buy, sell, or hold said security. All investments carry risks and past performance is not necessarily indicative of future results/returns.
Each investor is responsible to understand the investment risks of the market & individual securities, which is subjective and will also vary in terms of magnitude and duration.


