


Extremes Are Normal

Investors,
This level of market volatility is absolutely insane.
For example, the VIX just had 4 consecutive sessions in which in traded above 50.
The last times that happened?
October 2008
March 2020
That’s it.
That’s the entire list.
As you’d expect with a consistently elevated VIX, there were huge moves in the S&P 500 since last Friday’s close:
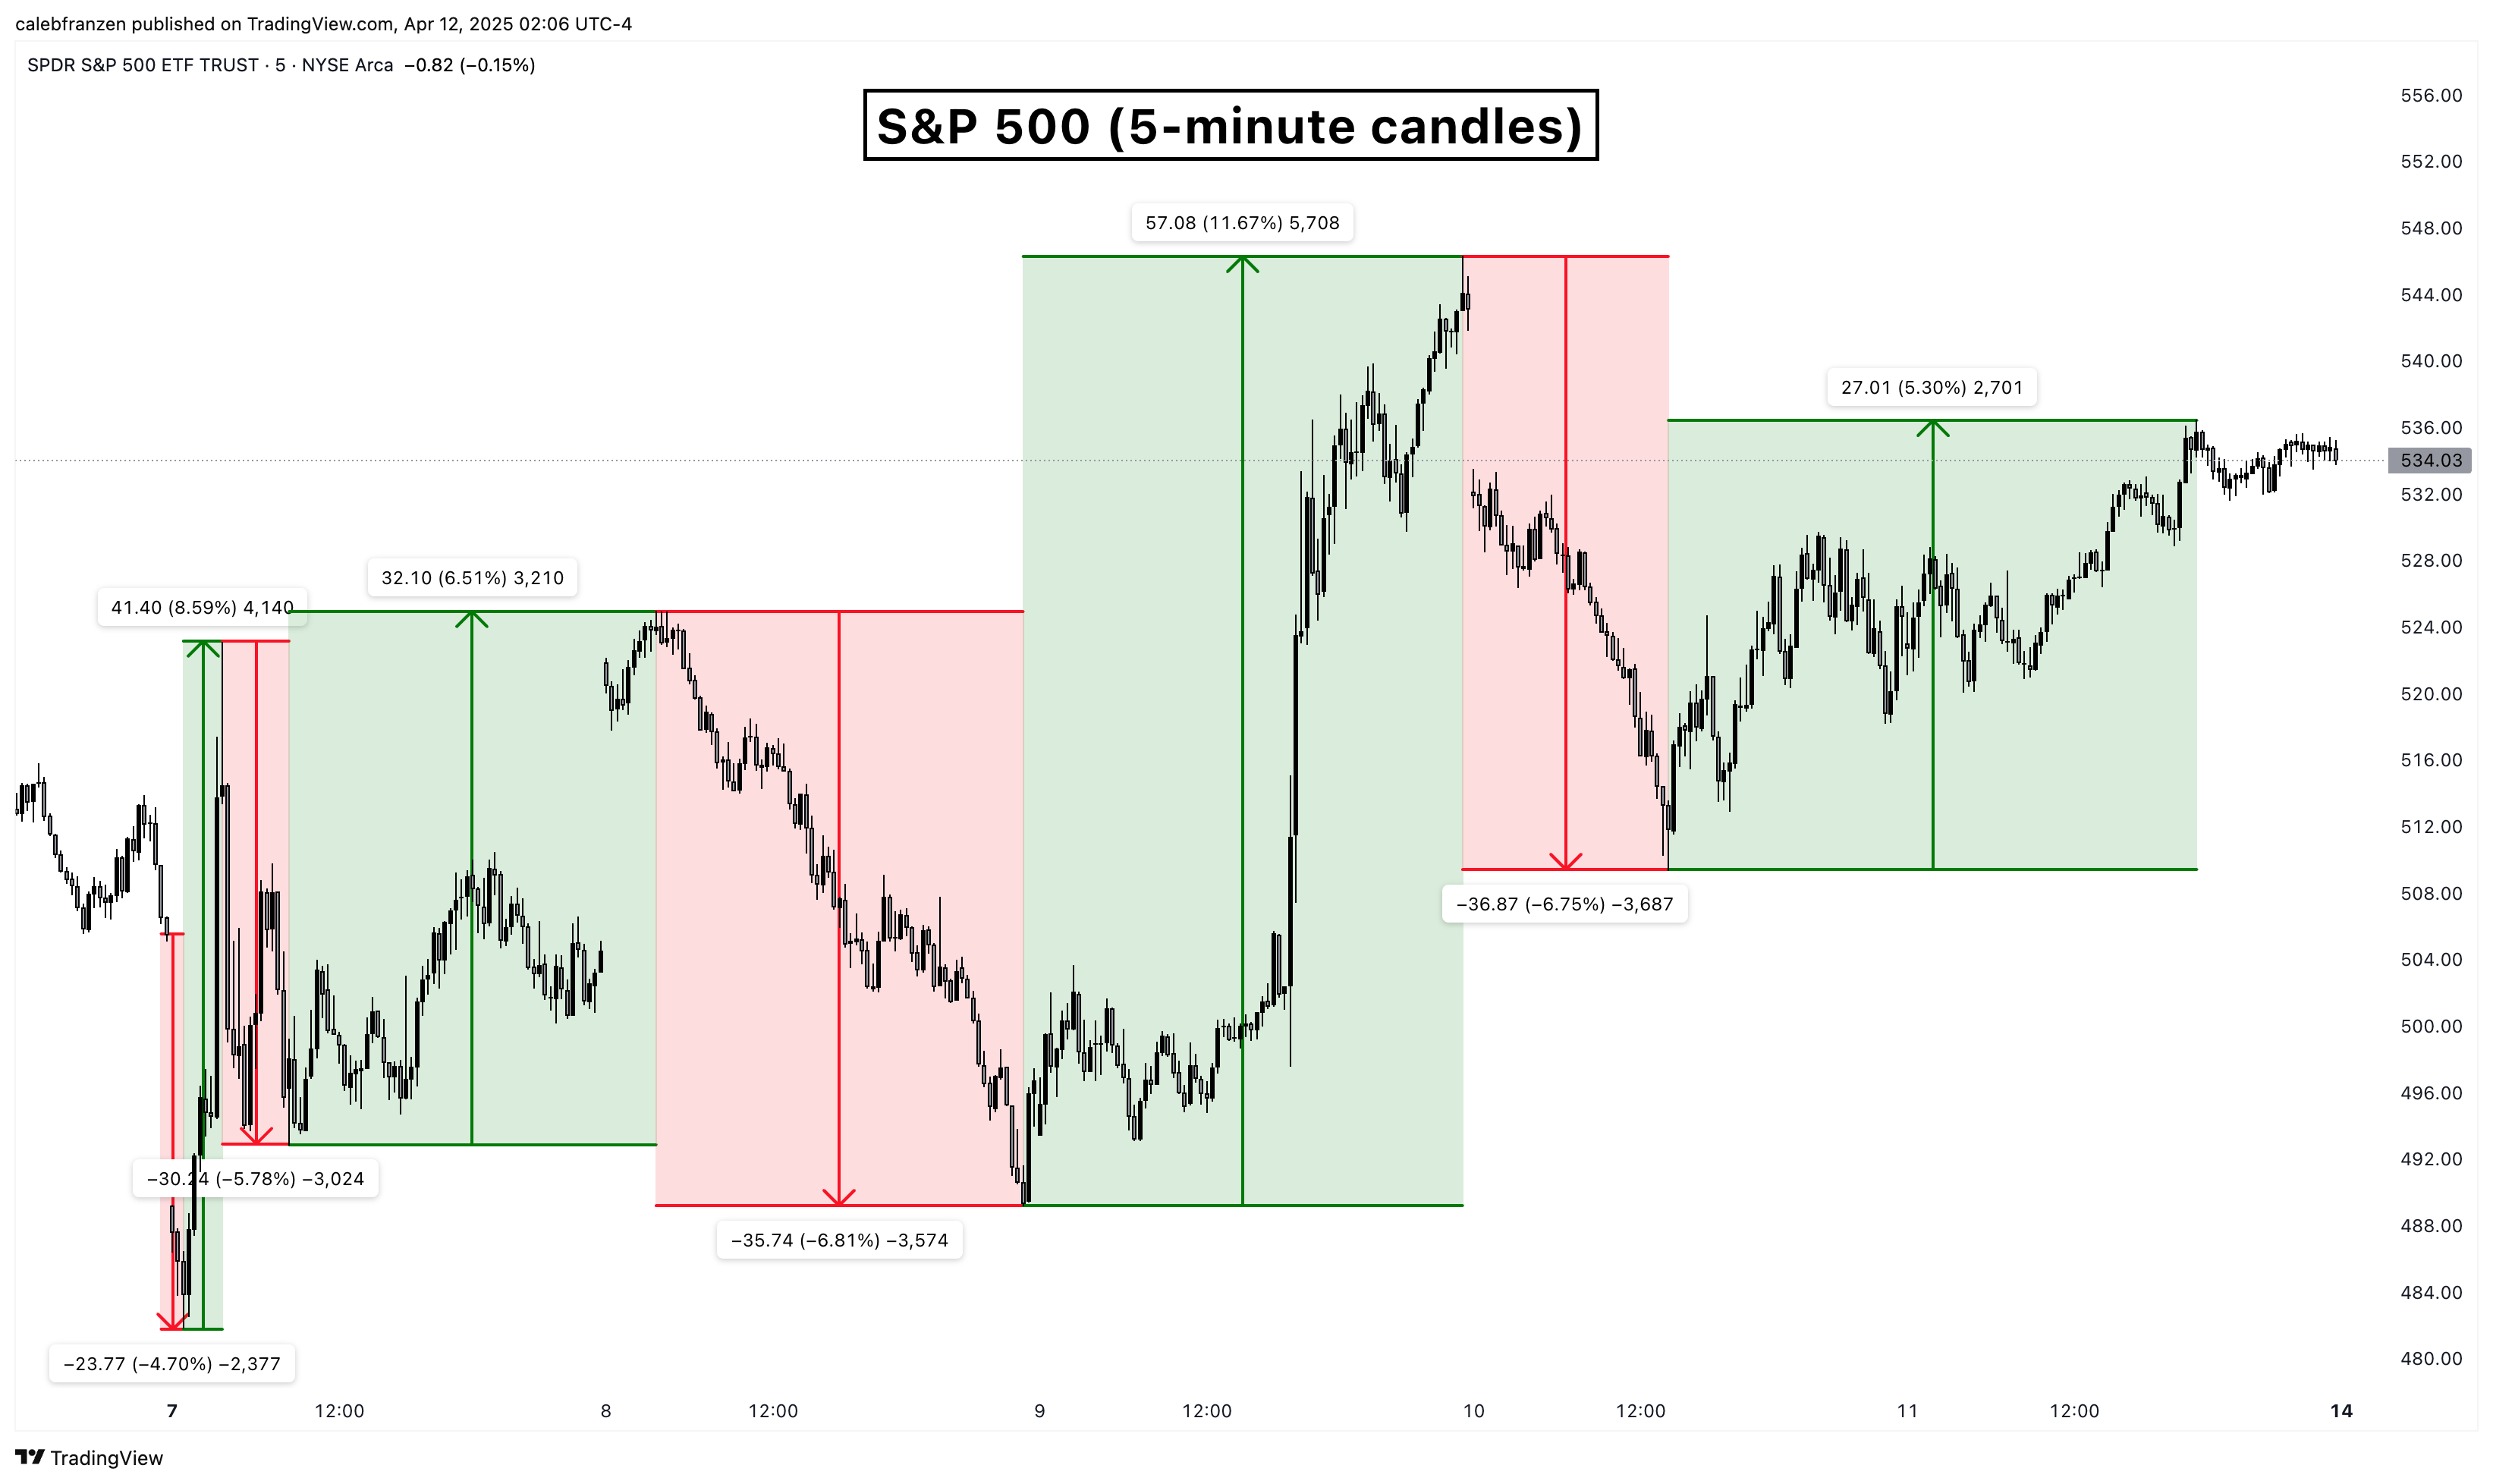
Down -4.7%, then
Up +8.6%, then
Down -5.8%, then
Up +6.5%, then
Down -6.8%, then
Up +11.7%, then
Down -6.75%, then
Up +5.3%
The final result for the S&P 500 since the prior Friday’s close was +5.6%.
This was the best week for the S&P 500 since November 2023…
But the prior week was the worst week for the S&P 500 since March 2020.
If you’re new to the game of investing, this is “normal” during market “extremes”.
In fact, it’s well-accepted that the best days and the worst days in the market are often clustered around each other, creating this type of whipsaw dynamic… so this is what we must accept as long-term investors.
We must sit through the crazy times.
We can’t sell on the worst days because then we run the risk of missing the best days.
And if we sell during one of the best days, what’s to say that the next session won’t be historically great?
We don’t know.
But we do know the cost of missing such days:
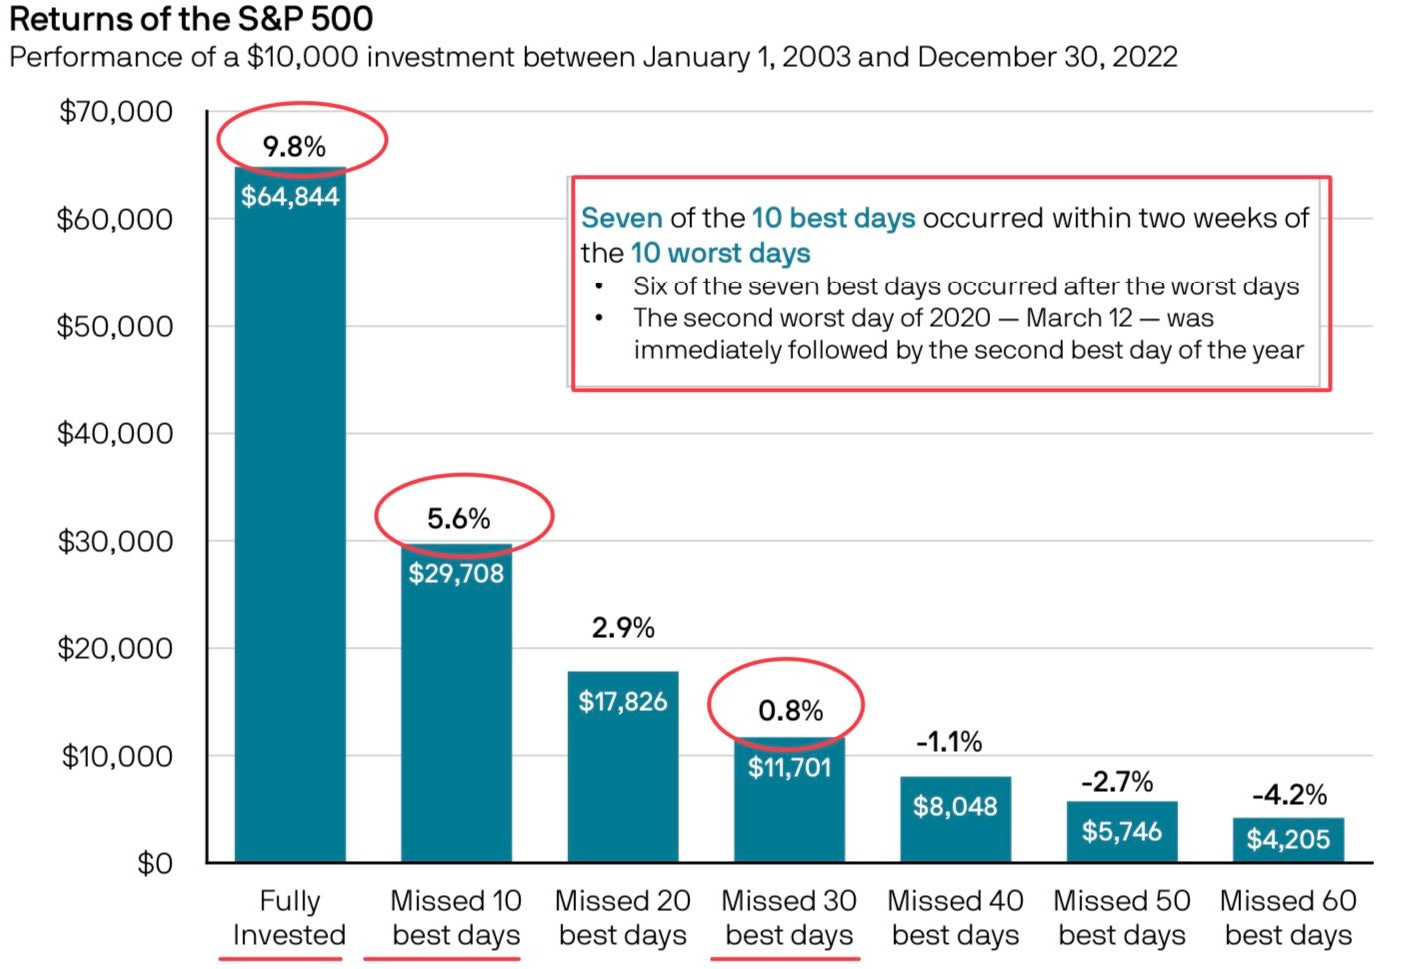
Here’s another way of looking at the effect of missing the best days from Ryan Detrick:
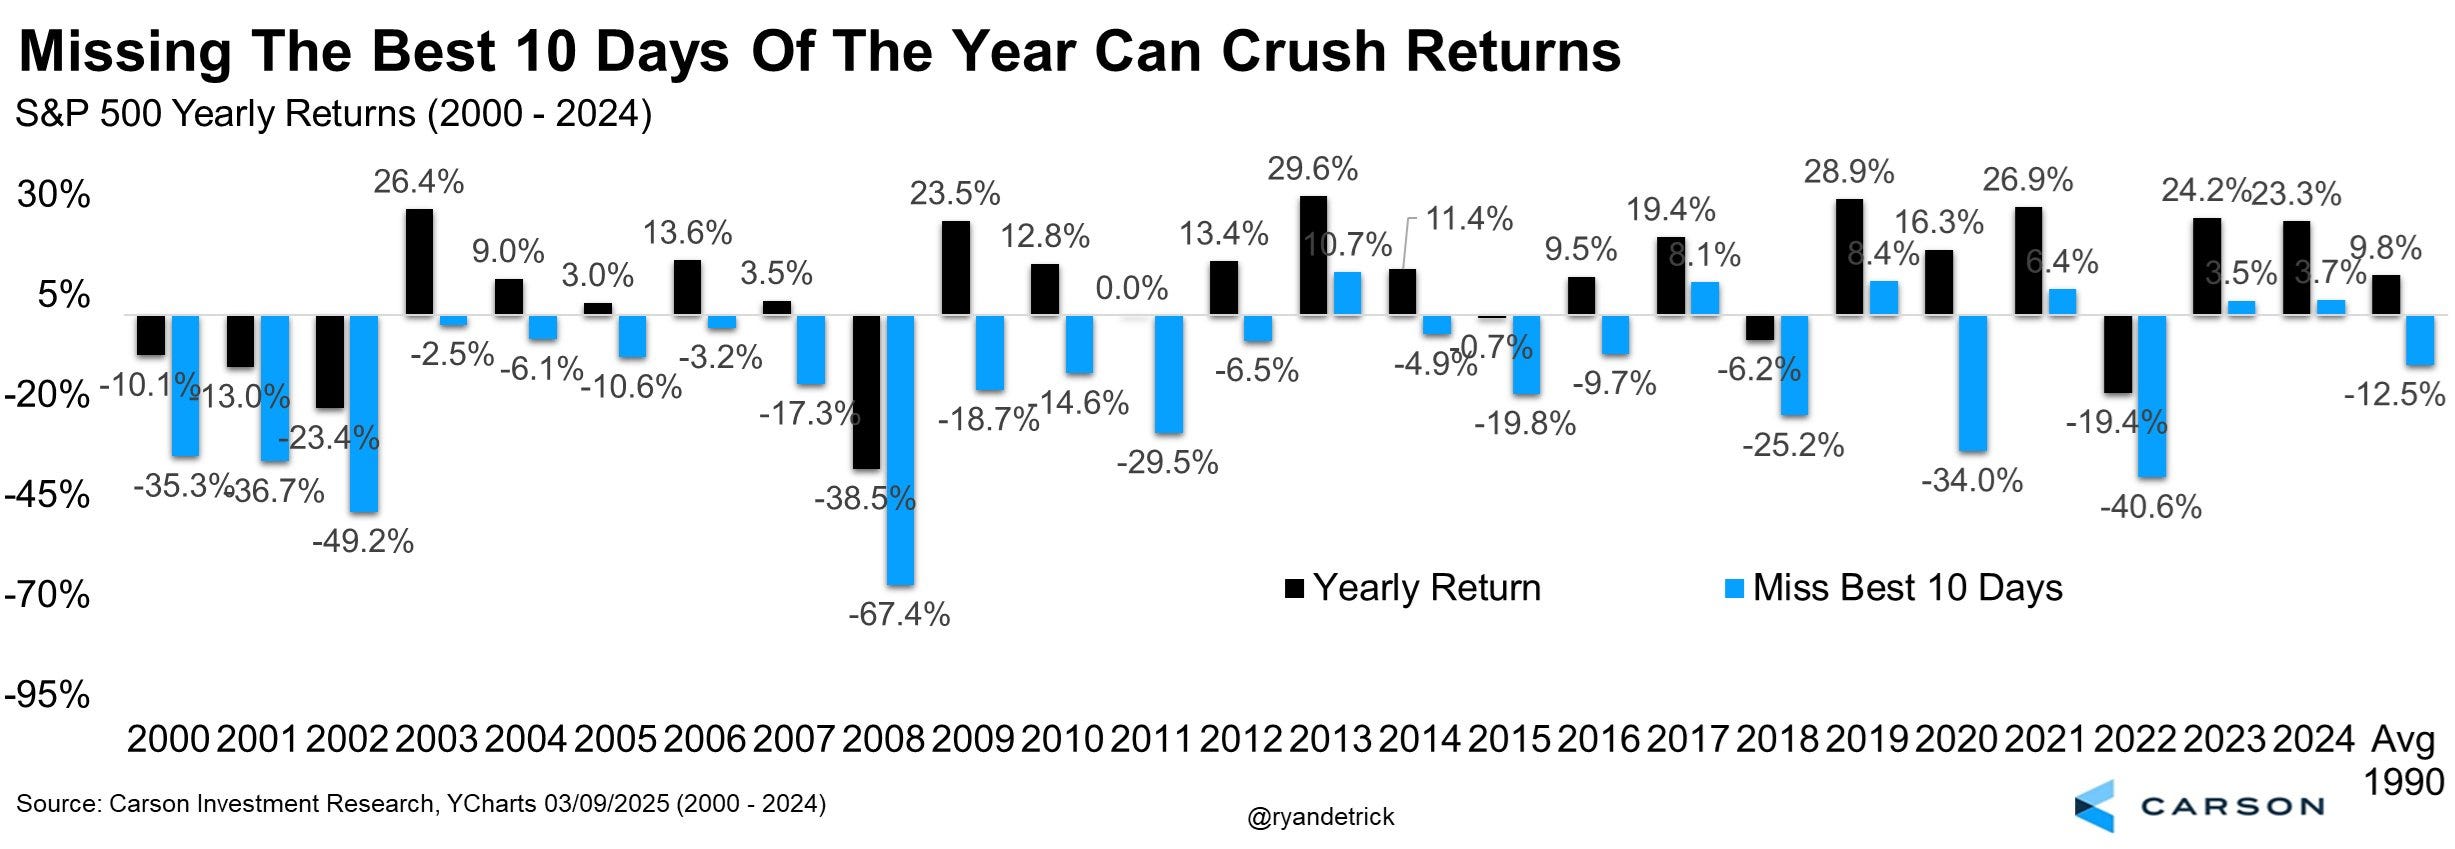
If you miss the 10 best days of any given year, nearly every year’s return flips negative!
This is why, despite being bearish for the past two weeks and defensive for more than a month, I’ve just sat comfortably on my hands and patiently waited for a “sell the rip” opportunity.
Personally, I think we’re now entering the long-awaited “sell the rip” phase of this new stock bear market. I’ve been cheering for stocks to do well so that I can marginally reduce my exposure.
The fact of the matter is that the nature of the downtrend hasn’t changed.
While early “the market has bottomed” predictions might turn out to be true, I’d rather be late and right than early and potentially wrong.
If the market is going to improve in a bullish manner, then we’re going to be able to observe that improvement from a quantitative perspective! However, that quantitative improvement hasn’t occurred yet! If/when it does occur, I’ll gladly shift back to “defensively optimistic” vs. my current “outright bearish” stance.
Look at this relationship between the S&P 500 and its key moving averages:
🔵 21-day EMA
🔴 55-day EMA
🟢 200-day EMA

Each of these moving averages have the potential to act as resistance on an upcoming retest, similar to how they acted as support during the bull market.
Look at the dynamics in Q3/Q4’23, when the S&P 500 traded below each of the EMAs.
I’d rather just wait for the breakout to get long, like what happened on November 3rd, 2023, before the index went on to gain +14.2% over the next 3 months.
Again, I’d rather be late & right than early & potentially wrong.
There’s no need to be a hero in this market, and I won’t let my ego get in the way of the objective facts of this current downtrend. If the objective facts change and we see a breakout above the three EMAs, then that would be a quantitative justification to become bullish (but cautious) once again.
If/when that breakout comes and stays intact, we can celebrate.
And here’s the thing… it’s not just the S&P 500 that has this dynamic vs. its EMAs…
The Dow Jones, the Nasdaq-100, and the Russell 2000 have the same exact setups!
Just look at how consistently the Nasdaq-100 used this triple EMA cloud as dynamic support during the entirety of the bull market in 2023-2024, then flipped into a bearish stance in March 2025 with the breakdown below the range.
Investors must acknowledge that this downward sloping EMA cloud is now acting as resistance in recent retests, getting hammered by the 200-day EMA (green) and the 21-day EMA several times already over the past few weeks.
In order to get bullish, this structure must improve.
And let’s loop Bitcoin into this also…
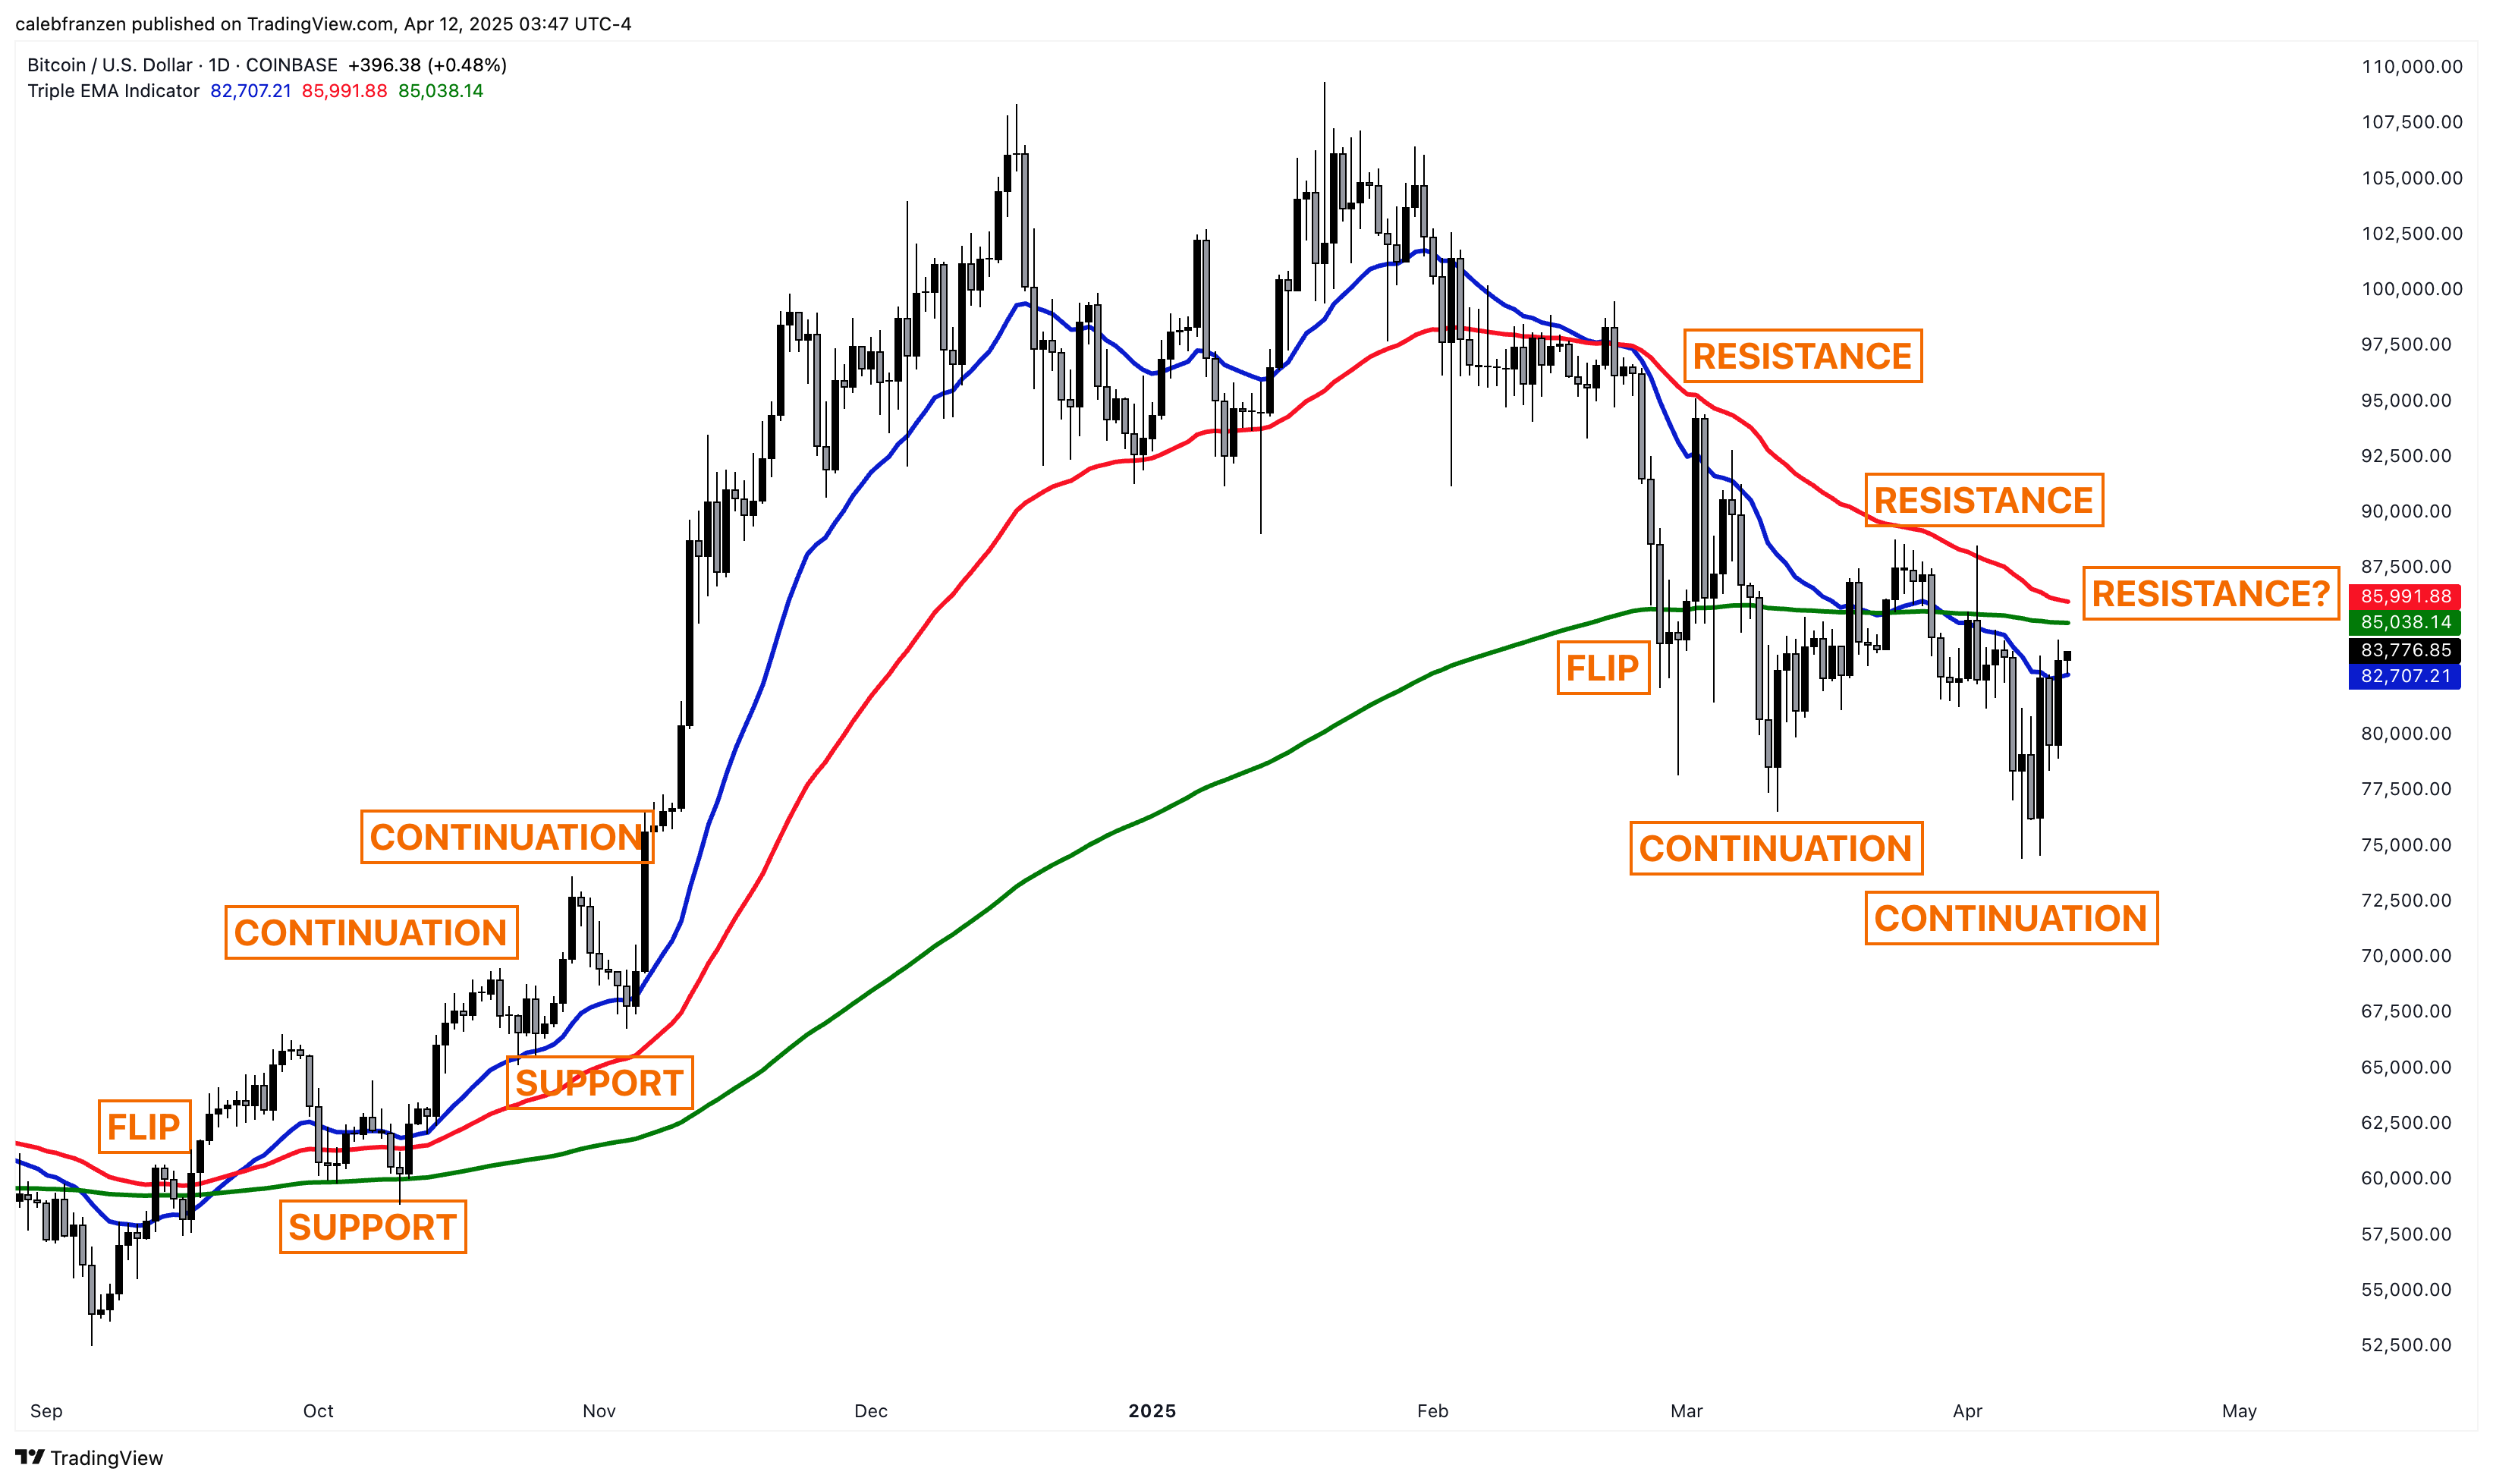
Just look at the consistency with which this indicator worked, in both a bullish and bearish manner!
Rise above the cloud and stay above it? That’s bullish.
Fall below the cloud and stay below it? That’s bearish.
As of right now, the current Bitcoin chart has the potential to once again get rejected on this dynamic range, as it already has several times since February 2025. This is a stark contrast vs. the bullish behavior that we witnessed in Q4’24.
I fully concede that the price of Bitcoin can break above the range, as it did in September 2024… however, anyone who tells you with certainty that it WILL break above this resistance range is just flat out lying.
All we know with any degree of confidence right now is that this is a bearish setup that can flip bullish if/when the dynamic improves and price breaks above it!
This is the beauty of dynamic indicators — we can actively adjust and modify our outlook based on how the relationship with price evolves over time.
While I recognize that I sound like a killjoy, I need to be a realist… and you objectively can’t disagree with anything that I’ve said or shared because I’m simply highlighting the facts.
Here’s another fact: I want to be bullish.
Making money in the market is way more fun than losing money in the market.
But I also can’t sacrifice my capital at the alter of “what I want” vs. “what’s true”.
The truth is that we’re in a bear market, until proven otherwise.
Bulls, prove it.
Best,
Caleb Franzen,
Founder of Cubic Analytics
This was a free edition of Cubic Analytics, a publication that I write independently and send out to 13,500+ investors every Saturday. Feel free to share this post!
To support my work as an independent analyst and access even more exclusive & in-depth research on the markets, consider upgrading to a premium membership with either a monthly or annual plan using the link below:
There are currently 1,050+ investors who are on a premium plan, accessing the exclusive alpha and benefits that I share with them regarding the stock market, Bitcoin, and my own personal portfolio.
DISCLAIMER:
This report expresses the views of the author as of the date it was published, and are subject to change without notice. The author believes that the information, data, and charts contained within this report are accurate, but cannot guarantee the accuracy of such information.
The investment thesis, security analysis, risk appetite, and time frames expressed above are strictly those of the author and are not intended to be interpreted as financial advice. As such, market views covered in this publication are not to be considered investment advice and should be regarded as information only. The mention, discussion, and/or analysis of individual securities is not a solicitation or recommendation to buy, sell, or hold said security.
Each investor is responsible to conduct their own due diligence and to understand the risks associated with any information that is reviewed. The information contained herein does not constitute and shouldn’t be construed as a solicitation of advisory services. Consult a registered financial advisor and/or certified financial planner before making any investment decisions.
Each investor is responsible to understand the investment risks of the market & individual securities, which is subjective and will also vary in terms of magnitude and duration.
Thanks for being intellectually honest