Edition #98
Non-Financial Debt Grinds Higher, Equity Tech Flows Nosedive, Unprecedented Investor Activity in Real Estate
Economy:
Here’s an interesting chart that I saw regarding the debt cycle. I often feel that when debt figures are discussed, it’s in the frame that it’s unsustainable & therefore spells doom for the U.S. economy. That’s not at all what I’m trying to say, but it objectively points to the fact that the U.S. economic system is heavily reliant on debt.
This chart specifically covers non-financial debt in the United States, which is simply the debt that is owed by households, government, and companies in the non-financial sectors (healthcare, technology, consumer discretionary, utilities, etc.). These obligations include commercial & industrial loans, credit card debt, and government Treasuries among others. Here are some aspects that jump out to me:
Business debt is quite anemic, particularly on a relative basis vs. household and federal debt.
Total non-financial debt has nearly doubled since the Great Recession from roughly $35Tn to $63Tn.
Since 2008, the percent of total non-financial debt attributable to businesses and households has declined, meanwhile federal debt is becoming a larger piece of the pie. Perhaps this indicates that the federal government has been more incentivized to take on debt at lower interest rates than households & businesses. In 2008, federal debt was roughly $6Tn vs. total non-financial debt of $35Tn (roughly 17%). The current level of federal debt is now $25Tn vs. total debt of $63Tn (roughly 40%). I expect the share of total debt attributable to the federal government will continue to grow & increase in size.
I think it’s likely the rate of growth will also increase on the aggregate, driven by an acceleration in federal debt. In my opinion, federal debt & borrowing trends are recursive, meaning that it’s a self-perpetuating mechanism that will induce itself to grow more & more. For right or for wrong, I wouldn’t be surprised to see total non-financial debt double within the next 10 years.
Stock Market:
Over the past few weeks, equity markets have been in a battle between bulls & bears. Bears won most of those battles, albeit by a small amount, causing equity prices to slip from the ATH’s. We’ve seen a slight rebound as the factors causing a rise in uncertainty have begun to subside. From their peak in September to the recent trough (so far), here is the decline in each of the major U.S. indexes.
Dow Jones ($DJX): -5.2%
S&P 500 ($SPX): -5.3%
Nasdaq-100 ($NDX): -5.6%
Russell 2000 ($RUT): -6.7%
In reality, a decline of approximately -5.5% over roughly 20 days isn’t drastic. On a daily basis, it equates to -0.27% per day. It practically goes without saying, but when the market faces downward pressure, technology/growth and small-cap companies tend to get hit the hardest, which is exactly what we see above. Investors tend to sell these companies more aggressively than they would a blue-chip, mature business, that pays a dividend.
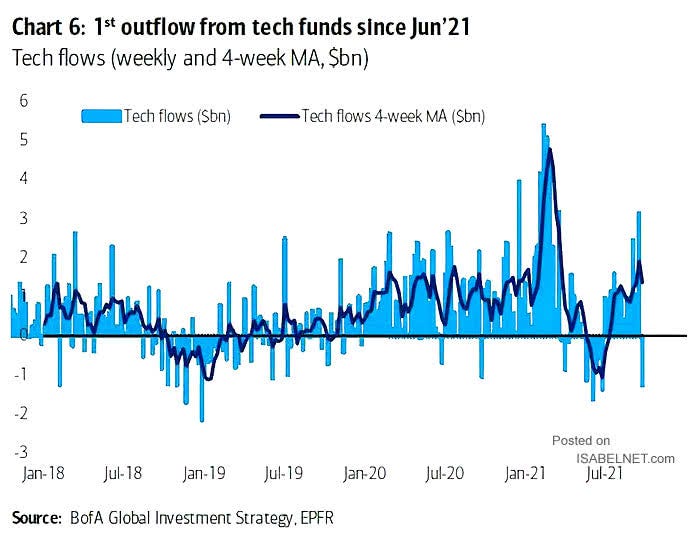
Outflows out of technology stocks were noticeable, as evidenced by this chart from Bank of America’s Global Investment Strategy team.
It will be an important indicator to see net tech flows become positive in the near future as further confirmation that the bull trend is still intact. At the very least, it’s encouraging to see the 4-week moving average remain positive, although the slope had a sharp downturn.
Cryptocurrency:
No update.
Real Estate:
In one of my earliest newsletters, I shared a quote from the CEO of Redfin, Glenn Kelman. The thoughts he shared were intended to highlight the bizarre state of the current housing market (as of May 2021), driven by a low-interest rate environment, COVID-related factors, and work-from-home (WFH) dynamics. This part stood out to me especially:
“The average housing budget for out-of-towners moving to Nashville was $720k, ~50% higher than locals’ $485k budget… 90% of people earnings $100,000+ per year expect to be able to work virtually, compared to 10% of those earnings $40,000 or less per year.
At the time, I thought this was relevant because it highlighted the new dynamics in the housing market, notably how coastal professionals were changing the competitive nature of landlocked housing markets. One thing that Kelman didn’t explicitly acknowledge is that the WFH buyers could have been using their relatively higher purchasing power to buy investment properties, as opposed to their actual residence. Additionally, a WFH buyer moving to Nashville could use the local’s budget of $485k to purchase their actual residence in the area, then use the difference vs. their actual budget of $720k in order to purchase an investment property as well. Essentially, the WFH buyer has the following options:
Purchase a residential property at their max budget of $720k. At 15% down, this would require a down payment of $108,000.
Purchase a residential property at the amount of the local budget, then purchase an investment property. The buyer could decide to put 10% down on the residential property, or $49k. That means the WFH buyer would have another $59k to put down on a new investment property to match the total cost of $108k in the first option. With investment properties requiring a 20% down payment, they could afford to buy an additional property valued at no more than $295k.
A quick search on Zillow for a 2+ bedroom, 2+ bathroom house in Nashville for less than $295k yielded over 100 results, so it’s safe to say that there is an active market in this range.
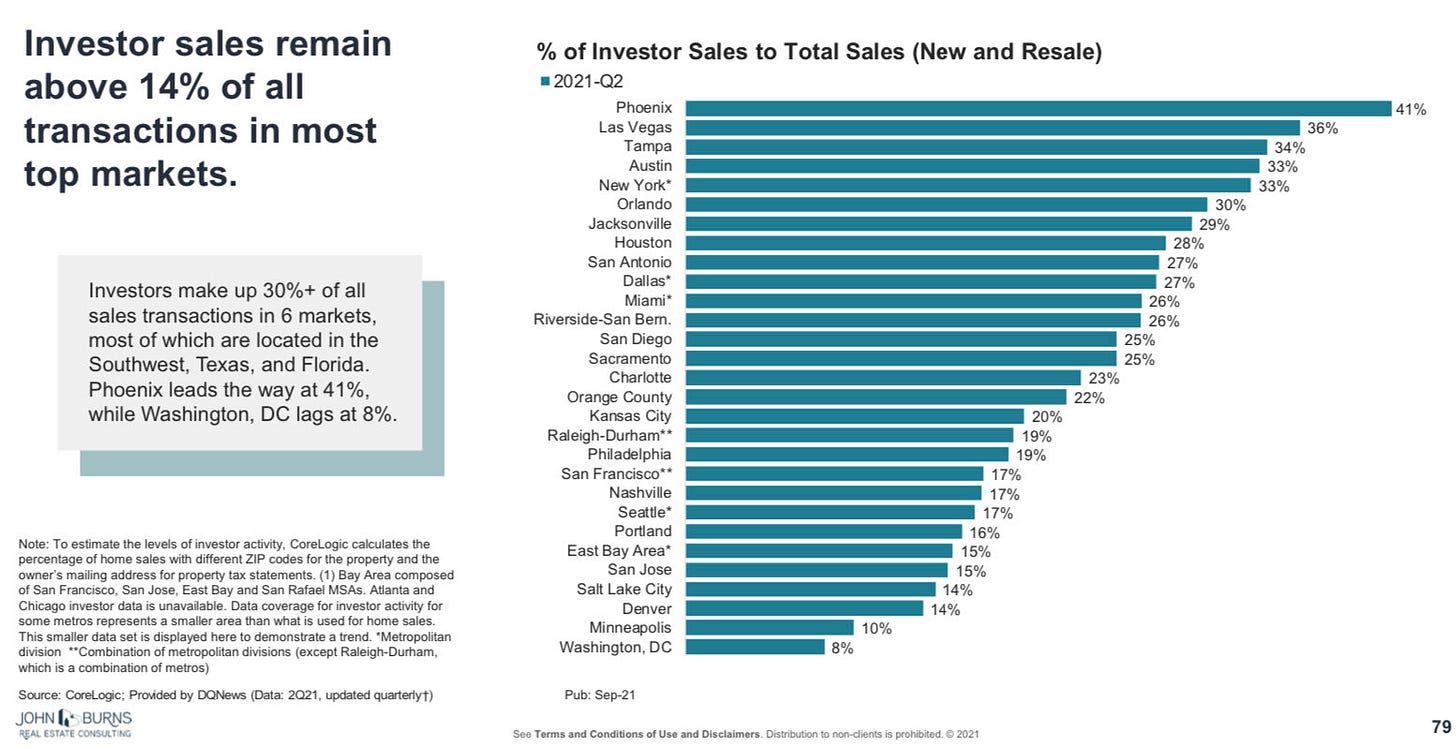
I’m not saying that this is a frequent case, but economics is a science of how scarce resources, such as money, can be allocated in a variety of ways. Clearly, this is one way to allocate capital that must be considered a viable alternative to simply buying one large house. In fact, new data from CoreLogic reaffirms that demand for investment properties is escalating as a percentage of total home purchases:
This data even shows that 17% of all transactions in the Nashville market are owned by a buyer with a mailing address outside of the market the home was purchased in. The hottest housing markets over the last year, Phoenix, San Diego, and Seattle, show that investors have a strong appetite for these markets. The graphic above indicates that the percent of homes purchased by investors in these markets are 41%, 25%, and 17%, respectively.
My expectation is that this trend will continue, meaning that the percent of homes being purchased by external investors will make up a larger portion of total transactions. These investors will likely have higher disposable income in order to push prices higher in these growing cities, particularly within a 20 mile radius of the downtown metro areas.
Talk soon,
Caleb Franzen


