Edition #93
Negative Yields (Real & Nominal), S&P 500 Euphoria Getting Started, Bitcoin Crash & Price Analysis
Economy:
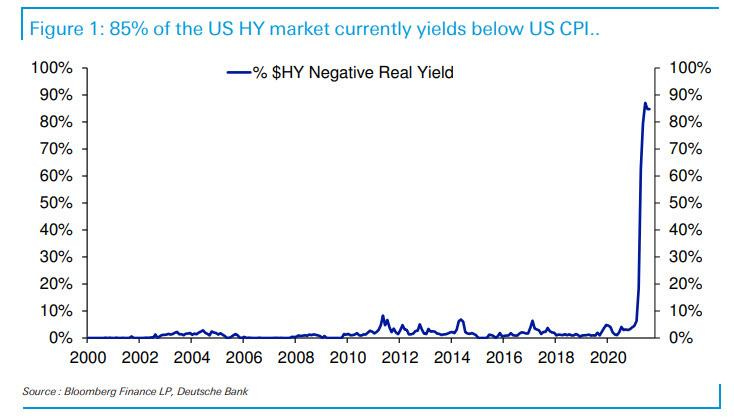
I wanted to cover two charts very quickly highlighting the prevalence of negative yields, both on the real and nominal side. The chart below shows how the significant majority of high yield debt markets are trading at a negative real yield.
With 85% of high yield corporate bonds (synonymous with junk bonds) yielding a negative real return (nominal less inflation), it’s clear we’re living in a unique moment. Prior to 2020, the percent of junk bonds with a negative real return were practically always less than 10% vs. the current peak of 85%. It’s important to note that for the first time in U.S. monetary policy history, the Federal Reserve was buying corporate bonds as part of the asset purchase program, both directly and via ETF’s offered through Blackrock (iShares). The Fed’s historic involvement in this market, which drove down nominal yields on corporate bonds, is what truly caused this spike in addition to rising inflation (which could also be accredited to the Fed & other central bank policies).
As I said in the previous sentence, global central banks are also conducting policies to the prevalence of negative yields. The chart below shows how real yields on European junk bonds have fallen below zero for the first time in history, courtesy of Holger Zschaepitz.
The reason why I’m pointing this out is to show that negative real yields are common on a global scale. This is not unique to the United States junk bond market, or any other type of bond market. This is the common regime of monetary policy, with a goal to drive real rates (and even nominal rates) negative and to incentivize borrowing. I don’t suspect this game-plan will change for a very long time.
Stock Market:
In recent discussions I’ve had with friends while visiting back in Santa Barbara, they think the markets (crypto, stocks, real estate, etc.) can’t continue to maintain this momentum. I understand their opinions, but have respectfully disagreed. Are the markets feeling exuberant? Yes. Can they get more exuberant? Yes!
To support my argument, I’ve cited different micro & macro factors. In terms of micro, company fundamentals are strong and are generating record profits, rapid revenue growth, expanding margins, and have relatively strong balance sheets. They’ve been able to refinance at historically low rates, driving down their interest expenses. On a macro scale, liquidity and financing are ever-present. The economy has hit a speed-bump within the recovery in the last few months, but this shouldn’t be shocking. Recoveries are volatile — business sentiment is still scarred by the recent downturn & the struggles that came along with that and consumers are simultaneously remaining defensive. But they’re growing and improving.
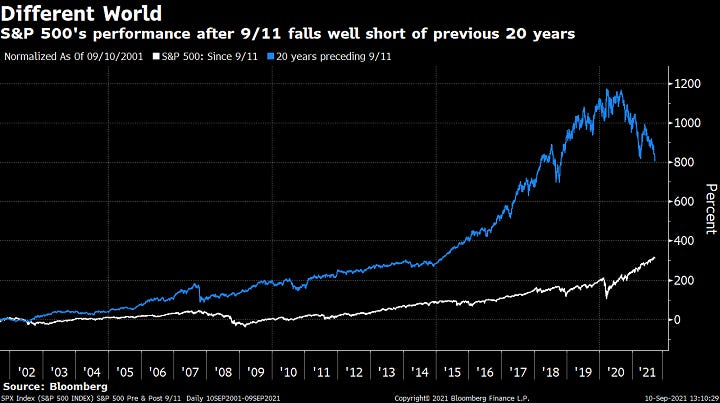
The chart below was provided courtesy of Dave Wilson (@TheOneDave on Twitter), showing the performance of the S&P 500 in the 20-year period prior to 9/11/2001 and the performance in the 20-year period following 9/11.
At almost every time-stamp, the period of 1981-2001 was drastically outperforming 2001-2021. On this scale, we can see just how enormous and sustained the .com bubble was and forces us to reconsider that the current cycle isn’t nearly as exuberant as it has been during other bull markets. Based on the magnitude of monetary policy and the likelihood that interest rates will remain low over the short to intermediate future, stocks and other assets are likely still primed to compound more gains.
Cryptocurrency:
Other than the formal start of Bitcoin becoming legal tender in El Salvador, the other big news was the action price action of Bitcoin. On the day that BTC became legal tender, the price simultaneously fell dramatically. At 11:00 pm ET on September 6th, the price was $52,920, but the price hit a low of $42,619 around 11:00 am ET the following morning. In the simplest way, the price fell by -18.5% in about 12 hours.
Price almost immediately rebounded, but has been moving sideways & consolidating in a range since the morning of El Salvador’s adoption. I have a couple theories why this occurred, but it’s not easy to know if I’m right/wrong:
The government of El Salvador rewarded their citizens with $30 of BTC directly to their wallets. Per data from the World Bank, the GDP per capita in 2020 was $3,798. That means people are only making $10.40/day if salary was spread evenly for 365 days. The economy is quite impoverished, lagging countries such as Lebanon, Jamaica, Iraq, Mongolia, and Indonesia. Therefore, receiving $30 on Tuesday gave them a 4x increase in their total daily salary (only for that day, clearly). It’s very possible that recipients of the $30 of BTC was immediately converted into USD by the citizens who don’t trust/understand/want to own BTC. The increase in sellers coming onto the market that weren’t normally there could have created a mini-supply shock so to speak, driving price lower rapidly.
In the world of investing, the following phrase is often used to describe news-based events: “buy the rumor, sell the fact”. Essentially, traders are piling into a stock when there are rumors or news of a potential acquisition. This increased demand in anticipation of the acquisition drives the price higher. Once the acquisition is announced & finalized, traders have been known to sell the stock. Essentially, the rumor that caused them to enter the trade was completed, therefore their thesis for the investment was complete! In the case of Bitcoin, the news of El Salvador making it legal tender in the country was announced in June 2021. The market was trading based on the anticipation of it becoming passed legislatively, then the official day of rollout & onboarding. This final step, the rollout & onboarding, was the end of the trade for everyone who bought BTC in anticipation of the adoption. As such, they sold & drove price lower with the increased market supply.
In reality, it’s rarely the case that a stock or asset will have such a substantial change of value from one factor — markets are multivariate and are often irrational, if not most of the time. The decline is attributable to a variety of factors, but I think these two were the most impactful.
I identified a curious characteristic of this recent crash that I haven’t seen anyone else discuss on Twitter or amongst the circles that I pay attention to. I noticed that the price action of this recent correction is eerily similar to the price correction from mid-April 2021 when price fell from $64.8k to $28.8k. In the photo below, I’ve stitched the chart from April 2021, using the daily candles vs. the decline we saw earlier this week on one hour candles.
We experience a deep correction from the highs, creating a cascading effect to the downside. Price reaches some arbitrary level where it finds support, then proceeds to consolidate in a sideways manner with frequent retests of an upper & lower-bound. In April, the decline from highs to lows was -55% over the course of 70 days. Currently, the downside we experienced over 12 hours was -18.5%. One could make the argument that these are relatively proportional moves.
As we know, the chart on the left ended up developing into a very positive scenario so far and gained +84% through the recent highs of $52.9k. Now, we’ve slipped quite a bit but nothing has changed to the fundamental thesis (in fact, it’s only improved). Below, we’re looking at the present view of BTC’s price chart since mid-April 2021:
I remain extremely bullish on Bitcoin and still have price targets ranging from 6-7 figures over the intermediate and long-run.
Talk soon,
Caleb Franzen


