Edition #86
Shipping Indexes Have Historical Gains, Chart Crimes, S&P 500 Performance vs. Historical Crashes
Economy:
Last week, in Edition #80, I provided an update on global shipping rates & covered my views that the Baltic Dry Index will likely rise substantially higher (even though it has already 10x’d since the pandemic lows). While the BDI is a good indicator of the dynamics in the shipping/container market, it’s not the only one or likely not even the best one. Many economists prefer to evaluate the HARPEX Shipping Index instead. This index is named after the ship broker Harper Petersen & Co. and is perhaps a better gauge of broader shipping conditions over the BDI, which tracks freight costs for dry bulk items, which are commodities such as coal, grains, industrial metals, etc.
In any event, here’s a great graph that I saw that shows both the Baltic Dry Index and the HARPEX Index simultaneously, courtesy of Topdown Charts:
I wanted to share this graph because I think it provides an extremely valuable lesson in understanding data & how we evaluate multi-variate infographics. This chart is extremely deceiving because it appears to reflect that the HARPEX Index has accelerated substantially higher & faster than the Baltic Dry Index. But is that actually the case? Since March 2020, the BDI has increased by approximately 10x, increasing from a low of 410 vs. the current reading of 4,193. Meanwhile, the HARPEX has increased from 412 to the current measure of 3,560. That’s “only” an increase of 8.6x.
Whoever put this graph together clearly didn’t understand how to make the y-axis compatible between the two data points. This is extremely surprising because the values are quite similar, but for some reason they decided to compress the BDI and stretch HARPEX. Chart crime!
In any event, we can unquestionably conclude that both have risen substantially over the past 18 months. I don’t view these data points as a leading indicator for broader economic conditions, although it certainly has implications for inflationary factors. If shipping & transportation costs remain high, creating a feedback loop of supply bottlenecks & material shortages, the Fed will be paying attention to how that could cause inflation to linger longer than they anticipated.
Stock Market:
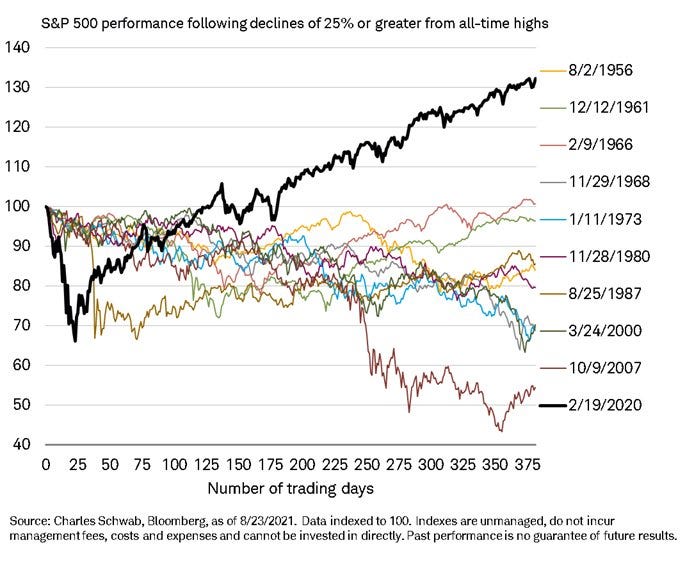
I don’t have much to update, considering that the S&P 500 and the Nasdaq both closed at new all-time highs yesterday. All four major indexes were positive during the session, but on relatively thin volume so a lot of traders were highlighting the lack of conviction during the day. This chart is now out of date by a few days, but I think it’s still worth sharing. Basically, the graph shows the performance of the S&P 500 after the index experienced a -25% decline from ATH’s.
I think it’s safe to say that we’re in an extremely unique market right now. Literally nothing compares to the current market environment! By no means does that equate to thinking that this can’t continue on. Surely it can’t continue at the rate that it’s been increasing! Or can it? I highly encourage you to read the article I published a few weeks ago where I discuss how an exponential growth rate feels unsustainable in the moment, but it’s likely just getting started.
Cryptocurrency:
No update.
Until tomorrow,
Caleb Franzen


