Edition #85
Technology Stocks vs. S&P 500, Corporate Crypto Ownership, Housing Permits per Metro Region
Economy:
No update.
Stock Market:
Both the S&P 500 and the Nasdaq hit new all-time highs during yesterday’s session, and both recorded their highest ever daily closes. This now marks the 50th day this year where the S&P 500 has closed at all-time highs. All signs of a strong market environment, as I’ve been highlighting since the inception of this newsletter & in the paper that I published at the beginning of the year. Please connect with my on LinkedIn and check it out!
The YTD returns for the major four indexes are now:
Dow Jones ($DJX): +15.55%
S&P 500 ($SPX): +19.44%
Nasdaq-100 ($NDX): +19.16%
Russell 2000 ($RUT): +12.97%
The chart that I wanted to focus on was the relative value of technology vs. the broader S&P 500. As of the most recent data I could find, the market cap of information technology stocks comprises 27% of the S&P 500’s total weighting, whereas the technology fund $XLK is 87% technology. I think that’s even an understatement, because they’re classifying Visa & Mastercard as “financial services”, which is correct but they’re truthfully digital payment processors & fintech, so it’s hard to only classify them as “financial services”. In reality, every company in this fund is a tech company.
By gauging the relationship between tech vs. the S&P 500, we can identify how investor psychology is adapting in a quantitative sense. The chart below was produced by Steven Strazza (@sstrazza on Twitter):
As we can see, XLK/SPY hasn’t made much progress over the last 12 months. Actually, it peaked in September 2020 and has mostly been fluctuating to the downside! We can clearly identify a slope at the upper-bound where the relationship between XLK/SPY gets rejected & makes a substantial move lower. The ratio was recently retesting this trend line once again, but has managed to break above it for the first time. This could possibly indicate that the 12-month consolidation period is over. The final confirmation is to ensure that the ratio eclipses the prior all-time high from last September to officially signal a breakout in technology stocks versus the broader S&P 500.
Cryptocurrency:
Often times, I discuss institutional adoption on this newsletter as a way to highlight how corporations are shifting to support or help facilitate the blockchain and build new services around crypto, or how asset management companies and financial institutions are warming up to investing in Bitcoin. Only briefly have I actually discussed how corporations are buying Bitcoin to hold on their balance sheet in lieu of cash. The only times I’ve brought it up are in regards to Microstrategy, then again recently with Coinbase’s new announcement to buy $500M in crypto and 10% of annual profits going forward.
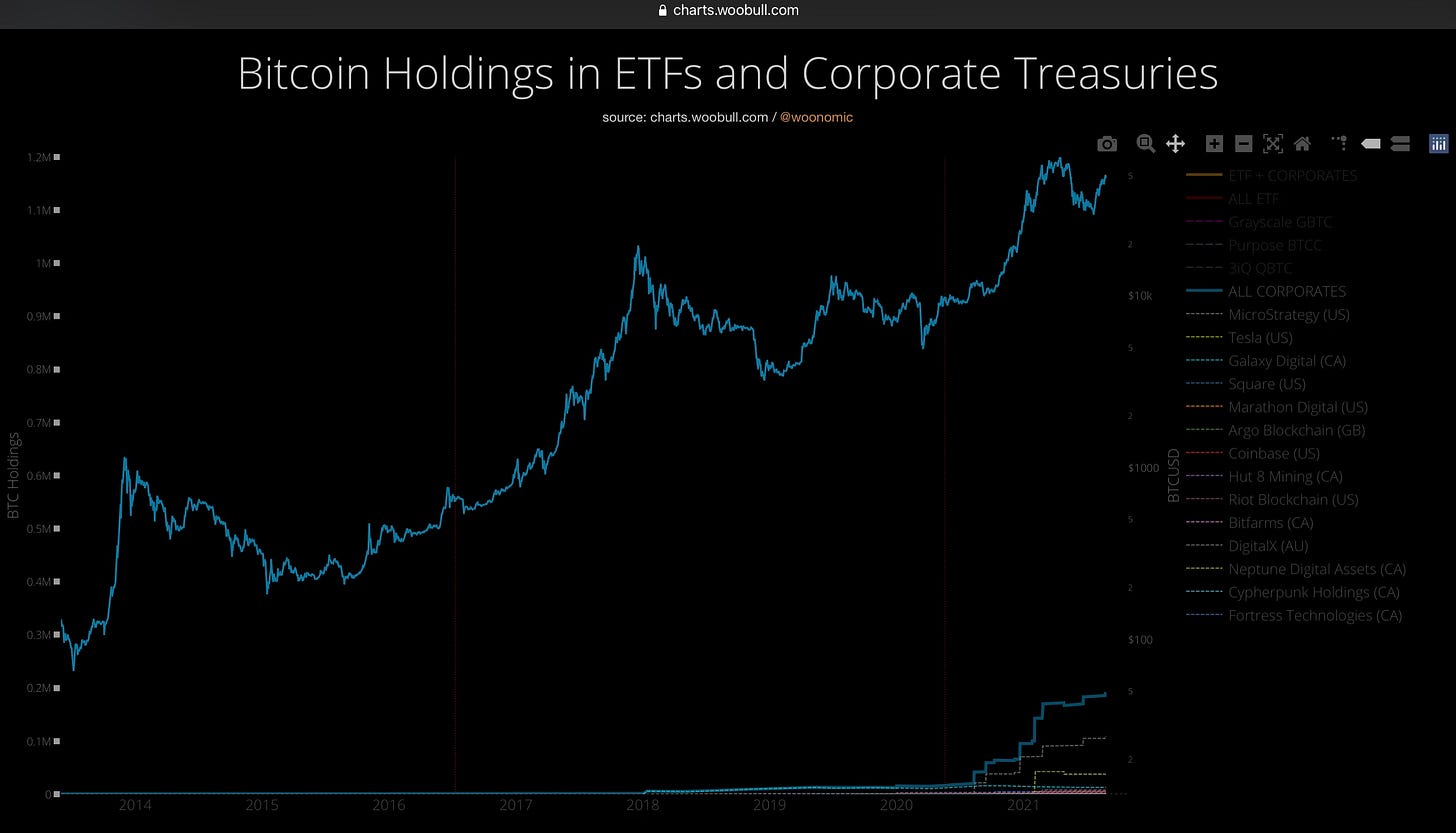
This chart from Willy Woo (@woonomic on Twitter) is a great visualization of how much Bitcoin is owned by corporate clients on behalf of their shareholders.
Of the 18,796,606 BTC currently in circulation, only 189,494 are owned by corporate institutions. As we can see from the graphics at the lower right-hand corner, corporations are an entirely new type of buyer that have just recently stepped into the market. In total, corporate ownership of BTC only accounts for less than 1.008% of total circulating Bitcoin supply.
Of these corporate owners, Microstrategy ($MSTR) owns the lion’s share of the BTC and currently owns 108,992 Bitcoin. Their stock is up +84% YTD and +393% in the last 12 months.
In my opinion, this truly shows just how early we are.
Real Estate:
In our prior discussions on the real estate market, one key component that I’ve been raising is how supply is quite limited. For example, in Edition #54 on 7/21/21, I highlighted how housing starts & building permits were rising but still very low relative to their housing bubble peaks.
Yesterday, I saw some new great data that adds to this point. The chart below shows some of the key metropolitan regions and their respective 12-month housing permits for single-family homes relative to their peak in the housing bubble in 2002-2008.
It’s quite amazing to see how Houston, Nashville, Dallas, and Austin are the only four metropolitan areas to see a higher level of housing permits issued relative to their highest level during the lead-up to the housing crisis. On a weighted average basis, national SFH permits are down -19% from the peak.
All I know is that real estate investors are likely eyeing the markets with the lowest levels of new permits relative to the housing bubble as a first-step criteria to narrow down their list of top markets to analyze further. Limited supply means increased scarcity, which means that housing prices will appreciate faster with rising demand relative to areas with lower scarcity/higher supply.
Until tomorrow,
Caleb Franzen


