Edition #75
Producer Price Index Hits Record, Bitcoin Adoption & China "Bans"
Economy:
In yesterday’s report, we extensively covered the CPI data for July 2021 which rose by +5.4% on a year-over-year basis. Considering that this was equivalent to the June 2021 data, many people were quick to claim that inflation has peaked and that the Fed’s expectation that inflation would be transitory was beginning to come true. Clearly, it’s too early to take a victory lap and I even stated my own hesitation to declare that inflation has peaked:
“The question that remains is whether or not this stabilization will become the new trend or if we will reaccelerate again in the coming months. My bias is towards the latter…”
Case & point, the producer price index (PPI) data was released yesterday. While consumer prices are exactly what they sound like, aka the prices that people like you and I pay at the store for goods/services, producer prices are the costs of raw materials & inputs that suppliers pay to produce the goods & services they sell to consumers. Typically, the most significant producer expenses are tied to commodities (steel, copper, lumber, oil, etc), transportation & logistics costs (rail, freight, oceanic), and labor. The PPI is actually a leading indicator for the CPI because producers are able to transfer rising raw material, transportation, and labor costs onto the final consumer via higher consumer prices in order to protect their margins & maintain profitability. To be clear, the entire increase in producer prices do not get fully passed through to the end consumer, only a portion. Nonetheless, the tight relationship between PPI & CPI can be seen in this chart:
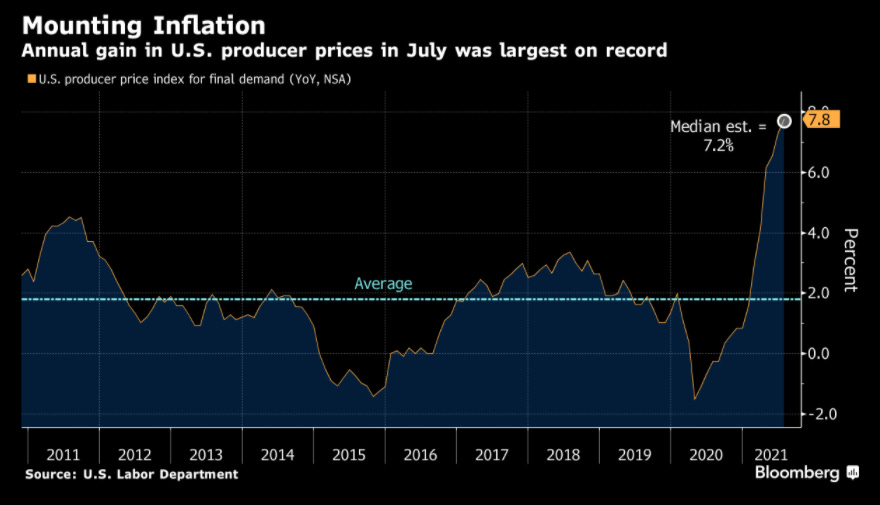
With that background out of the way, let’s dive into the PPI data for July 2021. Consensus estimates were expecting a month-over-month increase of +0.6% and the result came in at +1.0%. This was a substantial surprise to the upside. On a year-over-year basis, the PPI increased by +7.8% vs. median estimates of +7.2%. If we break the PPI separately by category of goods vs. services, final demand goods increased by +5.8% and final demand services increased by +11.7% year-over-year! Considering that our economy is more service based than manufacturing based, the spread between these two data points will be interesting to track. On the aggregate, here’s the historical tracking of the year-over-year PPI per month:
It’s important to note that this was the largest annual increase in producer prices on record. I still believe that the most likely case is for both the CPI & PPI to inch higher from these levels, but I do expect that the rate of the increases should slow soon as we move through the fourth quarter of 2021.
Stock Market:
No major update. To continue with the discussion from yesterday, where we highlighted that the S&P 500 has closed at ATH’s 46 times so far this year, the streak continued yesterday with another record close. The $SPX increased by +0.3% and closed at $4,460.83.
Cryptocurrency:
I want to post two amazing graphics as food for thought in regards to Bitcoin. To continue with yesterday’s discussion about BTC adoption & the substantial increase in users, here’s a general depiction of of the relationship between users & price:
As the members of the network grows, the value of said network tends to grow exponentially. These network effects are outlined in Metcalfe’s law, which states that “the value of a communications network is proportional to the square of the number of its users”. In the case of Bitcoin, the “network” can be determined by the users & those who are willing to transact/accept Bitcoin as payment or even the number of miners who validate the blockchain and the cumulative hashrate of the network.
At the present moment, the cumulative compute power of the BTC network is 104 exahash/second or the equivalent of 104,000,000,000,000,000,000 (104 quintillion) calculations/second. For the historical tracking of BTC’s compute power, feel free to check out this link.
The second chart that I want to show is in regard to a common concern that is constantly brought up as a rebuttal to Bitcoin, which is the threat of China banning it. My answer to that is always the following… first of all, China has “banned” Bitcoin countless amounts of times so far already. It’s still used there today & many people point out that its usage has increased, similar to how its adoption accelerated in India and Nigeria after it was banned in those countries. Second of all, China bans a lot of innovative technologies. Citizens have limited access to the internet & also have state-issued social credit scores. Additionally, here are the returns on the value of some companies since they were been banned in China:
Basically, don’t bet against innovation simply because China bans something.
Talk soon,
Caleb Franzen


