Economy:
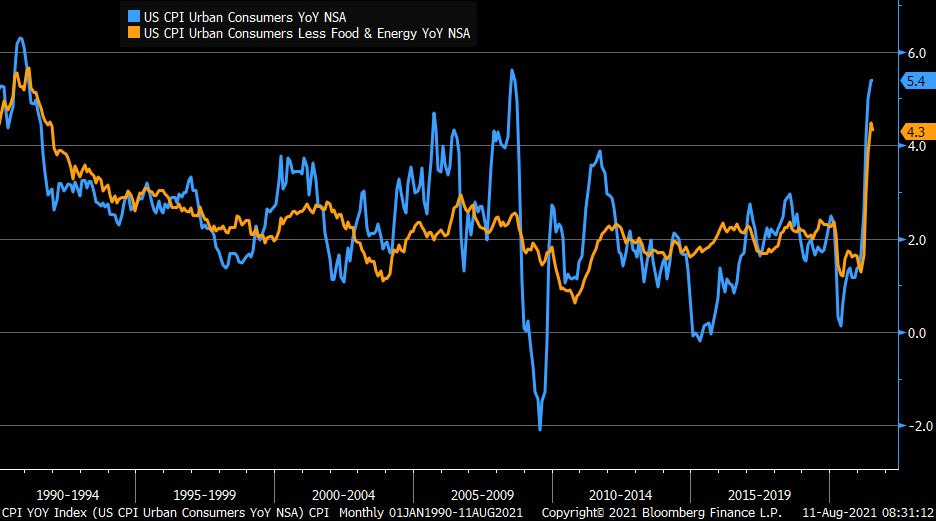
The consumer price index (CPI) for July 2021 was released yesterday morning at 8:30 am ET. Consensus estimates on a prior 12-month basis were for the CPI to increase by +5.3%, and the result came in at +5.4%. If we take a look at core CPI, which simply excludes food & energy prices, the result was +4.3% on a year-over-year basis. It’s important to note that the June 2021 CPI also increased by +5.4% on a prior 12-month basis, so it’s interesting to see that the Fed’s expectations of “transitory” inflation are possibly becoming valid.
Relative to June 2021, the July CPI increased by +0.5% after increasing by +0.9% in June 2021. Essentially, this is a clear deceleration in inflation on a month-over-month basis, and a stabilization on a year-over-year basis. The question that remains is whether or not this stabilization will become the new trend or if we will reaccelerate again in the coming months. My bias is towards the latter, as I’ve reiterated here on this newsletter when I said that I wouldn’t be surprised if we see a 12-month inflation rate between +7% and +10% at some point during this year. I’m certainly not hoping for that prediction to come true; however, I do still believe that it’s a possible scenario that we should plan for.
The full news release can be found here, but I wanted to cover some of the most important highlights from my perspective. Used cars/trucks & energy prices accounted for the most substantial year-over-year increase, rising by +41.7% and +23.8%, respectively. The only item to have decreased on a month-over-month basis was transportation services at -1.1%, although apparel was flat at 0.0%.
In regard to all items, here is the monthly data going back to July 2020:
For greater historical context, we can track the year-over-year data for both total CPI and core CPI:
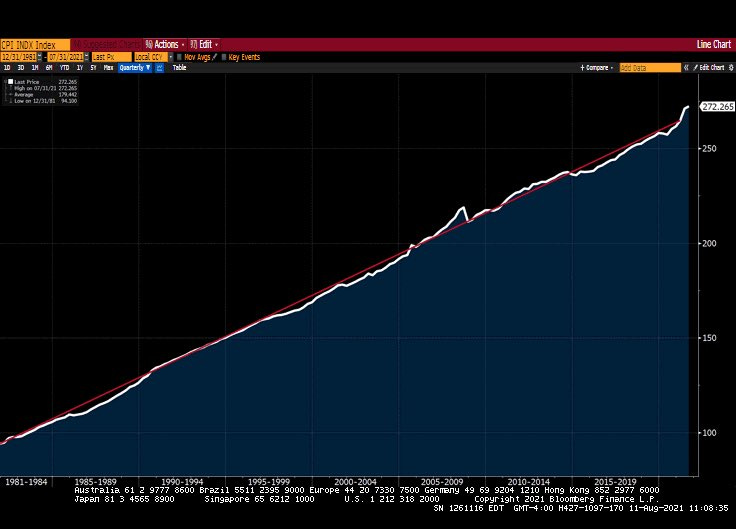
We remain at elevated levels on a historical standard, so it will be vital to see where we go from here. One thing that amazes me is just how effective the Federal Reserve has been at their mandate to achieve & foster stable prices in the economy. If we evaluate the consumer price index dating back to the 1980’s, it’s fairly astounding how gradual and consistent the CPI has been rising over this span.
Upward and onward we go!
Stock Market:
Both the Dow Jones ($DJX) and the S&P 500 ($SPX) closed at new ATH’s yesterday, while the Nasdaq-100 is hovering slightly beneath the ATH’s from last week and the Russell 2000 is within 5% of its ATH’s earlier this year. It continues to be a stellar year for the broader stock market, regardless of whether you analyze small, mid, large caps or value vs. growth. The market has been able to shrug off any and all negative news or concerns about the future during this extensive run, showing considerable strength along the way.
Mid-day during yesterday’s session, I saw some great data that highlighted some of the historical context of this bull market. In fact, going back to 1995 there have only been seven years in which the S&P 500 has closed at ATH’s on 45 or more days during the year. Here are those years, the number of record closes, and the annual return of the S&P 500 for that year:
1995: 77 record closes, achieving a calendar year return of +34.1%
1997: 45 record closes, return of +31.0%
1998: 47 record closes, return of +26.7%
2013: 45 record closes, return of +29.6%
2014: 53 record closes, return of +11.4%
2017: 62 record closes, return of +19.4%
2021: 46 record closes, return of +18.4% (as of market close 8/11/2021).
If we exclude the current year, let’s evaluate the previous six occurrences since the start of 1995. When the market achieves at least 45 days of closing at new record highs, the average return during that calendar year is +25.4%. On average, these six occurrences had 54.8 days of record-high closes. On average, the maximum drawdown in the stock market during these six calendar years was -9.9%; therefore, the average reward/risk ratio was greater than 2.5x during these instances.
As it relates to the current year, it appears there is still room to gain based on the average return and average number of record closes in this small sample size study. However, with an average reward to risk/ratio of 2.5x, it’s important to point out that the current calendar year has had substantially better risk metrics. Considering that the maximum drawdown that we’ve had so far this year is -5.7% (from February 16 - March 4, 2021), the current return of +18.4% creates a reward/risk ratio of 3.2x. Hard to say what happens next, but it’s always great to recognize the good times while you’re in them.
I continue to remain extremely positive on the U.S. stock market for the remainder of this year & well into the future.
Cryptocurrency:
There are two things that I want to cover, so my plan is to make each one brief. The first thing that I want to cover is that new institutions continue to announce that they are adopting Bitcoin & purchasing it on behalf of their investors or stockholders. In an earnings report earlier this week, insurance company Metromile Inc. ($MILE) announced that they purchased $1M in Bitcoin to hold on their balance sheet. Yesterday, the asset management firm Neuberger Berman, a firm with $402Bn in assets under management will start offering clients exposure to Bitcoin & Ethereum via their commodity trading team. Per a filing with the SEC dated August 11, 2021, Neuberger Berman’s commodity strategy fund ($NRBIX) currently has $161M in assets & has been around for nearly a decade.
This is another small step along the path of institutional adoption, but every week we continue to see new announcements from multi-billion dollar asset management firms, insurance companies, publicly traded companies, and pension funds.
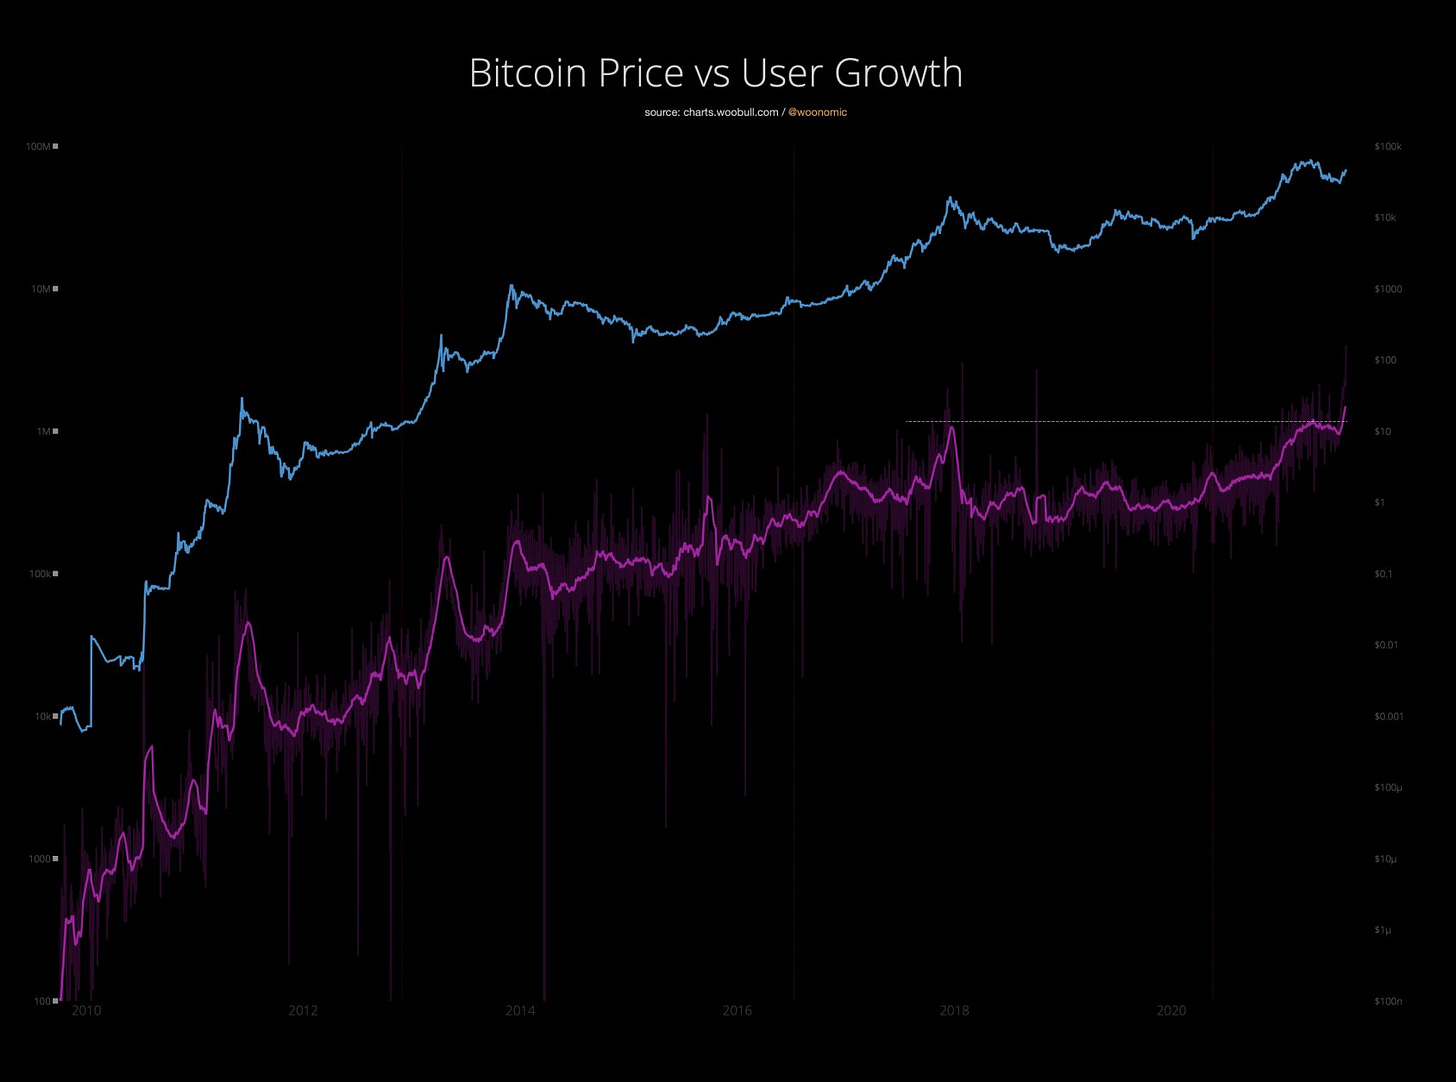
Speaking of adoption, the final thing that I wanted to share was an interesting chart that I saw on this topic. Below is a chart of Bitcoin’s price in logarithmic scale (blue) and monthly user growth (pink).
Both trending beautifully, with more than 1.2M users being added to the existing network in the last 30 days. The data, provided by Willy Woo (@woonomic on Twitter), “does not include off-chain users on exchanges, which typically see up to 3x this number”. This was the highest number of new users added over a 30-day span in Bitcoin’s 12-13 year history.
Until tomorrow,
Caleb Franzen


