Edition #73
Small Business Optimism Dips, Real Yields vs. S&P500 P/E, Coinbase Reports Q2 2021 Earnings
Economy:
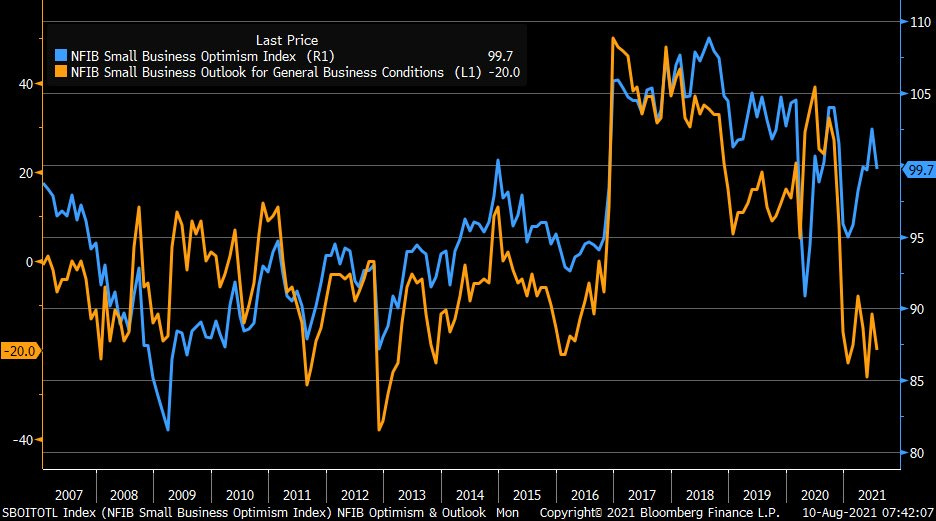
As we continue to push forward into the recovery, expectations & confidence from businesses and consumers alike will be an important metric to follow. The following data shows small business optimism (right-hand side) and small business’s outlook on economic conditions (left-hand side) for the month of July.
Interestingly enough, the small business optimism index (RHS) and the percent of small businesses who expect better economic conditions (LHS) declined relative to the prior month. After reading the full report from the National Federation of Independent Business (NFIB) who surveys & collects the data, here are some of the primary takeaways:
49% of small business owners indicated that they had job openings that could not be filled. This was the highest percentage from respondents in 48 years. In my opinion, this continues to prove the case that there is serious slack in the labor market. 93% of the small businesses looking to hire reported that there were few or no “qualified” applicants for the positions they were trying to fill. Ouch.
55% of respondents reported to have capital expenditures in the past 6 months. The NFIB reports that this percentage is well-below the historical average. Capital expenditures include costs for the purchase of assets, land, or a new production facility, among other things. It’s synonymous with business investment. As I’ve pointed out on this newsletter, business investment & capital outlays appear to remain relatively muted. Jerome Powell had reiterated in his FOMC press conference speech that business investment is increasing at a solid pace, a narrative that I disagreed with based on commercial bank lending activity. This 55% reading reiterates my stance.
52% of respondents reported an increase in their average selling prices, highlighting the fact that businesses are able to pass higher raw material prices, labor costs, and inflationary pressures onto their consumers. Continuing with this theme, 44% of respondents indicated that they plan to hike prices further.
38% of respondents raised employee compensation. In June, the reading was 39% (record high). 27% of respondents expect to raise compensation in the next three months (a 48-year record high).
Overall, this is pretty discouraging data & highlights a lot of the concerns that I’ve been focused on in this newsletter. While I reiterate that I expect these conditions will improve, they are indisputable problems that are present today.
Stock Market:
One of the more noticeable themes throughout this newsletter has been the impact of low interest rates on asset prices. While I’ve showed several empirical proofs of the inverse relationship between interest rates & asset prices, I saw a really interesting graph that helps to show this important dynamic.
In the chart below, we have the inverted 10-year real yield (red) vs. the forward-looking price to earnings ratio of the S&P 500. The price to earnings ratio is a very quick way to evaluate how much investors are willing to pay (in terms of the stock price) for a single dollar of net income produced by the company. A high price to earnings ratio implies that investors are paying a premium for the stock relative to the earnings of the company. The reason why investors might be willing to pay a premium is if they expect the future earnings of the company to grow significantly going forward. By inverting the 10-year real yield, we can evaluate more closely how the changes in yields create an equal impact on the earnings multiple of the S&P 500.
As we can see, the inverted 10-year real yield moves in lockstep with the S&P 500’s P/E ratio. Even if the two lines aren’t hovering right on top of each other, their trajectory is identical & it’s extremely rare to find an instance of divergence. Once again, this is why I believe it’s so important to evaluate the monetary policy environment and to track nominal interest rates and inflation. Monetary policy controls the base interest rate (interest on excess reserves and the federal funds rate) that influences all other interest rates in the economy, while nominal yields and inflation are used to calculate real yields. Above all else, these are the primary driver of asset returns and the performance of the stock market, in my opinion.
Cryptocurrency:
The most important crypto-related news from yesterday was the release of Coinbase’s Q2 2021 earnings report. Considering that they’re one of the largest cryptocurrency exchanges, and the go-to exchange for institutional buyers/sellers, it’s an excellent gauge for adoption and volume activity. They’re also a hell of a business, so as a potential investor in the company, the earnings report is an opportunity to pull out the measuring stick & evaluate their operating performance. Here are my key takeaways from the earnings report.
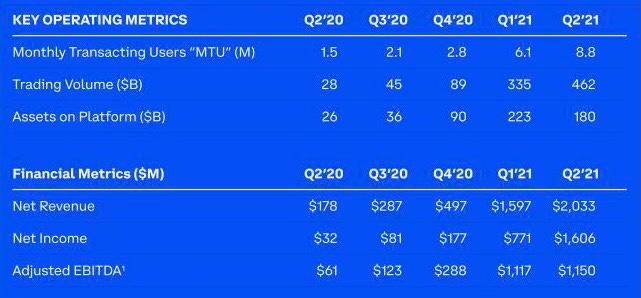
Retail monthly transacting users (MTU’s) grew by +44% relative to Q1 2021, reaching 8.8M users. Total accounts with Coinbase reached 68M at the end of the quarter. Coinbase also reached 9,000 institutional clients, such as mutual funds, pension funds, insurance companies, corporations, hedge funds, etc. This is phenomenal in my opinion. Charles Schwab, one of the largest brokerages in the United States (market cap of $140Bn) had 32.3M accounts at the end of Q2 2021 and grew by +5.5% relative to Q1 2021. Back to Coinbase, net revenues were $2.033Bn for Q2 2021 vs. $178M in Q2 2020 and $1.597Bn in Q1 2021. This represents a +1,042% year-over-year growth rate and a +27.3% quarter-over-quarter growth rate. On $2.033Bn in revenues, the company was able to generate $1.606Bn in net income for a net profit margin of 79%. That’s an astounding level of cost efficiency to produce such strong net income. The thing that I want to call attention to the most is the level of growth the company has experienced over the last several quarters:
It really doesn’t get much better than this in terms of fundamental growth metrics. In terms of trading volume, total transaction volume was $462Bn worth of cryptocurrency buying/selling activity. This was up from $28Bn in Q2 2020 and $335Bn in Q1 2021. The interesting thing to note was that Bitcoin comprised 24% of the total trading volume on the platform, while Ethereum hit 26%. This was the first time in Coinbase’s history that Ethereum volume exceeded Bitcoin’s. I think this is an important development & reflects the fact that Ethereum’s adoption is also growing at astounding rates. Part of the fact that Ethereum eclipsed Bitcoin’s transaction volume is simply because the dollar-value of ETH grew much faster than BTC’s. For example, ETH is up +325% YTD vs. BTC +56%.
There’s obviously much more to dive into & I still need to fully digest the earnings report, but these are the things that immediately stood out to me. After seeing such impressive levels of growth, as well as with my strong bias that crypto is here to stay & change the game, I am now seriously considering taking a position in $COIN stock going forward & will heavily consider buying on dips & breakouts in the stock price.
Until tomorrow,
Caleb


