Edition #72
Job Openings Hit Record Highs, Spread Between Housing Prices & Rents Rises
Economy:
As a perfect follow-up to yesterday’s deep-dive into labor market data, the report for the Job Openings and Labor Turnover Survey (JOLTS) was released for the month of June 2021. In the last monthly report for the month of May, which we covered in Edition #19, JOLTS had hit record high levels of 9.29M vs. expectations of 8.2M. In that newsletter, I wrote the following:
“From a fundamental perspective, going through periods of growth in job openings can be considered a sign of a strong & healthy economy. As an economy expands due to an increase in capital expenditures & investment, new jobs will become available & it can take time for the employer to find qualified, skilled labor. After some time however, those positions should be filled, economic investment goes through cycles & slows down, and job openings should decline as an economy levels off or contracts…
This will be an important dynamic to keep an eye on, but I expect continued slack in the labor market until Q4 2020 at the earliest.”
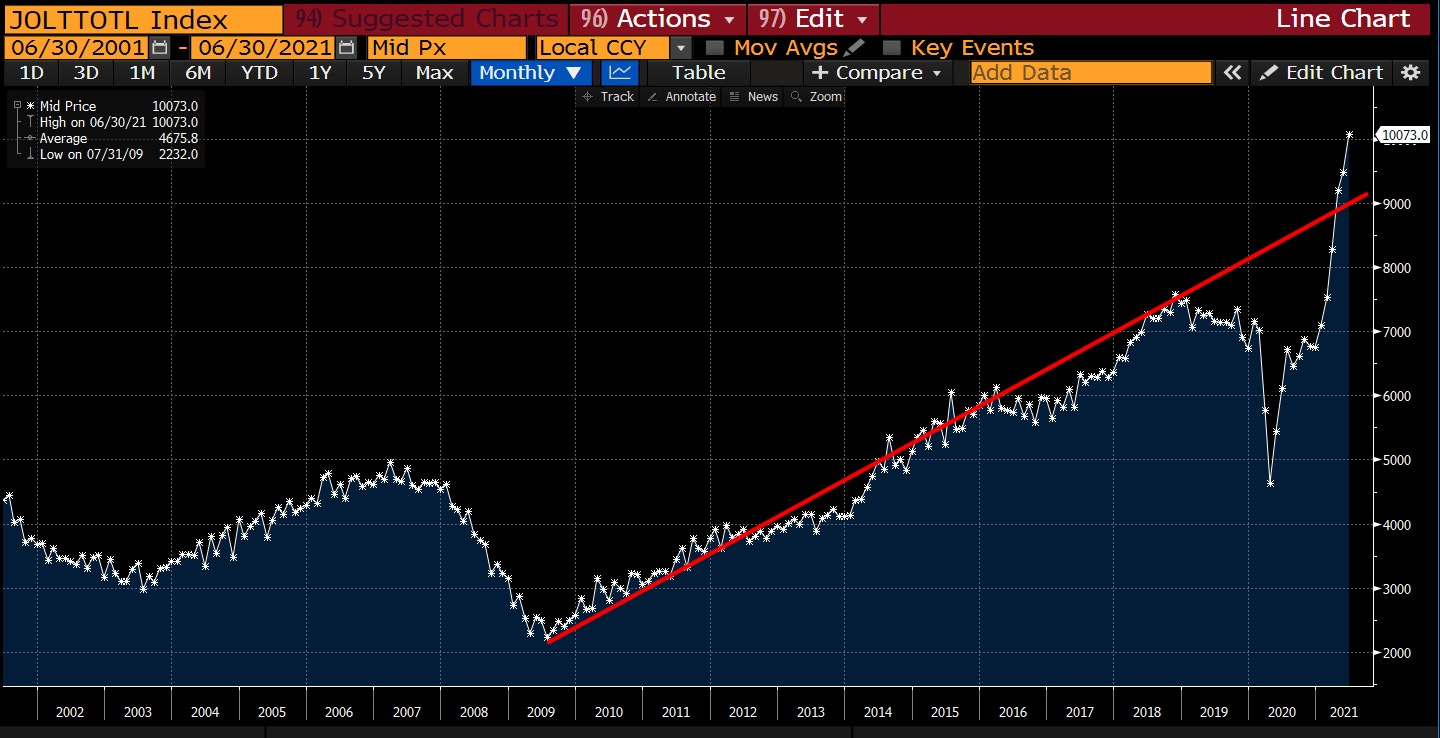
For the most recent report, consensus estimates were for approximately 9.27M and the result was 10.07M job openings, beating the prior month’s record high. As if that wasn’t already enough, the prior month figure was upwardly revised from 9.29M to 9.48M. All this does is confirm substantial levels of slack in the labor market. While the July unemployment data that we covered yesterday was very encouraging, it’s pretty amazing that there are 10.07M job openings that haven’t been filled. As I said in the quote above, high job openings at the beginning of a recovery are an encouraging sign, but we must see follow through & have those positions get filled.
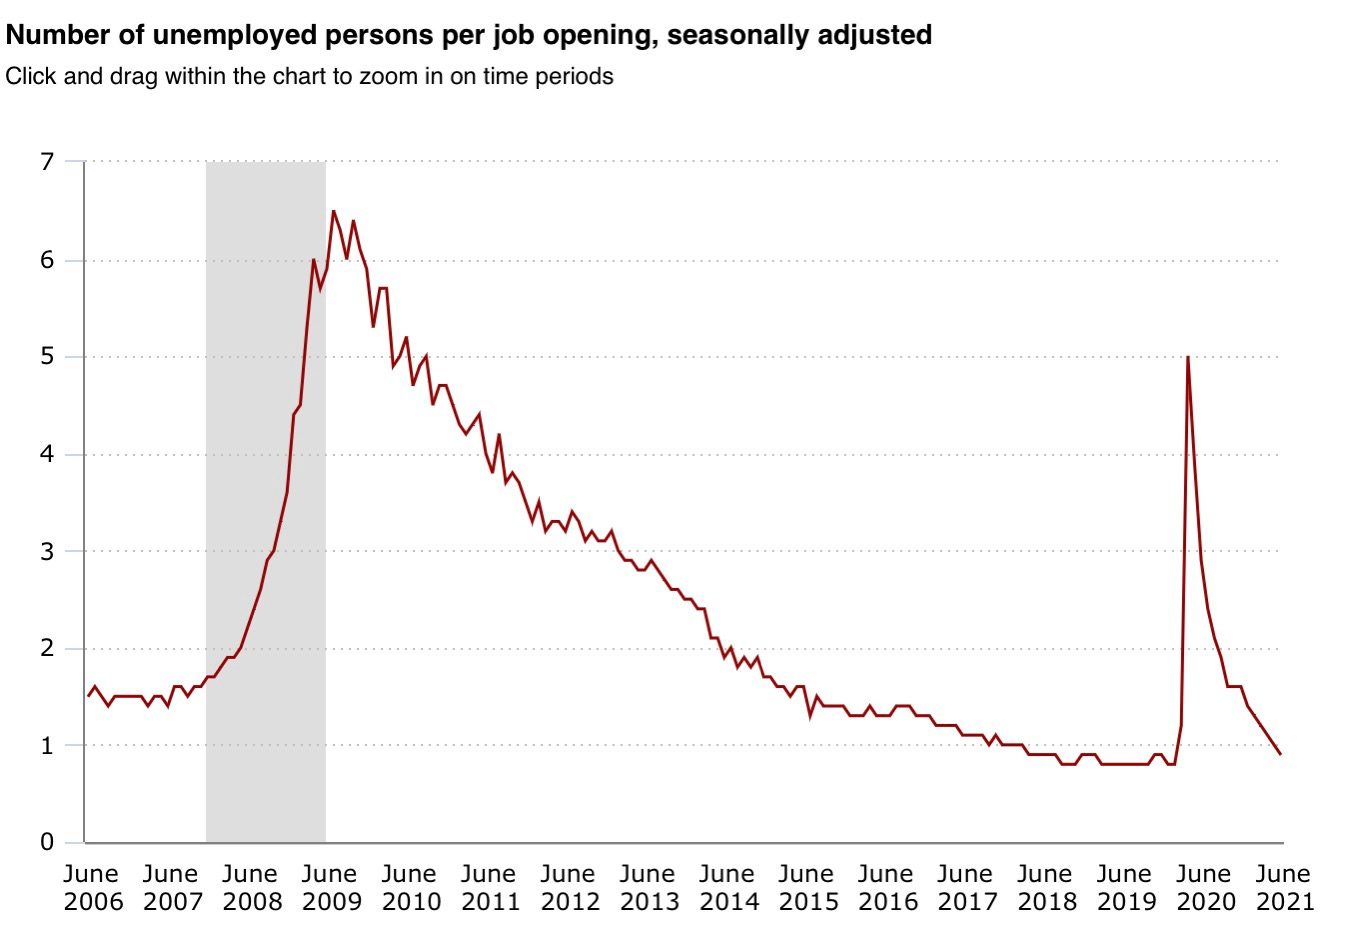
We remain substantially higher than the pre-pandemic trend, outpacing the trajectory by more than 1M openings in June. It’s also interesting to frame this data in a new perspective by comparing the number of unemployed individuals per job opening, which is reflected in the data below. With the figures accurate as of June 2021, the ratio dipped below 1.0 for the first time since February 2020.
It seems expected for this ratio to be trending down over time, particularly after a recession; however, it seems a bit odd to have a surplus of openings relative to unemployed people. We might logically expect & strive for a labor market in which the sum of unemployed individuals plus employed individuals looking for new opportunities to be less than 1. After all, those individuals looking for new opportunities would ideally like to have options to choose from. This would reflect strong labor dynamics. However, when unemployed/job openings is less than 1.0, that implies a significant amount of slack.
Stock Market:
No update.
Cryptocurrency:
No update.
Real Estate:
To keep with the theme of hitting record highs, I saw an updated version of a chart that I shared over 1 month ago, showing the comparison between the year-over-year growth rate in housing prices vs. growth rate in rents.
In the prior version of this chart, shared in Edition #39, housing prices had grown by +17% vs. rents of +2%. As we can see, this current spread of 16.9% has continued to expand from the prior spread of 15%. Considering that housing prices are based on fundamental supply & demand dynamics, and are also a function of rents & interests rates its pretty amazing to see this spread at historical levels. If rents are rising, but at a substantially lower pace than housing prices, we can clearly conclude that the housing market dynamics are being primarily driven by supply vs. demand dynamics & interest rates (monetary policy).
I wouldn’t be surprised to see this spread continue to expand, but likely not for much longer. My best guess is that we’ll follow a similar trend to the behavior in 2014 & 2015.
Until tomorrow,
Caleb Franzen


