Edition #66
U.S. Total Personal Savings Hints to Recovery, BTC Price Update & Wyckoff Accumulation
Economy:
In the wake of the pandemic, I saw a consistent headlines that personal savings had reached record-high levels. This seemed like a logical conclusion, as economic uncertainty prompted households to stockpile cash in order to prepare for a potential rainy day, and national shutdowns literally prevented consumers from spending money at the movie theater, restaurants, hotels, and on travel, etc.
Going back to 1981, we can see just how significant the spike in personal savings was in a historical context:
Logically, it makes sense for total personal savings to rise over time from a combination of higher income & wealth, as well as a growth in population. This is a trend that we can easily identify in the chart, with a steady incline over time despite the short-term swings. However, if we evaluate the pre-pandemic trend, we can compare total personal savings in Q4 2019 vs. Q4 2014 to identify the 5-year growth rate. During this time, personal savings increased from $988.7Bn to $1,208.4Bn, an increase of +22.2% or approximately +4.1%/year. This will be important to keep in mind as we evaluate the pandemic trend.
Based on the fundamental factors that I outlined in the paragraph above, we can see how household behavior shifted during the pandemic to prioritize increasing their personal savings, reaching an all-time high of $4.77Tn in Q2 2020. As economic uncertainty began to wain, we’ve seen total personal savings begin to decline, albeit by a rather substantial amount. The delta between Q1 2021 & Q2 2021 was a decline of $2.105Tn! Essentially, total personal savings decreased by more than the total personal savings amount in Q4 2019! Even though this decline is rather extreme, the current level of total personal savings of $1.968Tn is considerably higher than the pre-pandemic levels.
If we take the pre-pandemic level (Q4 2019) of $988Bn as our starting point, and assume a +4.1% growth rate per year, it would take 18 years for total personal savings to be higher than the current level of $1.968Tn. At the end of the 18th year, personal savings would have grown to $2.036Tn, assuming a +4.1% annual growth rate. We’ve reached those levels in 1.5 years.
So what exactly does this data mean, and how should we interpret the recent decline in total personal savings? First of all, there’s still an unprecedented amount of cash on the sidelines, reflecting an overall defensive stance by U.S. consumers. Second of all, the substantial decline we saw between Q1 & Q2 2021 is reflective of a consumer that is becoming more optimistic & confident about the short-term & intermediate future.
The fact is, having that much cash sitting idle is not optimal for an economic system. If we want the economy to experience a fundamentally strong recovery, that excess capital needs to be allocated to projects with adequate rates of return, reflecting an increased demand for capital expenditures, infrastructure, new construction. These projects will create new jobs, foster future consumption, and create higher productive capacity. If the cash sits idle on the sidelines, those projects will never get funded and thus never materialize. Investment creates economic growth.
Additionally, an economic system should have independent actors who have a demand for consumption. Over time, ideally, we’d like to see consumer demand grow as a reflection of an overall growth in economic activity. In and of itself, increased spending is not what creates economic growth. It is simply how we measure economic growth under the modern economic framework. Nonetheless, with so much cash on the sidelines, we’d like to see money be siphoned away from savings and into consumption. Because of these two factors, I’m increasingly optimistic that the recovery is moving in the right direction from a fundamental standpoint, although there are certainly areas of slack.
Stock Market:
No update.
Cryptocurrency:
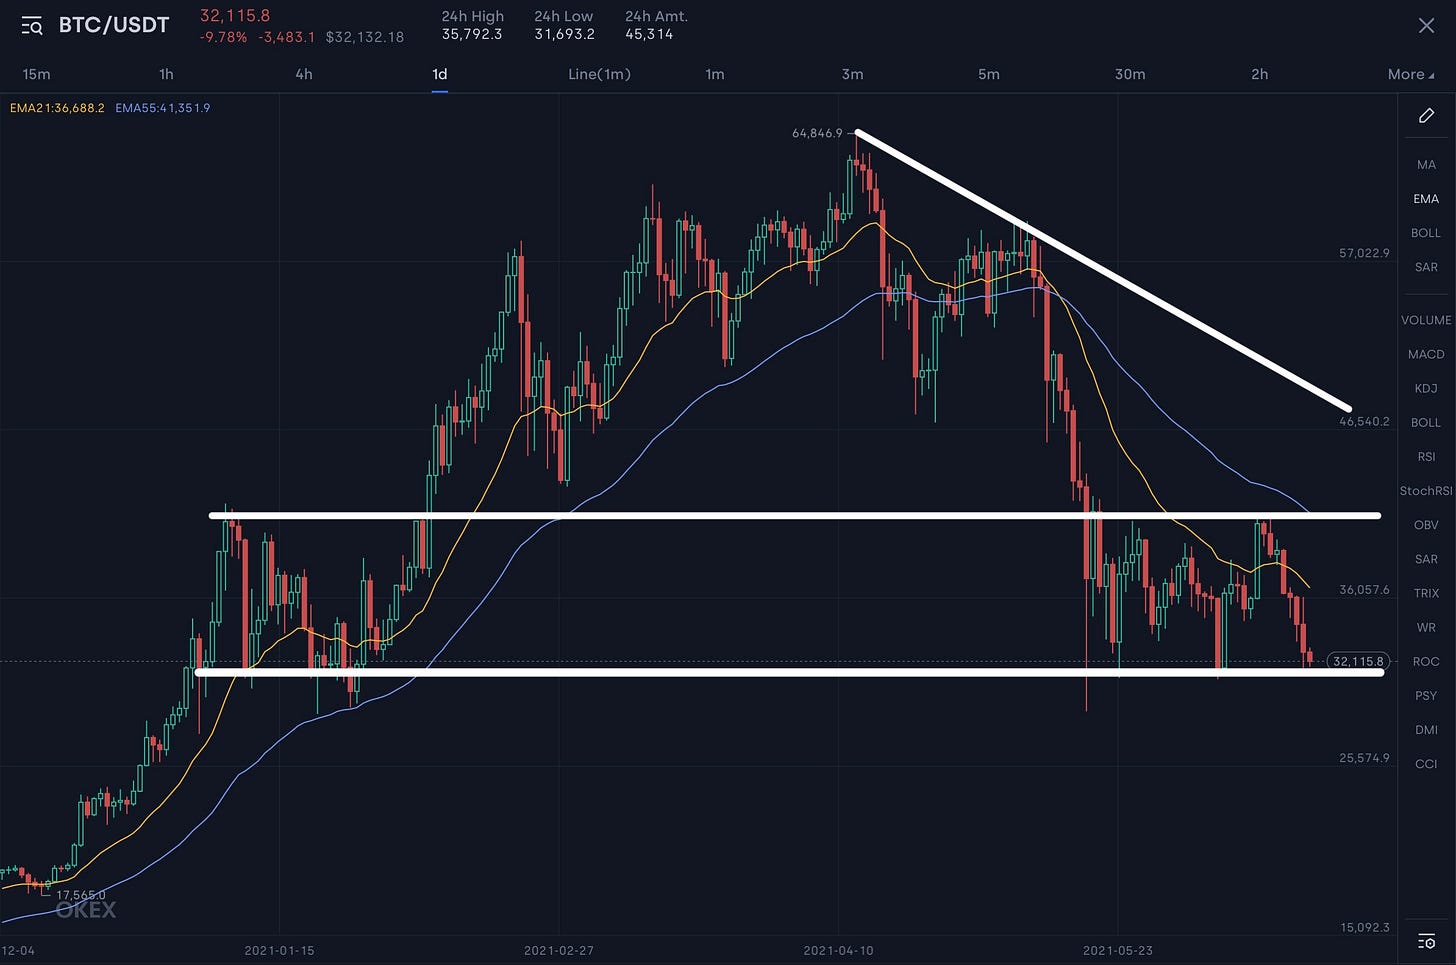
On June 22, in Edition #30, I shared my views on Bitcoin’s price action at the time. In that newsletter, I wrote the following in reference to this chart:
“I bought more BTC yesterday evening at 8pm ET at a price of $31.4k, as it appears we are currently in a Wyckoff accumulation phase.”
Immediately following, I provided a link to an informative article that explained Wyckoff accumulation & distribution cycles, which are general guidelines for price movements during consolidation periods. From that article, here is the general structure of a Wyckoff accumulation period:
Now consider the following chart of Bitcoin, starting from the highs on April 13, 2021 to the present moment. As a reminder, I have drawn the white lines over the standard price chart in order to illustrate the similarity to the Wyckoff accumulation structure. It’s also worthwhile to note that the white support & resistance levels on the chart below are essentially equivalent to the white support & resistance levels I had drawn on the BTC chart above from 6/22.
Based on this analysis alone, we can forecast that BTC will begin to consolidate & coil around the current levels, fluctuating between $38-41k. Once the market gets re-accustomed to price at these levels, I believe we’ll be ready for the next leg higher. Of course, I have an extremely bullish bias, but I am 100% open to the idea that my analysis here is incorrect & we may move back towards the lower-bound support zone in the $28-30k range. As always, I’ll remain flexible & adjust to market data as it comes.
Until tomorrow,
Caleb Franzen


