Economy:
Yesterday, 10-year real yields (the nominal yield on 10-year U.S. Treasuries less inflation) hit fresh all-time lows. While this seemed unfathomable when yields were rapidly accelerating in February & March, I continued to feel confident that yields would return to their downward trajectory. This downward trajectory is what made me confident & enthusiastic that asset prices would continue to rise, despite the turmoil.
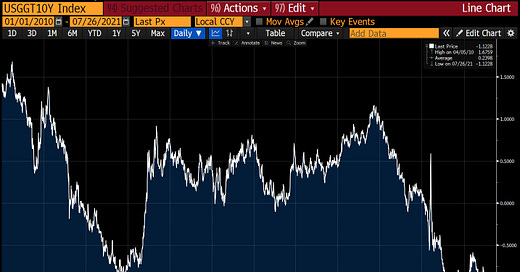
Since 2010, here is the real yield of 10-year U.S. Treasuries:
The yield reached -1.12% intraday on Monday’s trading session, implying that an investor buying a 10-year Treasury today is willing to accept a negative return on their investment. While nominal yields have certainly slipped since their peak YTD peak at the end of March, the major factor that has caused real yields to decline has been from rising inflation. Considering that we’ve covered rising inflation at length here on this newsletter, I won’t readdress those details, but I wanted to share the following chart of an index tracking the nominal 10-year Treasury yield. The chart begins at the peak in 2019, including some analysis that I’ve drawn to highlight the structure of the moves:
After breaking below the rising red trend line & falling beneath the white channel, my expectation is for yields to fall along the dotted yellow trajectory. This would imply a decline of at least -25%, likely to play out over the coming 2-3 months. From a fundamental perspective, this is extremely aligned with the timeline of potential Fed announcements regarding tapering asset purchases, which will likely cause yields to rise in the short term. Considering my perspective that yields are likely to fall rather than rise, I reiterate my positive outlook on U.S. equities & dollar-denominated assets in general.
Stock Market:
In yesterday’s newsletter, I included some data on FANGMAN stocks to show how significantly their aggregate market capitalization has increased since the pandemic lows. I then showed how these stocks have outperformed the broader S&P 500 by 32% since the pandemic lows, implying that investors should have some degree of exposure to these companies in their portfolio if they want to outperform the market.
One thing that I didn’t necessarily mention is that all of the FANGMAN companies are included in the S&P 500! Therefore you could imagine how much more FANGMAN would outperform an index of the S&P 493, where the FANGMAN stocks are excluded from the original S&P 500. Just as important as their aggregate market cap, investors should want to know how much of the S&P 500 is comprised of these 7 mega-cap tech giants.
As we can see, they comprise more than 25% of the total S&P 500, meaning that the other 493 companies account for less than 75% of the remaining weighting. At the end of the day, this really just shows us how important the FANGMAN stocks are to the broader market. Additionally, if FANGMAN has gained +132% from the COVID lows while the S&P 500 has gained +100% from the COVID lows, that must mean that the remaining 493 stocks in the S&P 500 have, on the aggregate, produced a return far less than +100%. Again, this illustrates the point that the market is led by its most important players. The importance of FANGMAN to the stock market is essentially equivalent to how important Steph Curry, Klay Thompson, and Draymond Green are to the Golden State Warriors. Without their 3 best players, the team wouldn’t even make the playoffs. With them, they contend for championships. It’s usually best to have a couple of those guys are your team.
Cryptocurrency:
I wanted to post an update on the price structure chart that I shared yesterday, which once again has acted as a perfect guideline/path for the price of BTC.
As I outlined on July 20th and again yesterday, the breakout over the red trend line implied an extension back over $40k and potentially back to the recent highs slightly above $41k. During Monday’s session, the price of BTC rose to a high of $40.6k (nearly touching the white price level) and then got rejected as it has in the recent past. Price is now trading slightly below $37k on Tuesday night.
It’s somewhat uncertain where we go from here, although I believe most readers recognize that I remain extremely bullish on Bitcoin going forward. It’s certainly possible that we revisit the lower-bound of this sideways range, returning back to $30k.
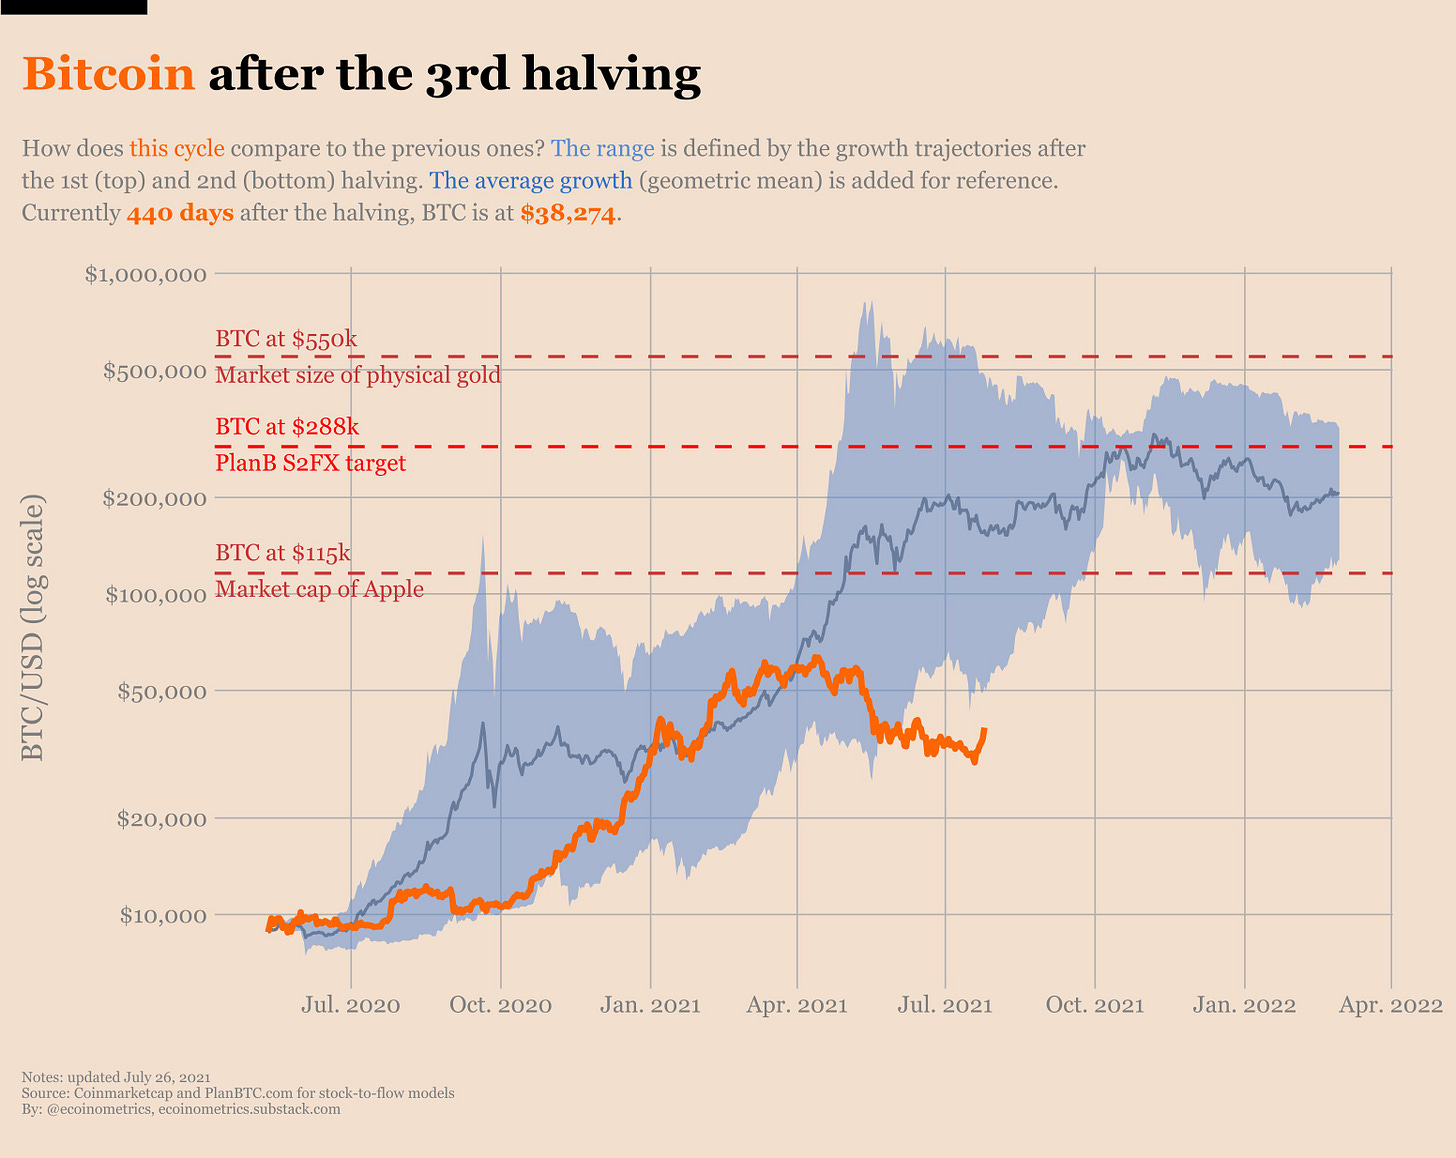
For context on the price action of the current halving cycle relative to the prior two halving cycles (2013 & 2017), here is an excellent graph showing the relative performance:
I continue to believe strongly in the stock-to-flow model, which you can read more about here.
Until tomorrow,
Caleb Franzen


