I thought it would be worthwhile to discuss the dynamics going on in the mortgage market, as this has both implications for the broader economy on a macro scale and the housing market on a micro scale. Aside from simply having an impact on economic & housing market dynamics, the mortgage market is also a symptom of broader economic conditions, notably from a monetary policy standpoint. Considering that the Federal Reserve has been purchasing at least $40Bn/month of mortgage-backed securities, we’re able to track in real-time how the Fed’s open market operations are impacting rates.
In the midst of Q1 2021, rates began to accelerate higher as the market began to price-in higher levels of economic growth & started to expect the Fed to raise rates sooner rather than later. This ascension ran counter to the longer-term trend, in which rates had been consistently declining since the Great Recession. Meanwhile, I continued to express my views on Twitter that the Fed’s purchases of MBS and zero interest rate policy (ZIRP) would likely push yields back to their January lows. On 3/11/21, just three weeks before mortgage rates peaked, I posted the following on Twitter:
Mortgage rates did move a bit higher following this post; however, as the market gained confidence that the Fed would maintain ZIRP & continue to grow their balance sheet via Treasury & MBS purchases, rates have returned back to their lows. Per the Fed’s most recent data, here is the longer-term chart showing the 15 & 30-year average fixed rate mortgage:
Right on cue, rates are back at/near their prior all-time lows. In fact, the 15-year average has reached new all-time lows at 2.12% (vs. prior 2.16%). Meanwhile, the 30-year average is currently at 2.78% (vs. all-time lows of 2.65%). Because short-term rates are more sensitive to changes in economic conditions, it’s sensible to believe that the 15-year trajectory is foreshadowing the path of the 30-year rate. In my opinion, it’s all but certain that the 30-year mortgage will make new all-time lows during the month of August. Similarly, my expectation is for rates to continue to make all-time lows for the remainder of 2021 & likely throughout 2022, even if the Federal Reserve begins to slow down their asset purchases.
Stock Market:
First things first, the Dow Jones, S&P 500, and the Nasdaq hit all-time highs on Friday and showed some massive strength in the face of some psychological adversity. The S&P 500 was able to complete a very cool milestone, officially doubling from the bottom of the COVID lows from last March.
At the time this photo was taken, the $SPX was trading at $4,408, but was able to close the session at $4,411. Now that we’ve officially hit a 100% return, many investors might feel trepidatious to still be buyers of equities; however, history teaches us that we should let fear guide our decision-making process. Here is a chart of the S&P 500 going back through history, where the red dots mark when the index made ATH’s at the time:
My best guess is that whatever happens, we’ll be alright.
The final thing I want to call attention to is the importance of winners & mega-cap technology stocks. Last week, I wrote about how the market is being pushed higher by its most important players, notably Apple ($AAPL), Microsoft ($MSFT), Amazon ($AMZN), Google ($GOOGL), and Facebook ($FB). More broadly, there are two other important names that should be included: streaming giant Netflix ($NFLX), and the semiconductor powerhouse NVIDIA ($NVDA). The acronym for these companies is FANGMAN, which are the clear creme de la creme of market winners. These companies also achieved a major milestone on Friday, hitting the highest aggregate market cap on record of $10.085Tn:
While the value of the S&P 500 has gained exactly +100% since the COVID lows, the value of these companies has increased by +132%. That 32% difference is extreme outperformance over the course of the last 16 months. It’s the equivalent difference between two sprinters who run the 100m dash and having times of 9.58 seconds (world record by Usain Bolt in 2009 and 12.65 seconds. Even high school athletes can run the 100m dash in the 10 second range, so completing the distance in 12.65 seconds is a stroll in the park relative to 9.58 seconds. The difference between these two values is also 32%, illustrating our theme of FANGMAN’s outperformance relative to the broader market.
Cryptocurrency:
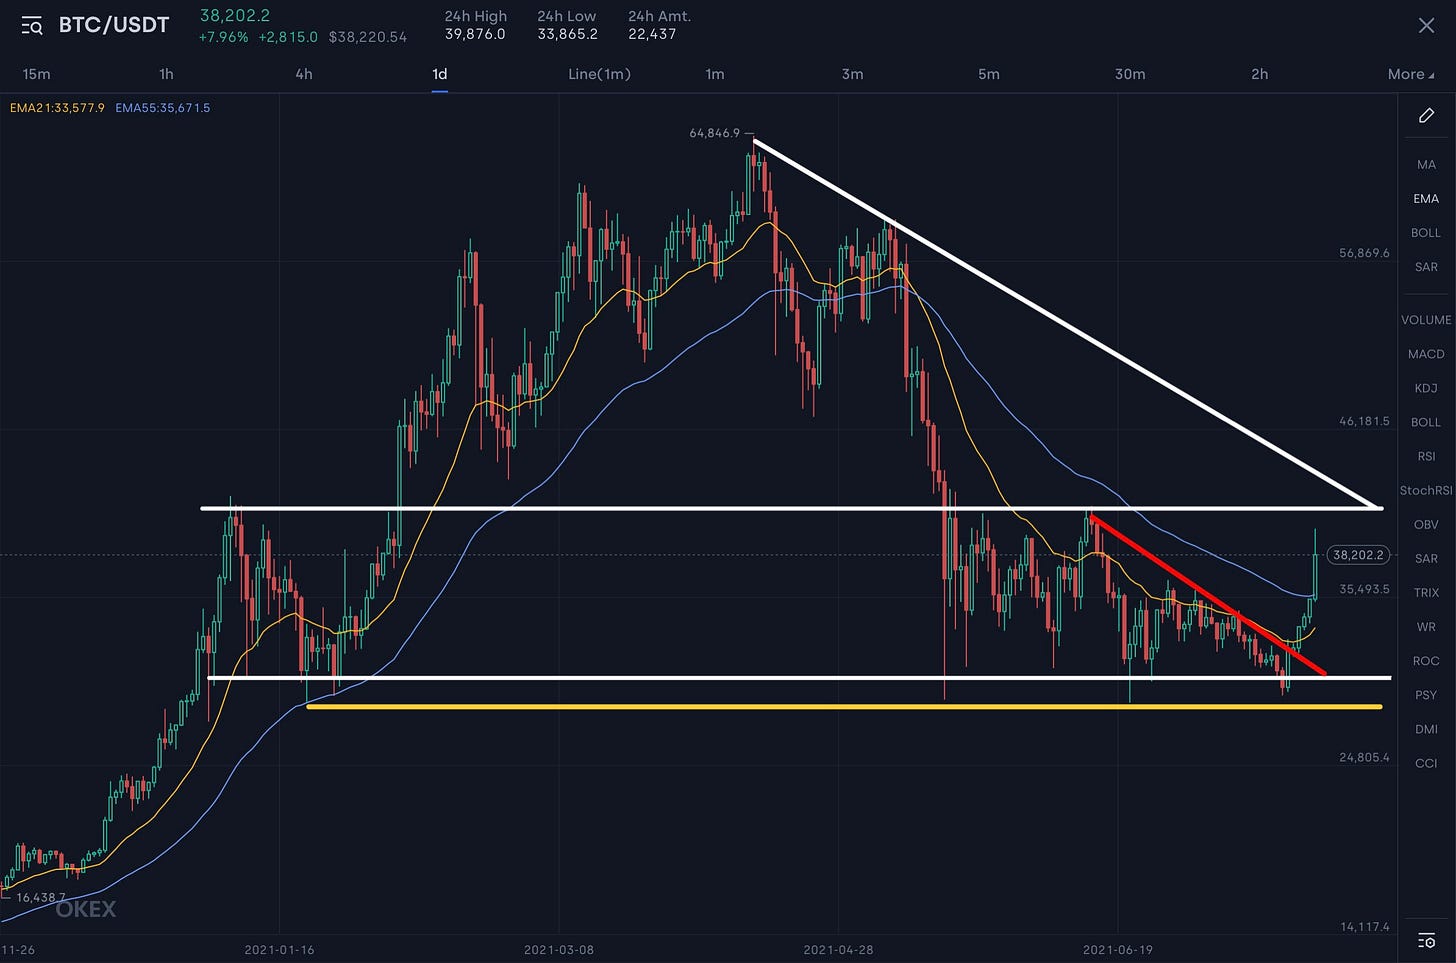
Last Tuesday, in Edition #51 on July 20th, I posted the following chart regarding the price of Bitcoin:
At the time, BTC was trading at $30,178 and I said the following: “A decisive break below the yellow level could imply a significant drawdown, potentially below $24k. Meanwhile a break above the red trend line could imply a new extension back to the upper-bound of the white channel, slightly above $41k”. It seems we have some resolution on this coin-flip, as the price of Bitcoin was able to accelerate above the descending red trend line over the weekend.
The lower-bound support range in white/yellow continued to act as support, seeing the price of Bitcoin make an extension to $39.8k on Sunday evening. At the time of writing, the price of BTC is stabilizing around $38.2k. It’s extremely encouraging to see the price rise back towards the upper-bound of the consolidation range, but we still need to see strength into this level. For the bullish momentum to cement its presence, we’ll need to see a decisive break over $42k followed by an extension over the descending white trend line from ATH’s. Just as the breakout above the red trend line created an implication of a new extension higher, a break above the white trend line will also imply another large move to the upside.
Until tomorrow,
Caleb Franzen


