Edition #54 - 7.21.2021
S&P 500 Under-the-Hood, Bitcoin Downside Trajectory, Housing Starts & Building Permits
Economics:
No update.
Stock Market:
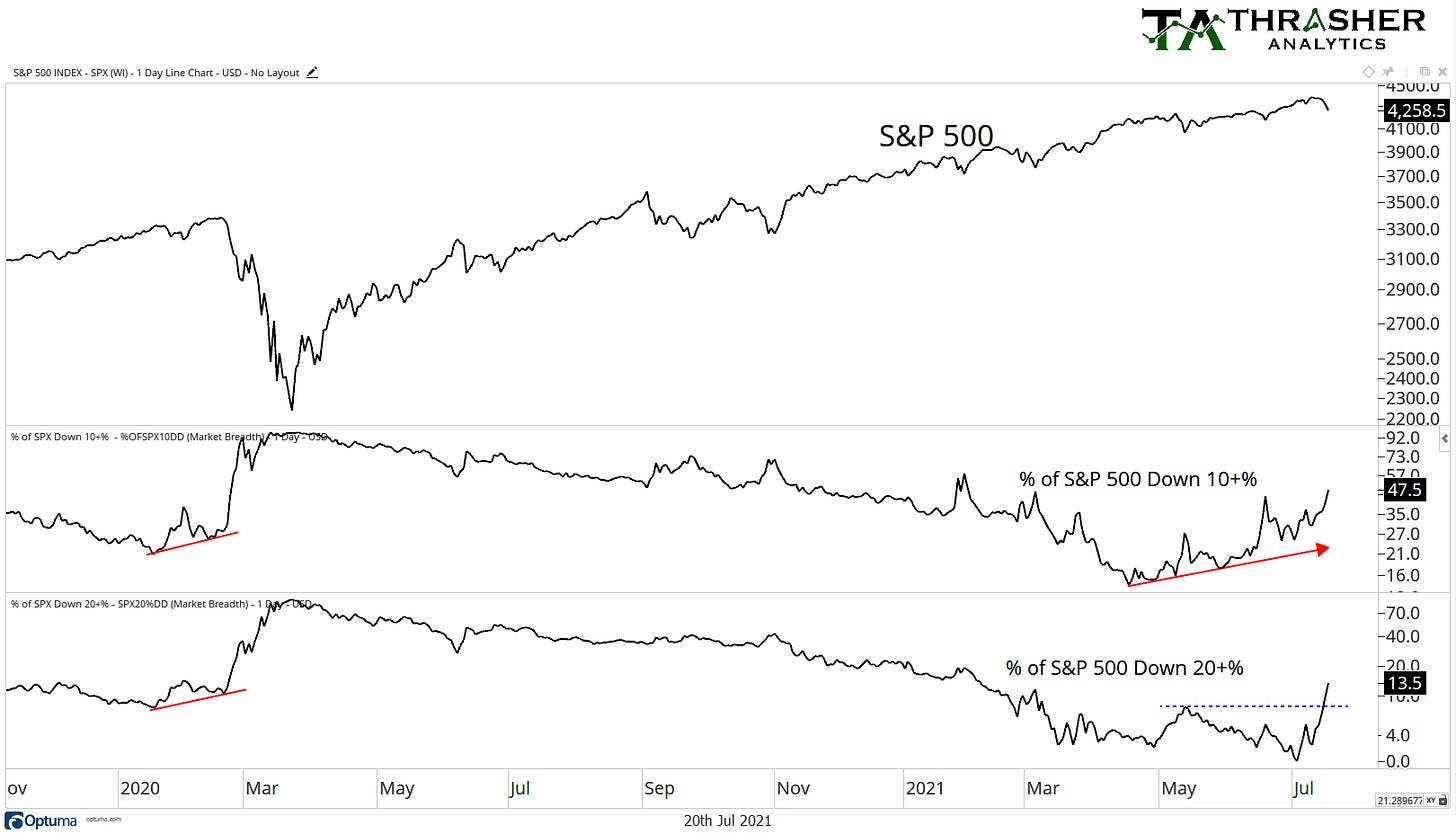
I saw a fantastic graph from Thrasher Analytics, provided by Andrew Thrasher (@AndrewThrasher on Twitter), showing how many stocks in the S&P 500 have fallen at least -10% from their recent ATH’s. The chart of the S&P 500 also contains the percent of stocks that have fallen at least -20% as well.
What this data shows is that nearly 48% of stocks in the S&P 500, or 240 companies, have fallen at least -10%. We can see a consistent acceleration in the percent of companies who meet this criteria since the end of April 2021, despite the overall S&P 500 making consistent ATH’s. This basically confirms what we already know: the wagon is being pulled by the strongest horses. The market has continued to push higher due to the outperformance of it’s largest weighted companies, aka large-cap tech. $AAPL, $MSFT, $AMZN, $FB, and $GOOGL all made fresh ATH’s over the last few weeks. $AAPL & $AMZN were sleeping giants since last August & September, only recently gaining massive momentum to the upside. Meanwhile, $MSFT, $FB & $GOOGL have been significantly outperforming the broader market for nearly the entire year.
The takeaway is that it pays to own winners, even if it’s perceived that you’re having to overpay for those winners at the time you buy them. For those who aren’t interested in owning individual companies, but would prefer to own a basket of stocks with high allocations to these companies, some of my favorite ETF’s are the following:
Vanguard Mega Cap Growth ETF ($MGK): 44.6% allocated to all of the above.
iShares Core S&P U.S. Growth ETF ($IUSG): 39.09% allocated to all of the above.
Technology Select Sector Fund ($XLK): 41.8% to $AAPL & $MSFT.
Communication Services Select Sector Fund ($XLC): 46.4% to $FB & $GOOGL.
By owning these ETF’s, you’ll will achieve high allocations to these specific companies, while also gaining exposure to a variety of other stocks. Depending on the specific ETF, those stocks could be $NVDA, $NFLX, $TSLA, $ADBE, $V, $CRM, $PYPL. So far, each of these 4 ETF’s is outperforming the actual S&P 500 in calendar year 2021.
Cryptocurrency:
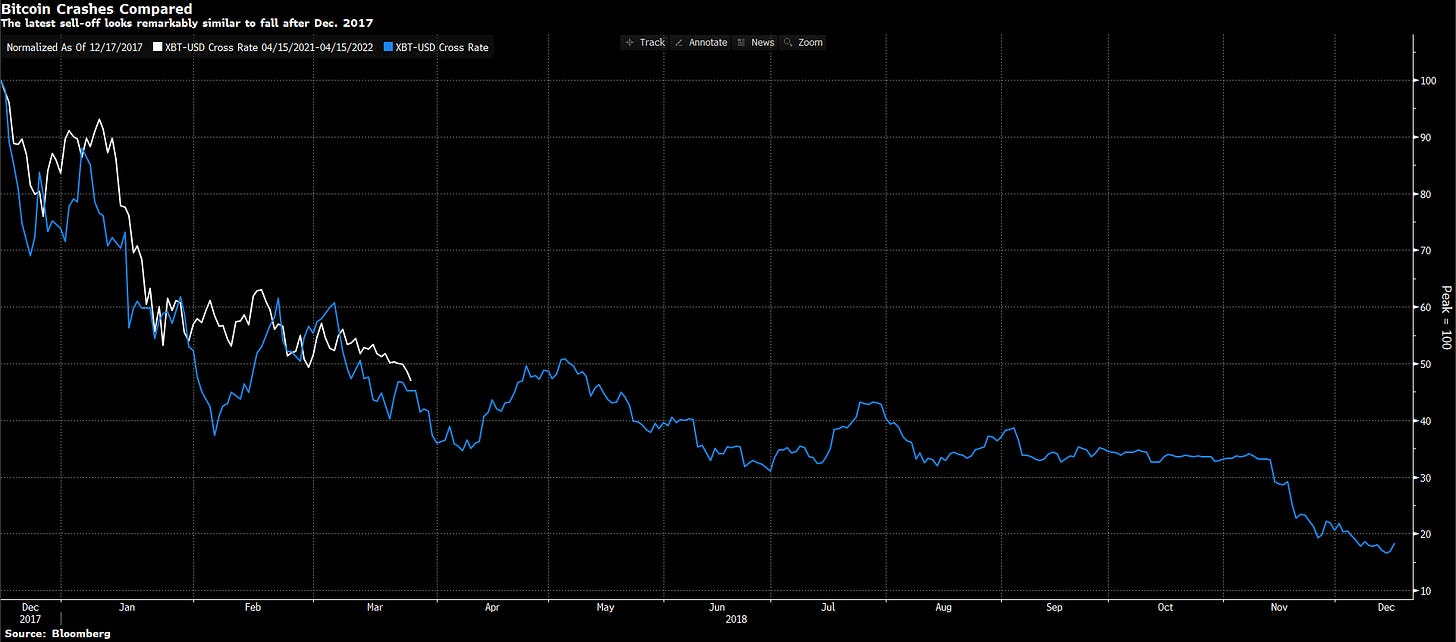
With growing concerns that the recent Bitcoin bull market is ending, here’s an excellent chart I saw from Bloomberg that overlays the current trajectory (white) vs. the prior decline from the ATH’s in 2017. The y-axis is normalized such that the peak is equal to 100%, and the remaining data is a ratio of the price divided by the ATH price.
We can see some slight similarities between this recent correction & the drawdown from the prior cycle, which would imply that there’s still a long way to fall if this is indeed the end of the bull market. Over the course of the 12 months after the December 2017 highs, the price of Bitcoin fell more than -80%. In the event that the current cycle follows the same trajectory, that would imply that price would fall to roughly $13,000 from ATH’s of approximately $64,800. Time will tell.
Real Estate:
As I’ve highlighted on this newsletter before, there are three primary reasons for the extremely strong housing market dynamics:
Historically low mortgage rates, artificially pushed down by the Fed’s significant purchases of mortgage-backed securities.
COVID-induced migration around the country allowed for coastal employees to bring their disposable income into housing markets with a relatively lower cost of living & housing prices.
Housing shortage relative to existing demand.
The first two factors are demand-side factors, which have induced relatively higher demand for houses, while the last factor highlights the lack of new supply relative to that increased demand. Therefore, it will continue to be important to monitor data regarding new housing starts & new permits for construction in order to address supply-side concerns.
Yesterday, the data for new housing starts & building permits were released for the month of June 2021. On a month-over-month basis, new housing starts jumped by +6.3% to 1.643M. We’re still at significantly lower levels than pre-COVID, but trending in a positive direction. While housing starts beat estimates & rose on a MoM basis, building permits declined by -5.1% to 1.598M and missed the consensus estimate of 1.7M. Courtesy of Reuters, here is an excellent graph showing the trajectory of each data point going back to 2005:
The data is encouraging, but still a very long way to go.
Until tomorrow,
Caleb Franzen


