Edition #52 - 7.19.2021
Fed Balance Sheet, June 2021 Retail Sales, Stock Market Drawdowns, U.S. Housing Market
Economy:
Another week of data means more new highs for the Federal Reserve’s balance sheet. The Fed’s assets are now worth $8.2Tn vs. slightly more than $4Tn at the start of 2020. For additional context, here is the long-term chart:
On a week-over-week basis, the size of the balance sheet grew by $108Bn & currently represents 38% of United States GDP. In my opinion, this truly shows the Fed’s conviction that inflation is going to be transitory.
We continue to see further evidence of a rebounding economy, although perhaps not as fast as we might expect. On Friday, the retail sales for the month of June 2021 was released, in which we saw a +0.6% increase relative to May. For each category of spending, here is an excellent graph from Oxford Economics & Haver Analytics showing the month-over-month delta:
I suspect “electronics & appliance stores” and “clothing & accessory stores” will remain towards the top of the list. One surprise that I noted was that “furniture & home furnishings” was the largest month-over-month decline, potentially implying that U.S. households have finalized & completed their home upgrades.
Stock Market:
While the S&P 500 made consistent all-time highs over the last month, the last week had enhanced volatility & selling pressure. There appear to be some dislocations in the market & divergence in the underlying data, making investors sense potential weakness for a short-term pullback. It appears this pullback will materialize further, but nothing is ever for certain.
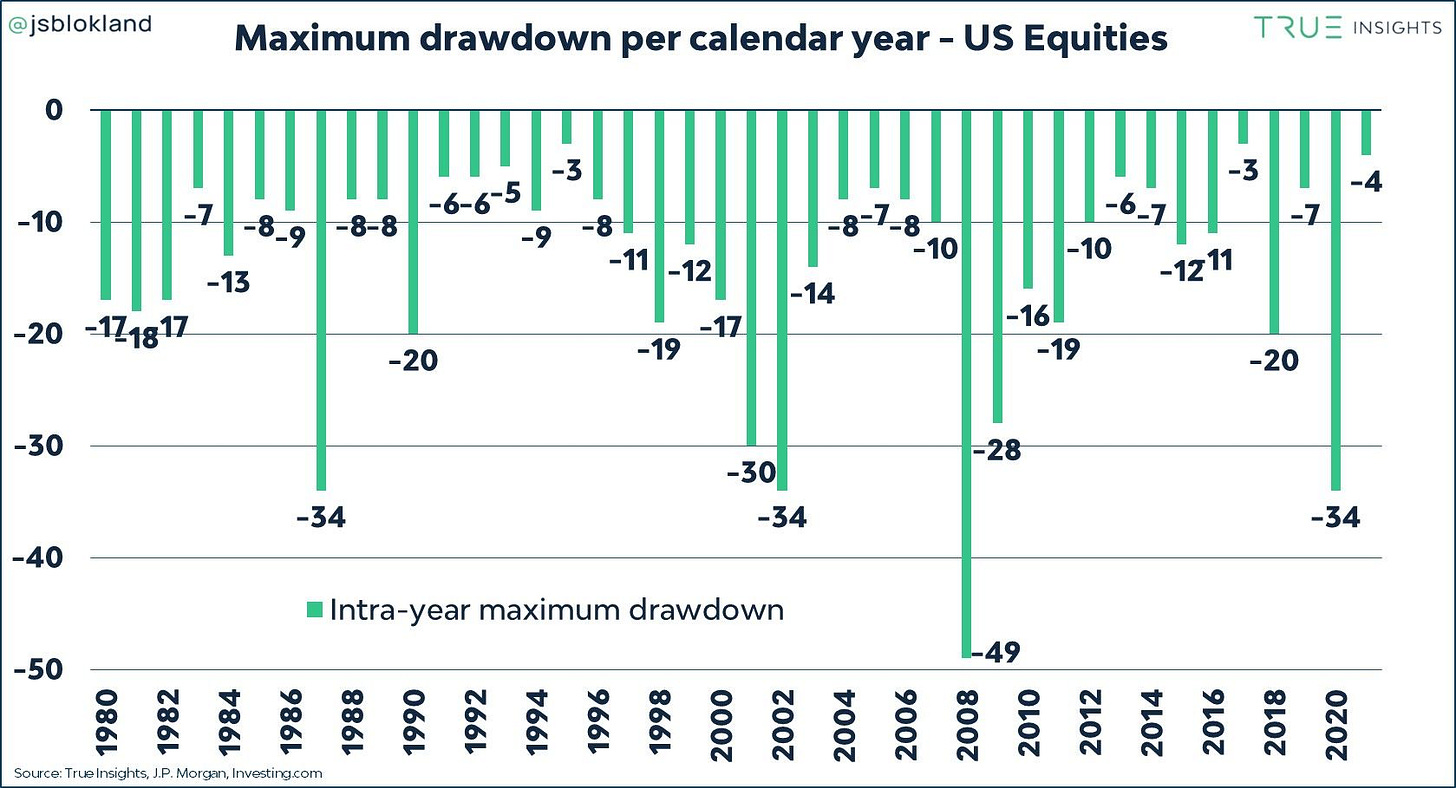
In light of potential market-wide pressures, market analysts have been posting a lot of interesting data on pullbacks & bear-case scenarios. This led me to come across the following chart from Jeroen Blokland (on Twitter as @jsblokland), showing the largest peak to trough drawdown per calendar year:
While the current potential drawdown may not actually materialize, it’s beneficial to understand that the market does indeed experience sharp & deep pullbacks. In fact, going back to 1980 (41 years of data, not including the present year), the stock market has experienced double digit drawdown in 56% of the calendar years. Of those 23 years that the stock market fell by at least -10% at some point during the year, there were 15 years that experienced an intra-year drawdown worse than -15%.
Stomaching that volatility can be very difficult, which is why understanding the data & knowing the historical outcomes can help an investor remain calm during tumultuous market conditions. I’m not saying we’re entering tumultuous market conditions, but any further downside should be considered “par for the course”.
Cryptocurrency:
No update.
Real Estate:
As the Fed’s balance sheet continues to grow, in which the FOMC aims to purchase at least $40Bn/month in agency mortgage-backed securities, the housing market remains extremely hot. Coupled with an underlying housing shortage, the downward pressure on mortgage rates has created a perfect tailwind for rising housing prices.
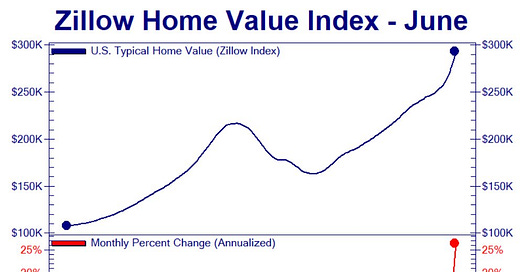
Over the weekend, I saw the following chart of the Zillow Home Value Index, which is a “smoothed, seasonally adjusted measure of the typical home value and market changes across a given region and housing type”.
The lower-bound graph simply takes the month-over-month delta, then calculates the annualized growth rate by compounding it 12 times. The most recent data, produced for June 2021, shows an annualized growth rate of +26.4% to $293,349 for the “typical” U.S. home. It would have been unfathomable 12-18 months ago that the housing market would be here today, but here we are.
To potentially add fuel to the fire, the Federal Housing Finance Agency announced on 7/16 that Fannie Mae & Freddie Mac mortgages will be ending refinance fee of 0.5%. This fee was introduced in 2020 as an adverse-market refinance fee “designed to cover losses projected as a result of the COVID-19 pandemic”. While this fee was in place, mortgages smaller than $125,000 were exempt from the fee, therefore this won’t be changing anything for homeowners with a mortgage smaller than $125k. However, considering that the “typical” home in the United States is approximately $293k, I’d assume a lot of homeowners are going to be re-incentivized to refinance their homes which will continue to push mortgage rates lower. As these mortgage rates get pushed lower, housing prices should continue to move higher, all else being equal.


