Edition #37 - 6.30.2021
Junk Bond Yields, Gold vs. S&P 500, Adoption Curves
Economy:
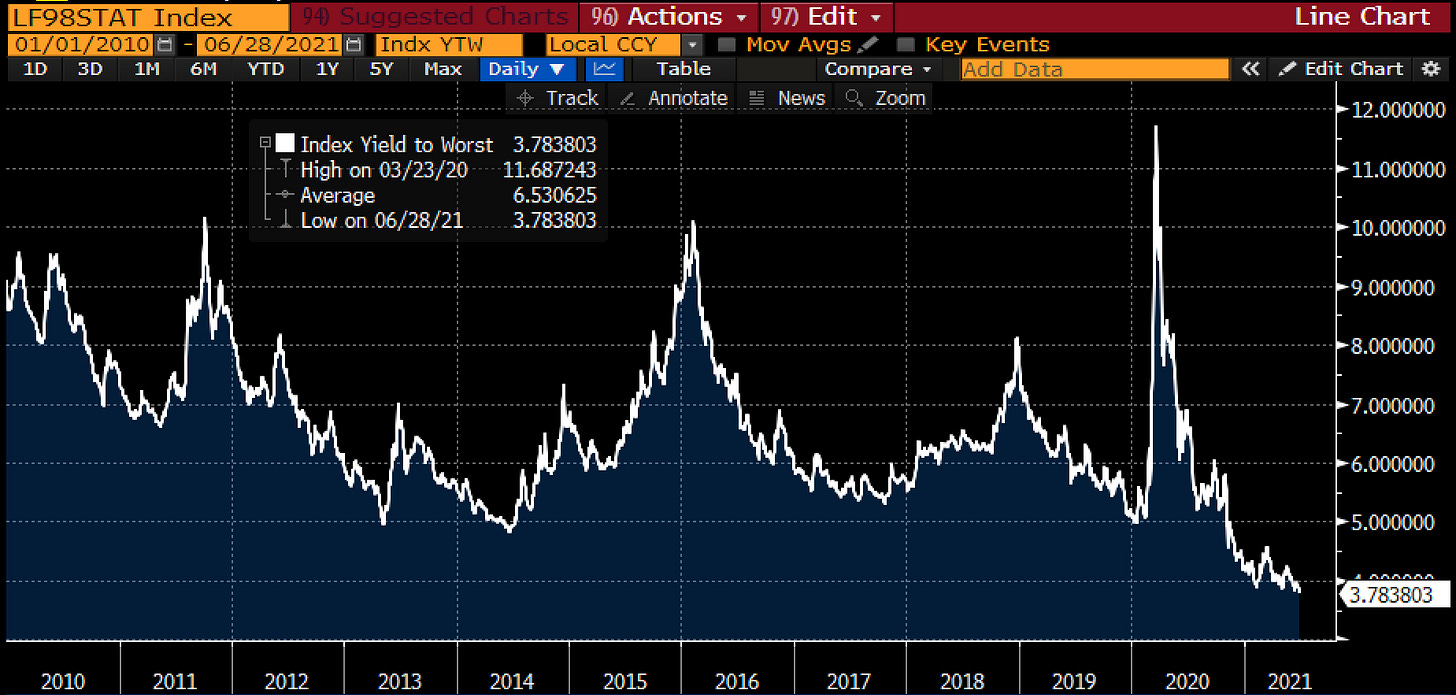
A few weeks ago, I highlighted the dynamics in the junk bond market, as measured through the high yield corporate credit index from Bloomberg. The data was covered in Edition #26 on June 16, in which the index reached an all-time low at 3.84%. In that newsletter, I said the following:
“As I’ve highlighted on this newsletter before, as yields fall, the present value of an asset goes up, all else being equal. Therefore, given the correlation between junk bonds and equities, as the yield on junk bonds continues to make new lows, my expectation is for junk bonds to make multi-year highs and for equity prices to continue to make all-time highs!”
Since that post, the S&P 500 and Nasdaq-100 have gained +1.02% & +3.7%, respectively, and have both hit new ATH’s. Funny enough, both indices had a quick but sharp decline in the immediate days after my post, both falling nearly -2%. This makes their current status of fresh ATH’s even more impressive.
So what have yields done over the last few weeks? If you guessed that they’ve made new all-time lows, you’d be correct, as the yield has continued to decline from 3.84% to 3.78%. While this may seem like a negligible decline, fixed income investors may find it more substantial. Here’s the updated graph, showing the historical context & trend:
I reiterate my expectation for the equity markets to keep making new ATH’s while junk bond yields create new all-time lows. At the present moment, the Dow Jones and the Russell 2000 have yet to make new ATH’s, therefore I expect that will change over the next 2 weeks. Technology & growth stocks have continued to provide leadership in the market, broadly outperforming other sectors. Attentive readers know that the tech/growth > value rotation has been covered at great length in prior newsletter since I began writing it in May. I also expect for that leadership & outperformance to continue.
Stock Market:
One aspect of the tech/growth > value rotation that I’ve mentioned in a prior newsletter is that the Fed’s recent policy meeting and the subsequent decline in yields “has allowed investors to move out further on the risk curve, insinuating that we’re in a ‘risk-on’ market environment”. I wrote this in Edition #28 on June 18.
To highlight this “risk-on” environment, meaning that investors are forced/willing to accept higher levels of risk based on conditions in the financial markets, I saw a great chart of the relative performance of gold vs. the S&P 500. Considering that gold is considered a safe-haven asset, an inflation hedge, and a store of value, the precious metal tends to outperform during periods of worry & underperform when investors are keen to accept risk. Special thanks to Grant Hawkridge for posting this chart on Twitter (@granthawkridge):
We can see how the trend in 2017-2019 can best be described as a sideways consolidation, with some slight downward pressure. At the start of 2020 & the onset of the pandemic, investors began to rapidly sell their S&P 500 exposure and were more likely to hold onto their gold, if not buy more gold. This led to a massive spike in GLD/SPY, in which the nominal price of gold increased from $1,450 to $2,090, but equities came back with a vengeance after bottoming in March 2020. Despite the substantial rise in gold, the S&P 500 was able to outperform, particularly after August 2020. Considering that gold has lost a substantial amount of value relative to the S&P 500, this helps to illustrate the nature of a risk-on environment. The GLD/SPY ratio reached new multi-year lows this week & I suspect that trend will continue to play out. With that said, I still believe an investor should have a small amount of their portfolio allocated to gold, in some fashion, but likely no more than a 3 or 5% allocation depending on the individual’s risk tolerance.
Cryptocurrency:
I saw a fantastic post from a famous Bitcoin analyst, Willy Woo, who has nearly 600,000 followers on Twitter. The post was minimally related to Bitcoin, but helps to add color to a recent post I had on exponential adoption curves, network effects, and Metcalfe’s Law.
His post said the following, with the chart included below:
“The Human Genome Project launched in 1990. By 1998 it was at 2% progress. The project reached completion by 2003. This is the nature of exponential growth. Bitcoin’s adoption doubles every year. It’s currently at 2% global penetration. Slowly, slowly, then all at once.”
It’s very easy to get caught in the concerns regarding the volatility of recent price action, but it’s nearly undeniable that the technological innovation of Bitcoin is only in the early stages & its adoption is growing at an astounding rate. Considering that Bitcoin is only 12 years old, it’s important to recognize that we’re still in the early innings. I continue to believe that the crypto asset offers the most uncorrelated, asymmetric investment opportunity at the present moment & it’s the reason why I have approximately 50% of my net worth invested in BTC. At the present moment, I don’t own any other cryptocurrencies & I have no intention of selling my BTC in the near or intermediate future.
Until tomorrow,
Caleb Franzen


