Edition #32 - 6.24.2021
Shipping & Trucking Rates, Semiconductor Stocks, BTC Price Structure Update, Housing Supply Shortage
Economics:
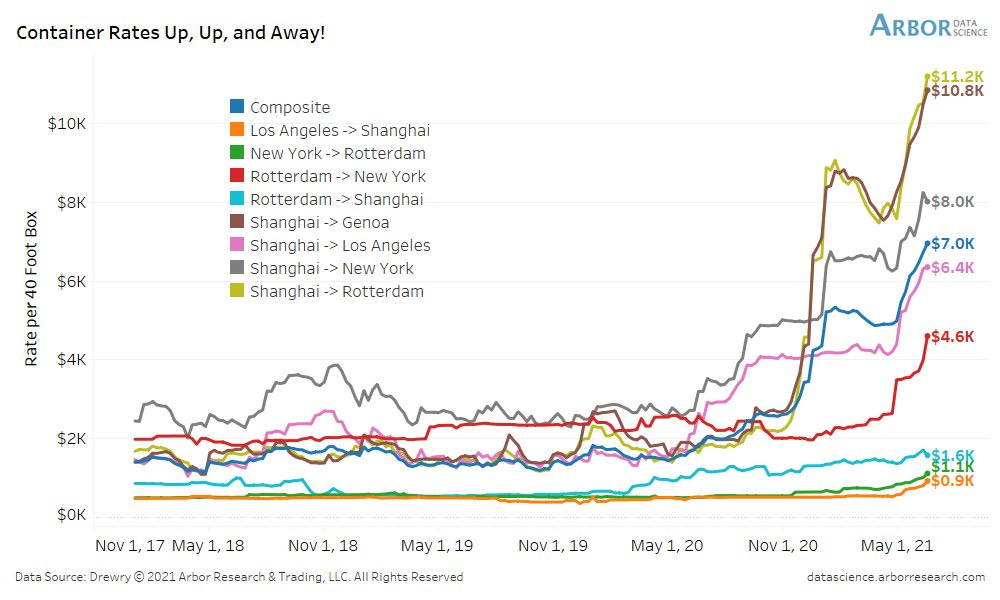
In regards to the commentary surrounding inflationary pressures, one of the primary factors that the Federal Reserve has attributed are supply-chain bottlenecks & general supply shortages. It’s no debate that these bottlenecks & shortages would cause an upward pressure on raw materials, components parts, and finished goods that are being transported inter or intra-nationally. This is one of the reasons why I’ve been investing in drybulk shipping carriers and aquatic tanker stocks, all of which have benefitted dramatically from an increase in shipping rates due to their high demand & bottlenecks.
As evidenced by the data, the World Shipping Index has risen more than 5x over the last 12 months, exacerbated by the factors mentioned above. Here is the graph showing that increase, provided by Drewry Supply Chain Advisors:
Shown slightly differently, here is a graph with aggregated data of various shipping routes & their corresponding price increases over the past months, provided by Arbor Data Science:
Despite a sense that inflation is going to rollover, as inflation expectations have dramatically decreased over the last 2 weeks, these factors for international supply chains will continue to provide tailwinds for inflationary pressures to rise. One bright-spot is that trucking rates have begun to decrease, based on additional data I saw provided from Arbor.
It is still far too early to tell if this is going to develop into a substantial move lower or if this is simply a head-fake before a greater extension higher (my guess is likely the latter). Both of these data points will be important & insightful as we continue to approach the inflationary outlook with a flexible & open mind.
Stock Market:
As I’ve continued to highlight the growing evidence of the tech/growth > value rotation, as well as recent technology sector relative outperformance, I wanted to provide some updated analysis on a specific industry that continues to develop favorably. In fact, I even included the industry as one of my top investment themes for 2021, published on the first trading day of 2021 (1/4/2021). The full paper, which is also an in-depth overview of economic conditions, monetary policy history, and a justification for my overall bullish sentiment on equities, can be viewed here.
The industry that I’m specifically referencing is the semiconductor space. In that section of the paper, I provided my top picks within the industry that I was most optimistic on: $NVDA, $TSM, $AMBA, $LRCX, $AVGO, $SITM, and $CDNS. The YTD returns for this group are: +45%, +6%, +14%, +32%, +7%, +15%, and -2%, respectively. An equal-weight portfolio, allocated only to these 7 positions, would have a YTD performance of +16.7%, outperforming the Dow Jones at +10.9%, S&P 500 at +12.9%, Nasdaq-100 at +10.8%, and Russell 2000 at +16.6%.
So did I just select solid companies or is the entire industry performing well so far YTD? We can really measure this through two exchange-traded funds (ETF’s) that are industry-specific funds for semiconductor companies, $SMH and $SOXX. These two funds are currently at +14.7 and +14.4% in terms of their 2021 YTD performance, so we could make the case that the industry as a whole is broadly outperforming U.S. equities, aside from the small-cap index, the Russell 2000. Even given the general outperformance of these semiconductor funds vs. the broader market, my basket of top picks is even outperforming the semiconductor industry as a whole.
I wanted to provide a quick update in terms of the technical analysis of the $SMH ETF, because my view is that the semiconductor industry is gearing up for another substantial move higher after approximately 4 months of sideways consolidation. Please refer to the chart below, which shows the price chart of $SMH beginning in January 2019:
Particularly over the last 12 months, price structure has followed a clear & easily-interpretable trend. The rising red trend line acted as support 5x in 2020, with a most recent confirmation occurring in May 2021 (2x). We can identify clear stair-step behavior in which price continues to hit new resistance levels and rebound higher on prior resistance/support levels. I’ve labeled each of these support, resistance, and breakout levels for clearer understanding. As we can see, price is currently pushing into the overhead resistance range in white, which has acted as resistance on 3 prior retests so far YTD. My prediction is that we are gearing up for a massive breakout above this level, based on the fact that we retested two key support areas: the grey range (prior ATH’s in 2020), which has acted as both support & resistance, and also the rising red trend line.
In my opinion, I believe the immediate rebound after retesting these two levels, which were aligned for confluence, shows strength in the uptrend & potential for a substantial leg higher. As shares continue to trade at this upper-bound range in white, I will remain patient to see an overall breakout extension above ATH’s before getting interested in being a buyer. Until that breakout occurs, almost anything can happen. Even if that breakout does occur, there are a variety of paths forward that price can develop, therefore, my projections are simply what I believe to be the most likely case scenario if/when that breakout occurs.
I will certainly post updates on this over the coming weeks in order to track the price structure & analyze any future developments, changes in the trend, or strength/deterioration. In any event, my level of conviction on this one is quite high, as semiconductors continue to lead the market despite more than 4 months of choppy price action.
Cryptocurrency:
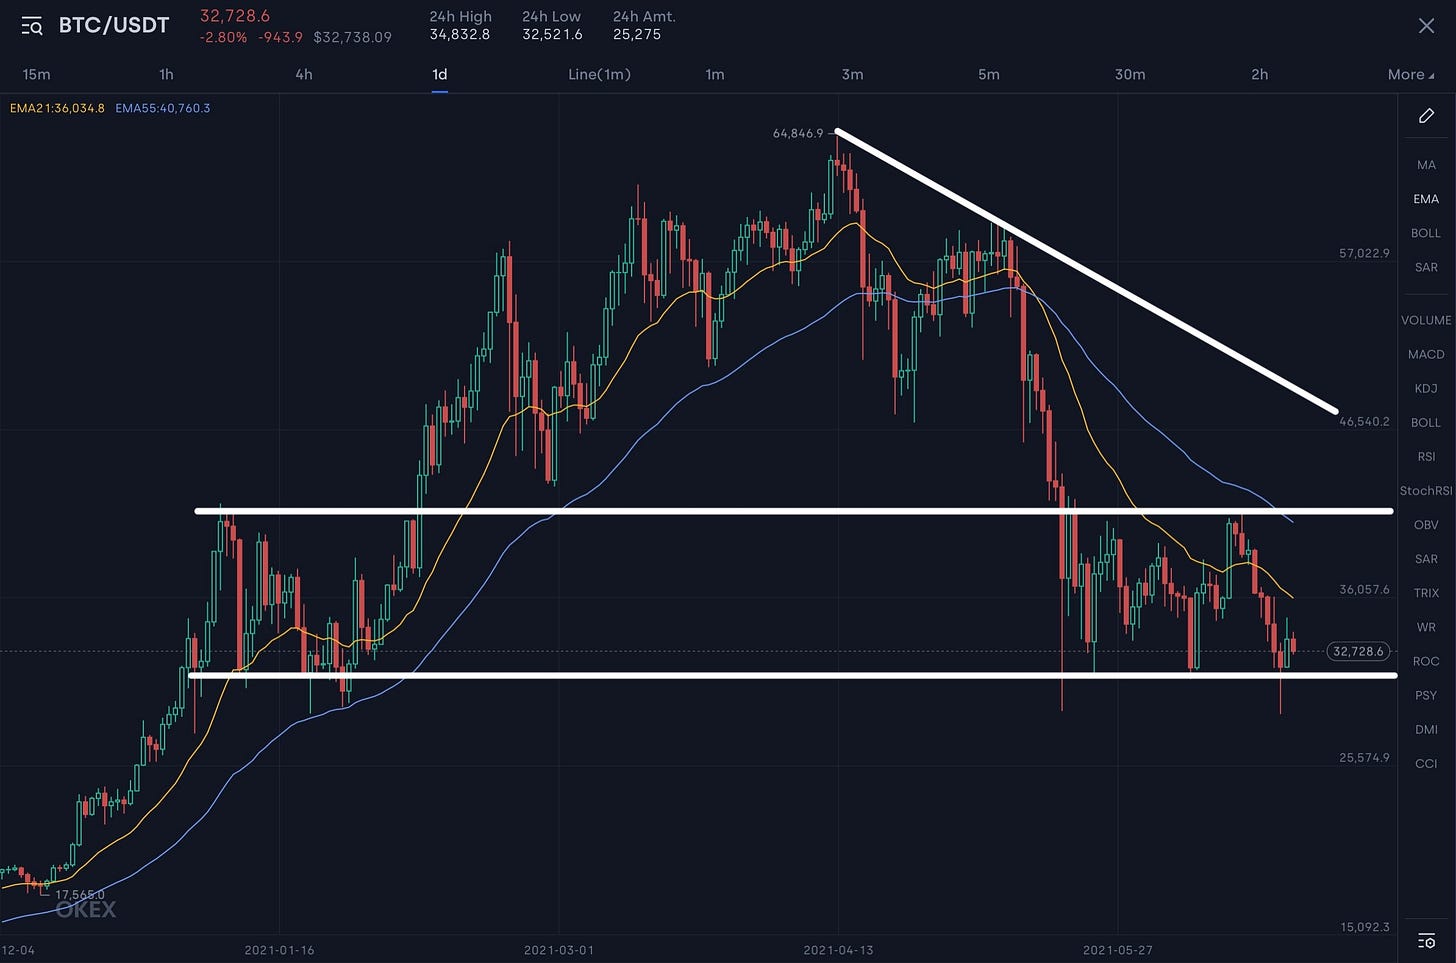
No major updates in terms of the crypto market, as I didn’t see any exciting new data, graphs, or commentary during yesterday’s session. However, with the recent volatility, I wanted to provide a quick update on the price chart, based on the technical analysis that I have covered here in recent newsletters, as the price structure I have been outlining has continued to work to perfection.
The last update I gave on this price structure was given in Edition #28, so please refer back there if you would like to see what my views were at the time of that publication.
Based on the current price of $32.7k at 10:45pm, here is the current price chart:
As we can see, the lower-bound support level I’ve had drawn on the chart has continued to remain effective so far. Although price dipped below the lower-bound, placed roughly around $31.4k, during trading on Monday morning, price rebounded significantly intra-day & closed at $31.7k & above the lower-bound. Price continued to rally on Tuesday’s session, but faced some indecision & downward pressure throughout Wednesday’s trading. At a current price of $32.7k, price is hovering just above the lower-bound, indicating that any minor slippage could lead to a downward thrust very quickly.
We’ve seen buyers step in with strong conviction when price dips below $30k; however, I believe that those buyers will soon get exhausted if price continues to remain in the $30k-$34k range. The longer we stay at these levels, the more dire the bull case becomes in terms of short-term price action. Amazing how this price structure continues to act as a guideline & reliable support/resistance signal. I bought bought more BTC on Monday when price was in the low-$30,000’s.
Real Estate:
I wanted to provide a quick update on the real estate market, based on the new home sales report that was released yesterday morning for the month of May 2021. The report came as a surprise, in which new home sales declined by -5.9% month-over-month to 769,000, the lowest figure in 12 months. The report shows that the median sales price was $374,400 (vs. $372,400 in the prior month) and an average sales price of $430,600 (vs. $435,400 in the prior month). The median home price for May 2021 reflects an +18.1% increase YoY. For further context, here is a graph showing the monthly new residential sales figure over the last 5 years:
We’re clearly near elevated levels, but approaching back towards the long-term trajectory.
After rising by an initial +21% in March 2021, which was sharply revised to +8.9%, we’ve now had two consecutive months in which the new home sales figure has declined (falling by -5.9% in both April and May 2021). Clearly, demand has slowed down substantially, which is also being reflected in the existing home sales data released earlier in the week. For the month of May 2021, existing homes sales declined by -0.9% to a seasonally adjusted rate of 5.8M units. The median home price was $350,000, reflecting an increase of +23.6% relative to May 2020.
So if demand is slowing down, why aren’t prices also adjusting to accommodate these changing market dynamics? As we know from simple economics, price is merely a function of supply & demand. As demand falls, all else being equal, prices should also fall. Therefore it should be theoretically clear that a decline in demand, followed by a rise in a prices, must only be explained by an insufficient level of supply (aka: supply shortage)! The data verifies that this is the exact dynamic in the housing market. The existing homes sales data showed that 1.23M homes were for sale in May 2021, down -20.6% from the same period a year earlier.
While many commentators & doomsday-sayers claim that were in a massive housing bubble, they seem to indicate that this is largely due to a rise in demand, exorbitant spending, and cheap financing. Aside from cheap financing, with the median 15 and 30-year fixed rate mortgages near all-time lows, these other explanations aren’t backed up by recent data. If we are truly in a housing bubble, which I think is debatable, the bubble is being inflated from a supply shortage rather than excess demand. This is actually a more preferred dynamic in order to prevent a crash in prices, as new home construction takes capital investment & time which should ease the market gradually back in an economy’s market-clearing prices & dynamics. I continue to remain bullish on housing prices going forward. The full report on the new home sales data can be found here from the BLS.
Until tomorrow,
Caleb Franzen


