Edition #30 - 6.22.2021
Inflation Expectations Roll Over, Small Caps Getting Hot, Bitcoin Price Action
Economy:
I touched on this last week, notably after the FOMC policy meeting that concluded on 6/16/2021, but inflation expectations continue to roll over from their recent peak (see Edition #28 where I discussed the break-even inflation rate). I saw the following chart, which was published by Bank of America in their survey of market participants, showing this very sentiment.
Unlike the charts that I’ve shown in the past pertaining specifically to the U.S. inflation data, this data is for the global CPI. I’ve discussed this ad-nauseam, but with less respondents expecting higher global CPI, this could be a forward-looking indicator of lower CPI inflation. That doesn’t mean that there won’t be rising prices, but simply rising at a slower rate than we were previously expecting. Because inflation is influenced by the psychology of consumers & producers, among many other factors, this could put more downward pressure on inflation, potentially validating the “transitory” inflation thesis.
So how are rates being impacted so far to start the week? 5-year Treasury yields declined, meanwhile the yields on 10 and 30-year Treasuries relative to the closing yield from last Friday. With 5-year yields peaking on April 5, 2021, and 10 & 30-year yields peaking in mid-March 2021, the short-term trend is down, the medium-term trend is up, and the long-term trend is down. Based on the way I’m allocating capital at the moment, my bias is that yields will get pushed lower in the short-term (assuming inflationary fears begin to subside); however, I am willing to accept the risk & remain extremely flexible should I start to see that yields are on the rise.
Stock Market:
Based on the dynamics immediately following the FOMC policy meeting last week, I prior questions about a rotation into tech/growth > value became more cemented and I began to take action to reflect these changing market conditions. I acknowledged in Edition #28 that I had formally begun to unwind several positions and rotate my own portfolio to be aligned with these changing dynamics, moving further out onto the risk curve by increasing my exposure to tech & growth-oriented equities.
In yesterday’s market session, the Nasdaq-100 was the worst performing index with a gain of +0.62%. Meanwhile, the S&P 500 (still very tech-centric) was +1.4%, the Dow Jones (mature/value) was +1.76%, and the Russell 2000 (small caps) was the strongest at +2.16%. The tech/growth related names I have been buying over the course of the last several trading sessions are predominantly in the $4Bn to $35Bn range, with one outlier on each tail. One of those outliers has a market cap of $96Bn (large cap) and the other has a market cap of $750M (micro cap), but the other positions are certainly in the small to mid cap range. In an expanding economy, where monetary stimulus is expected to remain significant for at least the next 12 months, this is where I want to be rotating my portfolio. I’ll continue to make this rotation gradual, and I feel comfortable with my current level of exposure at this time.
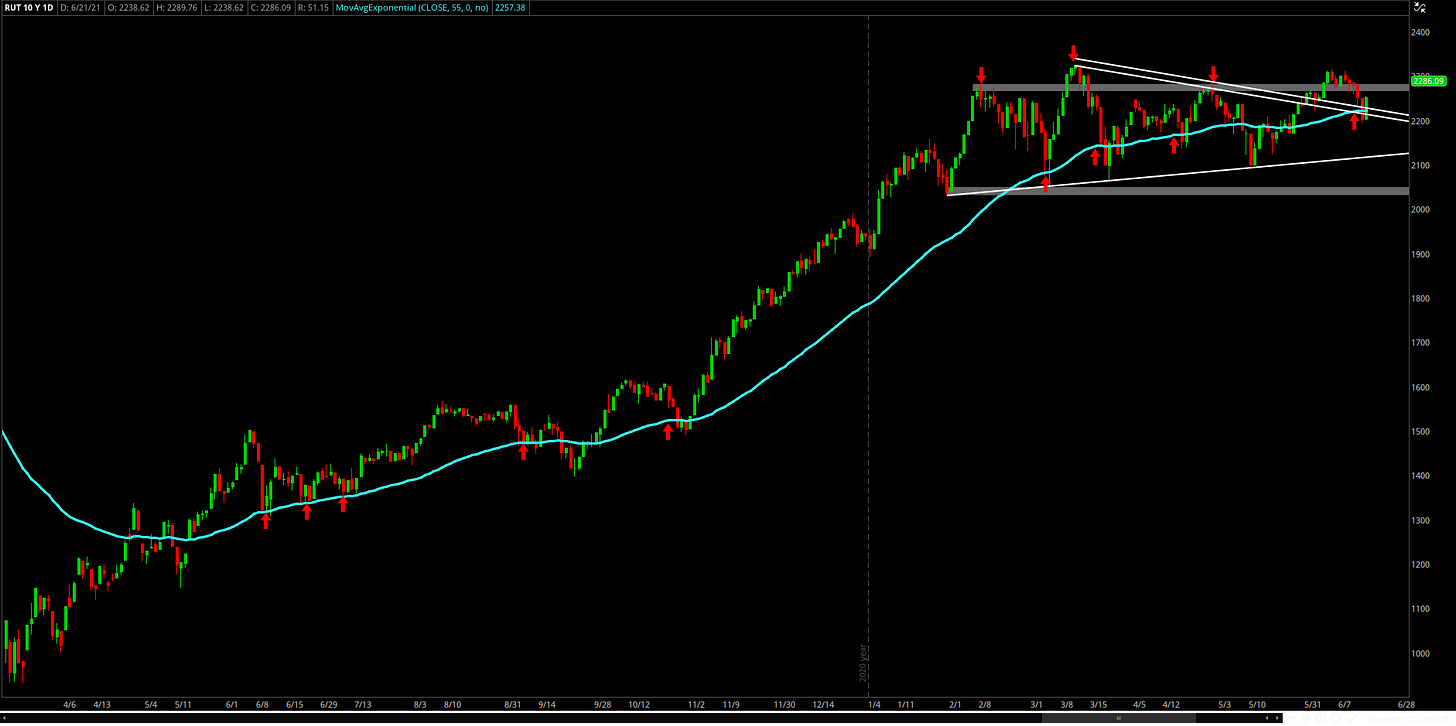
To tie the knot on the small cap commentary, I wanted to provide an update of my technical analysis on the Russell 2000 ($RTX), considering that the prior update was given on 6/14/2021. Beginning from the COVID lows in mid-March 2020, here is the current daily chart of the Russell 2000:
There is one primary aspect that I want to call attention towards in this chart, which is the significance of the 55 day exponential moving average (EMA) in teal. Since the COVID lows, retests of the 55 day EMA have provided amazing buying opportunities. In some cases, such as in June 2020 and March 2021, price immediately rebounded after retesting the 55 EMA for just one single day. In other cases, such as September 2020, October 2020, and May 2021, price falls below the 55 EMA for several days before continuing to ascend higher. The worst of these “drawdowns” occurred on 9/21/2020, in which price fell -5.5% below the 55 EMA over the course of 4 trading sessions. The most recent decline below the 55 EMA on 5/10/2021 resulted in a maximum drawdown of -4.24% over a 3 trading sessions.
This will help us to set probabilistic expectations for what we can expect based on the psychology of buyers/sellers in the past. In the last 8 retests of the 55 day EMA, the index has been higher 100% of the time 30 days later, producing an average return of +7.66% during that 30-day period. The minimum gain over that 30-day period was +0.18% and the maximum gain was +18.4%. If we instead evaluate the performance over a 90 day period, we can measure those results from 6 occasions, in which the average return was +18.12% and the index was higher 100% of the time. The minimum return over the 90-day period was +8.7%, the maximum gain was +37.7%, and the index gained double-digit percent (+10% or higher) in 4/6 occasions. These results were taken based on a simulation of purchasing the index on the exact moment of the retest of the 55 day EMA & selling at the closing candle after a 30-day and 90-day holding period.
Cryptocurrency:
In Edition #25, published on June 15, I shared the following chart & commentary in regard to the price action & technical analysis of Bitcoin:
“Now, just because price is slowing down at this level does not necessarily imply that it will back towards the lower-end of the range to retest support. It’s very possible the price of BTC continues to accelerate tomorrow, but my expectation is to see some consolidation at this level as buyers/sellers get re-accomodated with price back over $40k. I’ve continued to be a buyer in the $31k-$37k range, and even bought more at a price of $38.9k on Sunday evening [6/13/2021]. With price at this level, I’m taking a pause on my purchases in order to have more clarity on price structure.”
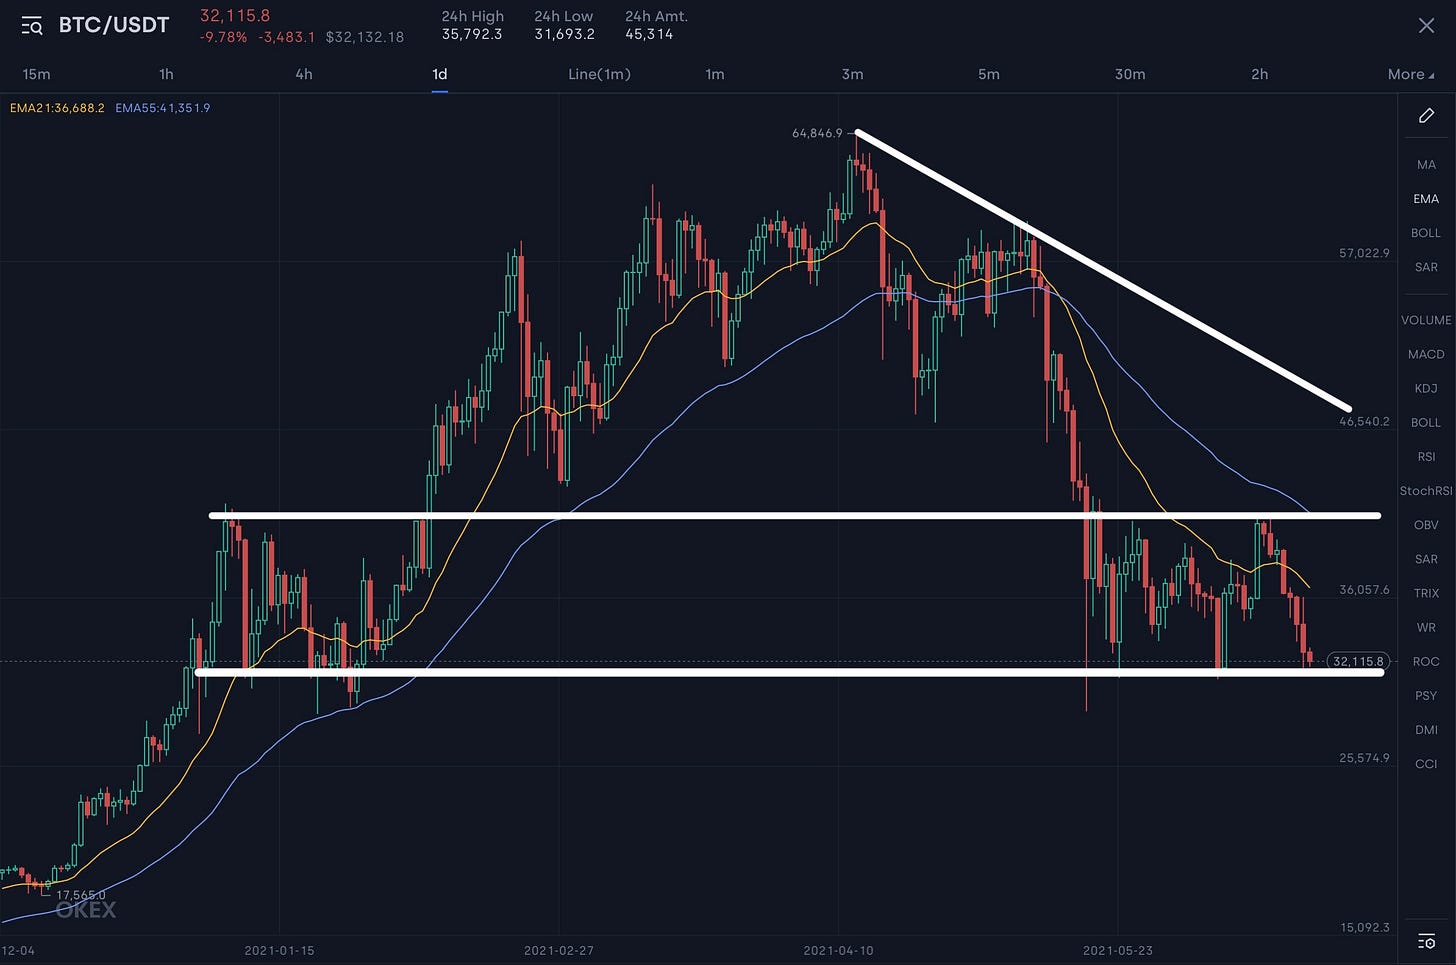
As I highlighted, buying more BTC at that time posed a higher level of risk because price was moving into an overhead resistance zone. Just because price was retesting that upper-bound level, that didn’t necessarily indicate that price would move lower, but it created an elevated level of risk. This is why I said that I would pause any buying activity in order to determine how the dust would settle. Less than a week later, here is an update on the current price action, using the same exact outline of support & resistance trend lines:
In the end, price was perfectly rejected from the level & is now back at the lower-bound at $32.1k. This decline since 6/15/21 represents a -20% drawdown, putting the price of Bitcoin at a pivotal inflection point. If we break beneath the lower-bound, and hold below that level for even a few days, that could imply that price has significantly more room to fall. At the same time, this $31k to $32k level has acted as support several times in December 2020, January 2021, and now three times since mid-May 2021. This current retest is the fourth time that the support level is being retested & it is vital that it holds. I bought more BTC yesterday evening at 8pm ET at a price of $31.4k, as it appears we are currently in a Wyckoff accumulation phase. For those who are unfamiliar with Wyckoff’s price structure analysis, I refer you to read the following article. This is certainly a risky level to be a buyer, as a decline below the lower-bound white level could would complete a bearish head & shoulder pattern & potentially foreshadow a substantial move lower.
It should be noted that I do not trade Bitcoin, I have never sold any Bitcoin, I have zero intention of selling any BTC, and I continue to view it as the most asymmetric asset to invest in for the future. Those are solely my views, and should never be considered investment advice for your particular risk tolerance or financial goals.
Until tomorrow,
Caleb Franzen


