Investors,
I need to cover two important housekeeping items before analyzing the most important market dynamics from this past week.
I’m officially recommending “Housing Market Insights” by Nik Shah! I’ve cited Nik’s research several times in my newsletter and I really admire the real estate analysis that he shares. It’s objective, concise, and insightful. If you’re interested in getting direct analysis from Nik & his team, I recommend that you follow him on Twitter and subscribe to his newsletter!
I’m offering a 7-day free trial to premium research from Cubic Analytics! Readership has been growing at an impressive pace and I want to welcome new members to the premium team. If you’ve been on the fence about upgrading your membership, this is an excellent way to check out my research and see if it’s right for you. At the very least, you’ll get full access to Sunday’s premium market research for free.
We’re encroaching on 200 premium members, who receive exclusive research & studies every week! Come join the team.
Macroeconomics:
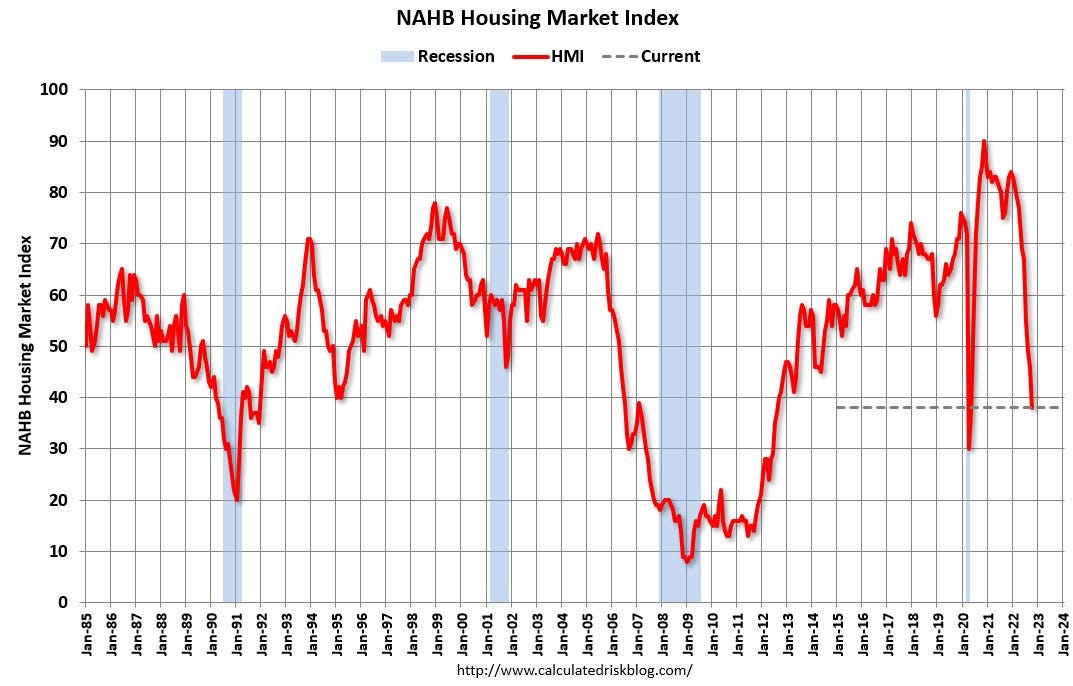
Fundamental economic data was of little importance this week, considering that the key labor market & inflation reports were released during the prior two weeks. From my perspective, the most meaningful data was the National Association of Home Builders (NAHB) survey and release of the Housing Market Index. According to the NAHB, “the survey asks respondents to rate market conditions for the sale of new homes at the present time and in the next six months as well as the traffic of prospective buyers of new homes.”
Expectations were for a result of 43 vs. 46 in the month of September. The result for October was a measly 38, highlighting the ongoing deterioration in the U.S. real estate market.
The decline in 2022 has been more significant than declines leading up to the Great Recession & 2008 housing crisis (thus far), highlighting the material impact of rising rates and extreme unaffordability. As of October 20th, the average 30-year fixed mortgage rate in the United States reached 6.94% for Federal Housing Administration (FHA) loans. However, data from Mortgage News Daily indicates that the average 30-year fixed mortgage rate has reached 7.32%!
Focusing on FHA loans tracked by the Federal Reserve Economic Database, we can contextualize the mortgage rate in three critical ways.
Tracking the average 30-year fixed mortgage rate: Keeping it simple, mortgage rates have been in a relative downtrend since 1981 after rising rapidly during the inflation era of the 1970’s. When the Federal Reserve started to buy mortgage-backed securities as part of their Quantitative Easing program in 2008, mortgage rates continued to decline aggressively. With the Fed transitioning aggressively from monetary stimulus to monetary tightening in 2022, we’ve seen mortgage rates accelerate after hitting all-time lows in 2021.
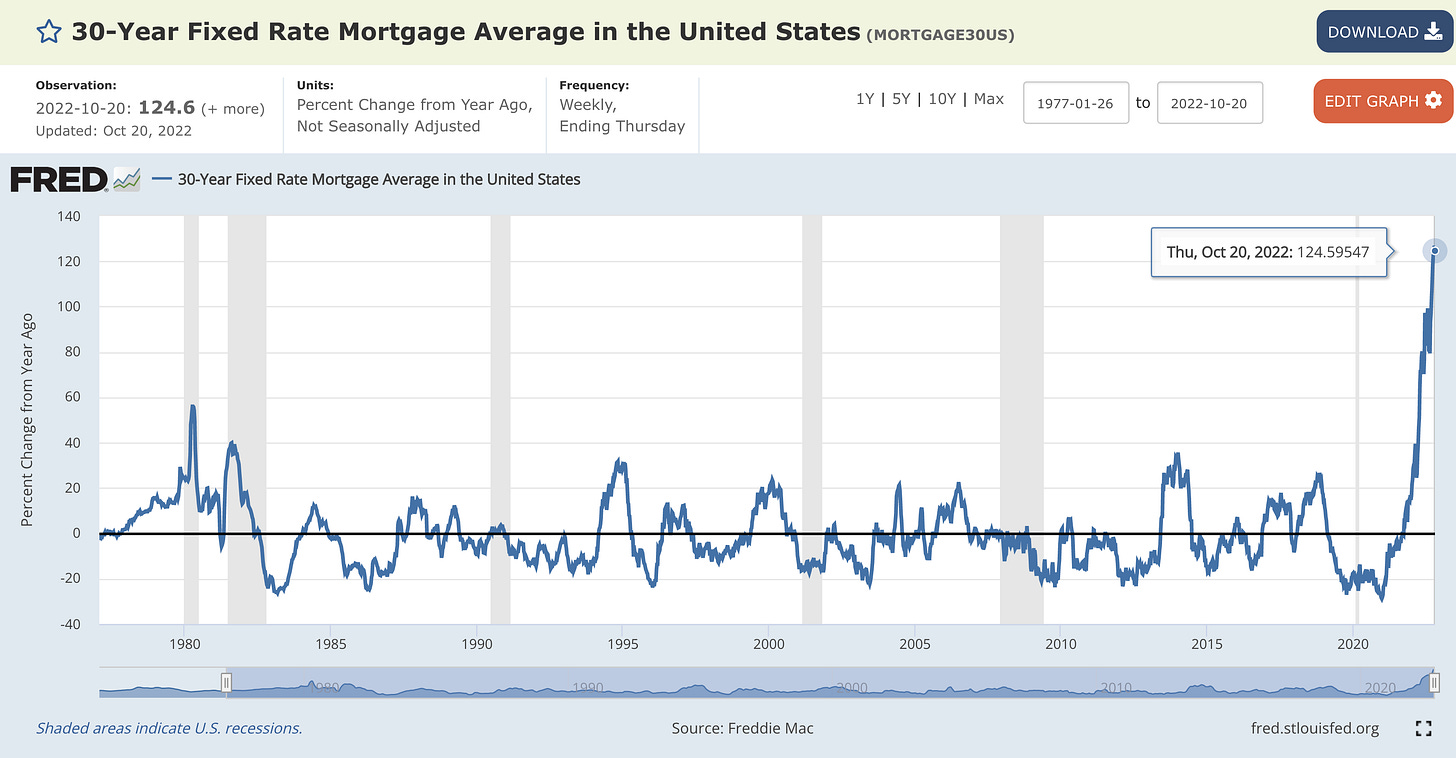
YoY percent change (rate of change): While some may frown on the idea of calculating the percent change of a percent, I think it’s a critical measurement. Considering that the mortgage rate is the cost of capital to borrow a house, a doubling of mortgage rates means that the monthly cost of owning a home has roughly doubled, all else being equal. If borrowing costs double, particularly as home prices remain at/near all-time highs, demand will disappear.
Relative to the average 30-year fixed mortgage rate in mid-October 2021, current mortgage rates have increased by a factor of +124.6%, or roughly 2.25x. Mortgage rates have never accelerated at such a significant pace! In fact, even the “rapid” rise in the late-1970’s never reached a +60% growth rate.
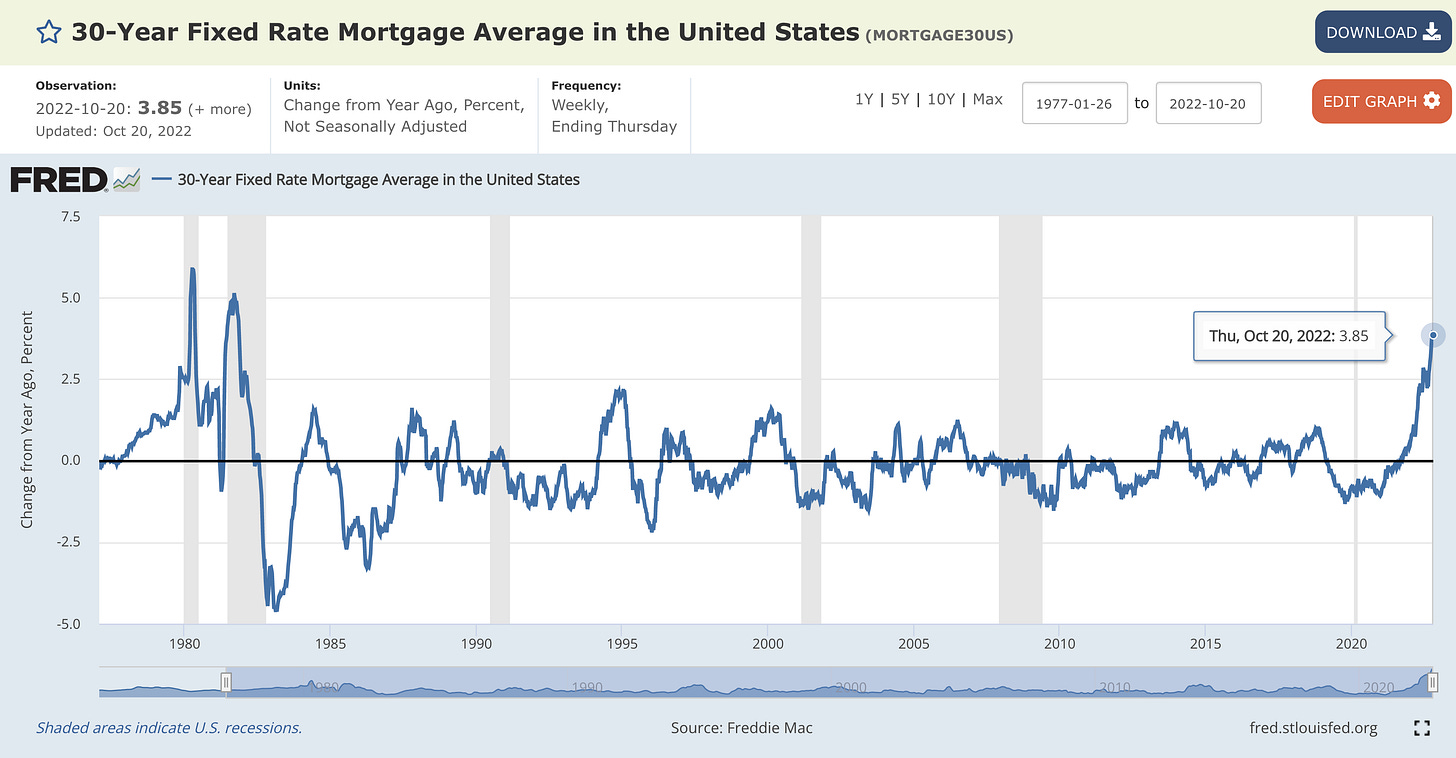
YoY percentage point increase/decrease: Considering that interest rates are rising from their lowest levels ever, some criticism of the YoY % change is warranted. In order to fully contextualize the acceleration, we can also measure how much mortgage rates have increased in terms of actual percentage points. Considering that mortgage rates are 6.94% today and were 3.09% this time last year, the chart below indicates that the nominal percent change on a YoY basis is +3.85%. Tracking this calculation on a rolling basis contextualizes the significance of current mortgage market conditions.
There is nothing normal about the mortgage market right now. The rapid rise in the cost to finance a home has seemingly forced potential buyers out of the market, illustrated by a multi-decade low in the Mortgage Applications Index:
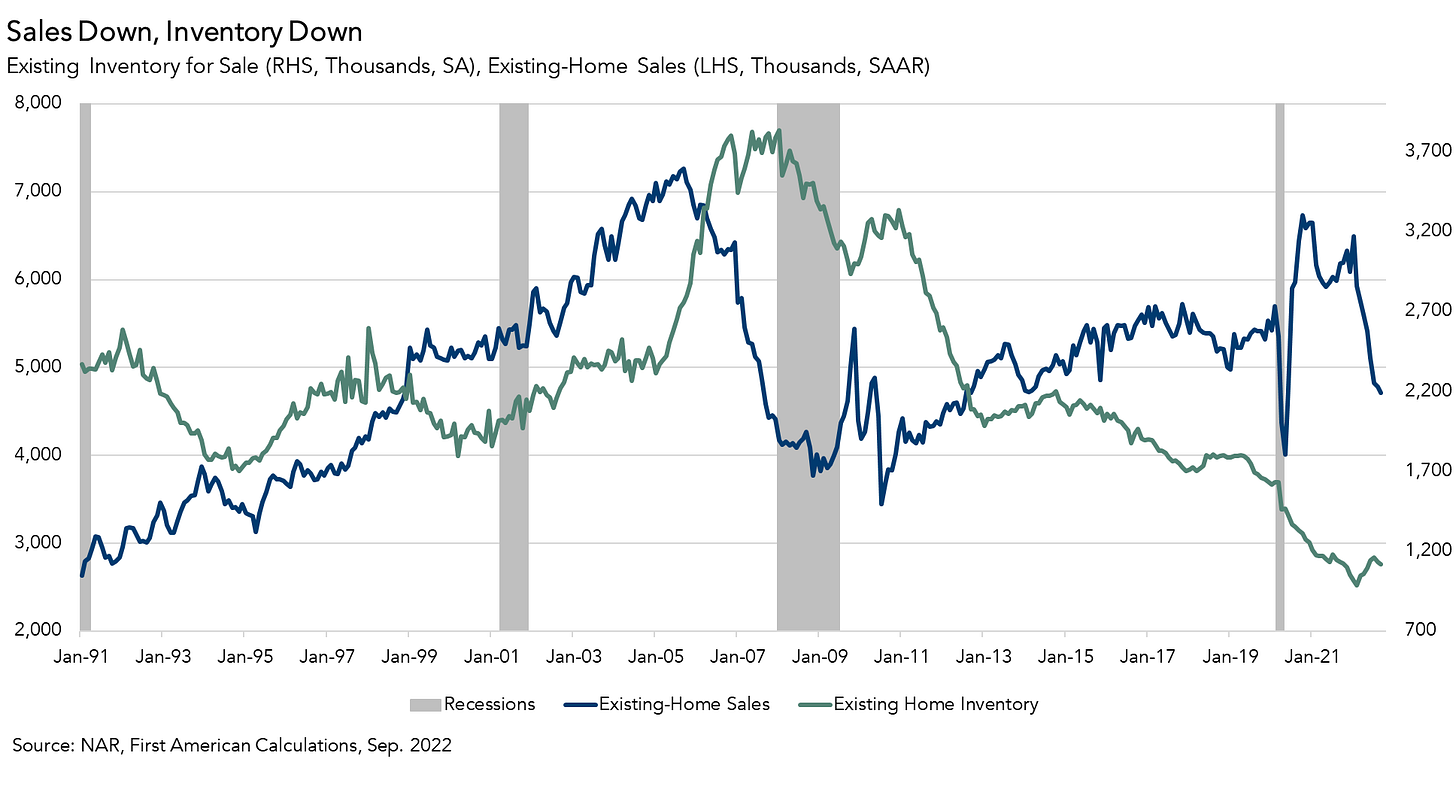
On the supply side of the equation, home inventory is extremely limited and keeping home prices at/near record highs. Existing homeowners have minimal incentives in this market to sell their home, considering that their next options are to buy a new home (at historically elevated prices & mortgage rates) or become a renter (at historically high rental prices). Considering that neither of these choices are optimal, existing homeowners are likely postponing the sale of their house. As mentioned, this dynamic has resulted in extremely low housing inventory (green):
In summary, we have:
Mortgage rates at 20-year highs.
Mortgage rates accelerating at a historic pace.
Home prices at/near all-time highs.
Mortgage applications at multi-decade lows.
Supply & inventory at historic lows.
Existing home sales falling rapidly.
Housing market activity is coming to a freezing halt, which is likely to foreshadow a material decline in home prices. I don’t know how soon this decline will materialize or how significantly the magnitude will be, but I think that investors should be prepared to see home prices fall.
Stock Market:
The stock market had a surprisingly strong week, particularly after the prior Friday’s abysmal performance. Performance was sandwiched in terms of returns, with positive returns at the beginning/end of the week and negative returns in the middle. The bulk of the weekly returns came during Friday’s session, after a Wall Street Journal article discussing the likely path of the Fed’s monetary policy. The article was written by Nick Timiraos, who has become known as “the Fed Whisperer” in recent months, as many market participants have speculated that he has become privy to Fed policy and used as a medium to communicate upcoming Fed policy decisions.
Timiraos’ latest article indicated that “The Fed is barreling towards a fourth straight 75-basis-point rate rise at the November [1st & 2nd] FOMC meeting. That meeting could serve as a critical staging ground for future plans, including whether and how to step down to 50 basis points in December”. With financial markets hinging on any hint of a Federal Reserve pivot, or reduction in the pace of monetary tightening, this Friday morning news story fueled a massive rally to end the week.
On Friday’s session alone, the U.S. stock market indexes posted the following returns:
Dow Jones $DJX: +2.47%
S&P 500 $SPX: +2.37%
Nasdaq-100 $NDX: +2.39%
Russell 2000 $RUT: +2.22%
For the past several weeks, I’ve been highlighting how the “less risky” assets are being more volatile than the “more risky” counterparts. We continue to see this dynamic play out before our eyes, with the Dow Jones leading the market performance on Friday (though the Nasdaq-100 had the highest weekly return at +5.78%).
From my perspective, the Dow Jones is showing positive signs of life & the potential for more upside momentum. The index perfectly retested the lower-bound of this parallel channel & has continued to rebound higher.
While I am concerned about the failed breakout attempt from the mid-June through mid-August rally, it’s clear that this channel provides a respectable guideline for the index. Bear markets are characterized, at least in part, by significant rallies that can lead to a false sense of hope for investors. They’re affectionally referred to as “bear market rallies” because they don’t last and eventually fade back to the prior lows.
Throughout the year, I’ve been advocating that investors should use these market rallies to reduce their short-term portfolio exposure, raise cash, and DCA into core portfolio holdings. Using the technical analysis above as a guideline, I think we might see further upside to the top of the channel; however, I intend to use this potential path as an opportunity to raise cash once again. By no means is it a guarantee that the Dow Jones will continue to rise to the top of the channel, or that it will get rejected if/when we get there. As such, I think it’s prudent to begin decreasing risk as soon as next week while still leaving enough portfolio exposure to benefit in the event that the market does continue higher. Reducing risk does not mean remove all risk entirely!
With that said, I think that we’re seeing constructive signs that risk appetite is increasing. For example, consider the relationship between semiconductor stocks vs. the broader basket of technology stocks. To evaluate this dynamic, we can compare SMH 0.00%↑ vs. QQQ 0.00%↑:
On a relative basis, semiconductors are rebounding on a proven support trendline that dates back to 2015! We aren’t in the clear yet, as we’d ideally need to see a breakout above the red horizontal range, but this is certainly a positive development. Of course, we’ll need to watch this relationship on a daily basis to ensure that it continues to develop in a positive manner. Just because something is rebounding now doesn’t mean that it will continue to rebound!
Bitcoin:
Staying on the topic of risk appetite, I think it’s important to analyze Bitcoin as one of the primary arbiters of truth across the entire financial market. With traditional markets & investors viewing Bitcoin (and the broader cryptocurrency market) as the most speculative asset(class) in the world, it’s been very interesting to see Bitcoin stabilize right above $19,000 for the past three weeks.
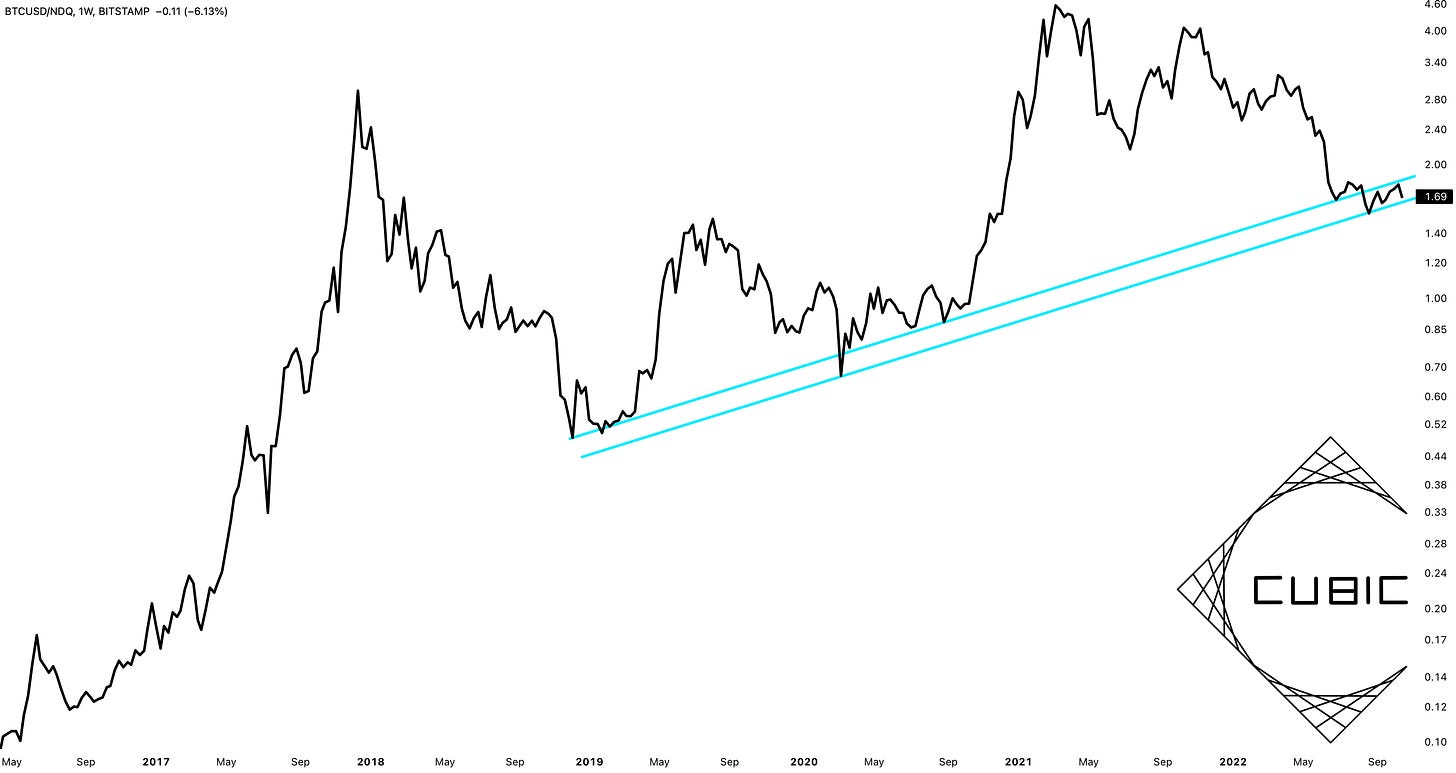
While many analysts were quick to highlight Bitcoin’s “relative strength” vs. the stock market at the end of September, these same analysts have gone silent in regards to Bitcoin’s recent “relative weakness”. In fact, if we denominate Bitcoin by any of the major U.S. stock market indexes, Bitcoin lost value relative to stocks this past week. With many investors viewing Bitcoin as a high-beta version of technology stocks, my favorite method for analyzing Bitcoin’s relative trend is to compare BTC vs. the Nasdaq-100. Taking a long-term approach, we can see that BTC/NDX is trading at a key support trendline:
I think that it’s vital for this relationship to remain above the trendline, otherwise I fear that more downside is ahead for Bitcoin absolute basis terms. Price has essentially been consolidating around this support zone since mid-June, making little progress in either direction. This lack of conviction in either direction forces me to differ to the direction of the short-term trend as an indicator for where price will go next. Considering that BTC/NDX made higher lows in 2021 and is making lower lows in 2022, I think we will see BTC/NDX break below this trendline in the coming weeks. I’d love to be proved wrong on this, and I believe there is still a chance for price to rebound on this level. However, bulls need to see this manifest as soon as possible.
Considering that BTC/NDX declined this past week, this is indicative of risk appetite declining. We’re getting conflicting signals with respect to risk appetite, so I think it’s vital for all investors to remain nimble in this environment and attempt to find confluence when possible.
Best,
Caleb Franzen
DISCLAIMER:
My investment thesis, risk appetite, and time frames are strictly my own and are significantly different than that of my readership. As such, the investments & stocks covered in this publication are not to be considered investment advice and should be regarded as information only. I encourage everyone to conduct their own due diligence, understand the risks associated with any information that is reviewed, and to recognize that my investment approach is not necessarily suitable for your specific portfolio & investing needs. Please consult a registered & licensed financial advisor for any topics related to your portfolio, exercise strong risk controls, and understand that I have no responsibility for any gains or losses incurred in your portfolio.


