Edition #207
Risk Assets Attempt To Produce a Higher Low
Investors,
We experienced another fascinating week in financial markets, though we didn’t receive new economic data that carried much significance. This past week was the equivalent of economic purgatory, sandwiched between the prior week’s important labor market reports and the upcoming week’s important CPI report. As such, stock & crypto markets were left to their own rationale.
Nonetheless, I noticed valuable signals across the asset markets this week that I want to highlight in this report. When the cat’s away, the mice will play.
Earlier this week, I sent out the first investment research report of my new series, “Portfolio Strategy”, where I’m sharing the 15 stocks & ETF’s that I’m buying in this bear market. Not only do I share what I’m buying, I’m also explaining why!
Each report will conduct qualitative and quantitative investment analysis of two individual stocks in order to explain the investment thesis behind each position. Please consider becoming a monthly/annual premium member to access this research going forward:
Macroeconomics:
There are two primary aspects that I want to focus on in terms of economic data:
Income
Wealth
While we’ve experienced two consecutive quarters of negative real GDP growth in the United States, therefore entering a “technical” recession, I don’t believe that we aren’t in a “real” recession at the present moment. It’s odd to say that we’re in a recession while nominal incomes are growing at a historic pace, the unemployment rate is near historic lows, and companies continue to expand their labor force on net.
Considering that the labor market is a lagging indicator, this simply highlights the need to monitor a full range of economic data pertaining to income, which could therefore provide more dynamic clues of a potential recession.
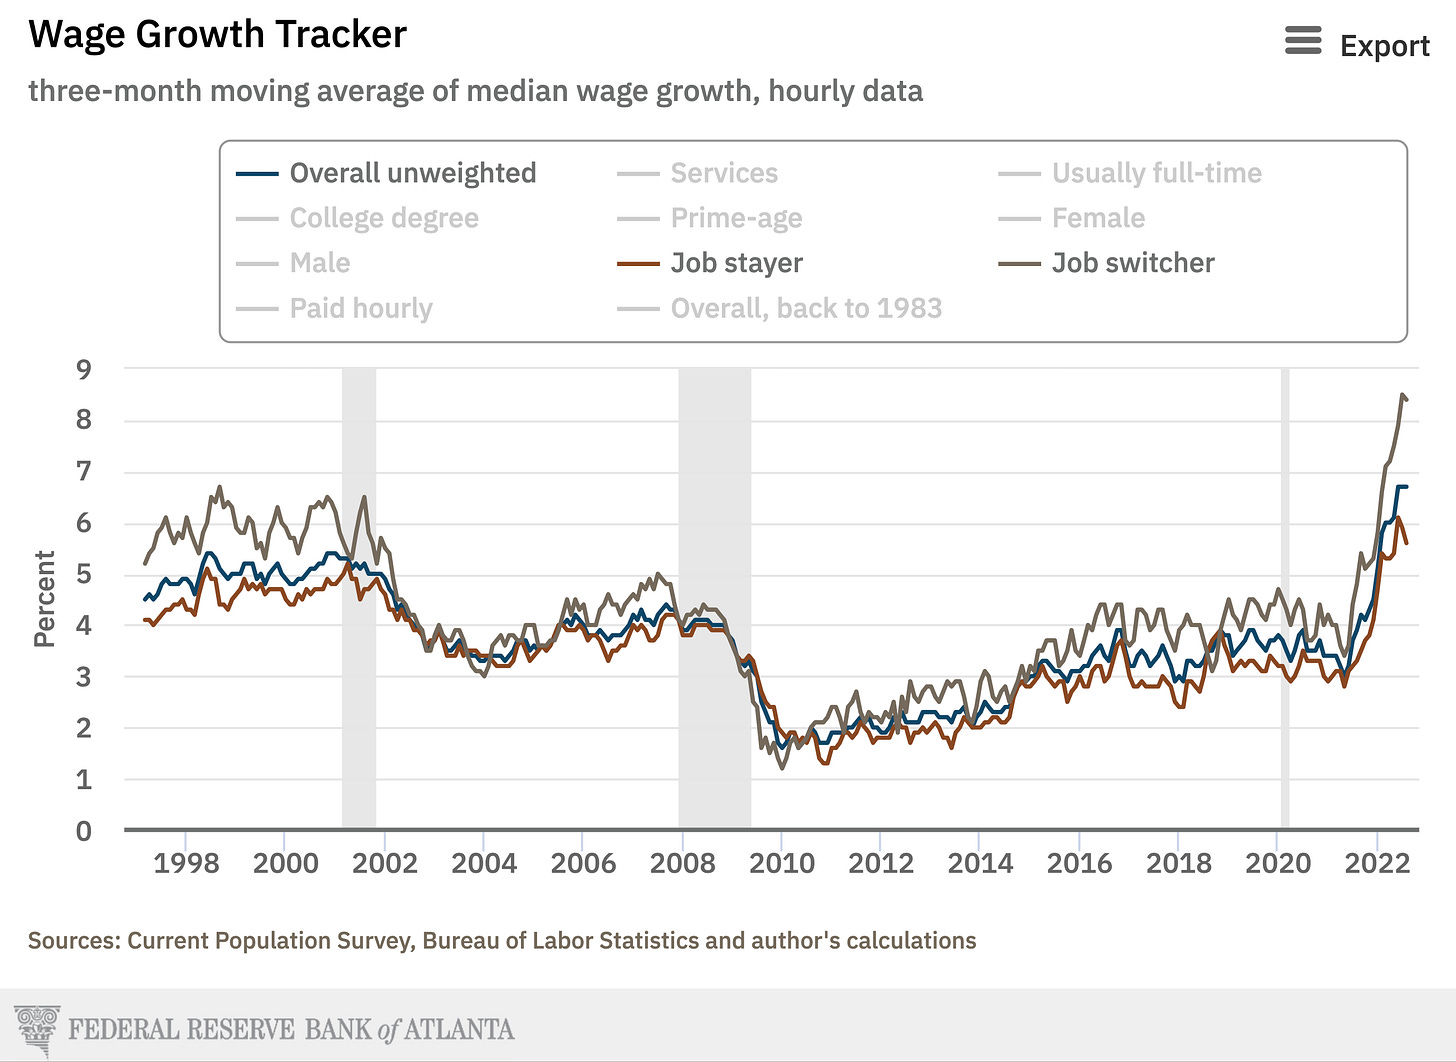
Regarding income, the Federal Reserve Bank of Atlanta updated their Wage Growth Tracker for the month of August. This latest observation confirmed that nominal wages continue to rise at an elevated pace!
On the aggregate, the overall unweighted pace of wage growth was +6.7% on an annualized three-month basis. This was the third consecutive month of +6.7% growth, indicating that wages are consistently on the rise. For context, the result in August 2021 was +3.9% and the pre-COVID result in August 2019 was +3.7%.
I’ve also highlighted the divergence between job switchers and job stayers, because I think this ties perfectly into the emphasis that I’ve placed on the historically elevated quits rate. For the month of August 2022, job switchers had median wage growth of +8.4% while job stayers had wage growth of +5.6%.
We’re continuing to see this dislocation grow, as the respective figures in June 2022 were +7.9% and +6.1% (a spread of 1.8% vs. the current spread of 2.8%). With the quits rate being 2.7% as of the most recent data in July 2022, this highlights a few things:
The labor market still has a labor shortage problem. In order to fill open positions, employers are having to entice potential employees to leave their existing positions by offering higher wages/salaries, more benefits, and better opportunities. As such, employers are offering a premium wage to labor market participants.
Employees are being opportunistic, as they should be. Knowing that they can demand premium wages/salaries, the currently employed are recognizing that they can entertain new work opportunities. The high levels of inflation are certainly pushing employees to entertain these new opportunities, in order to maintain their purchasing power. As such, they’re taking advantage of the moment and accepting new positions at a historic pace. This creates a recursive feedback loop where high inflation pushes people to find higher salary opportunities. The increased input costs from higher labor expense therefore causes businesses to increase the price of their goods/services. Economists refer to this dynamic as the “wage-price spiral”.
As it pertains to the recession topic, the current pace of wage growth is indicative of a strong, dynamic, and resilient labor market. Despite softness that we’ve seen in terms of output and economic activity (GDP), nominal incomes are growing at a strong pace.
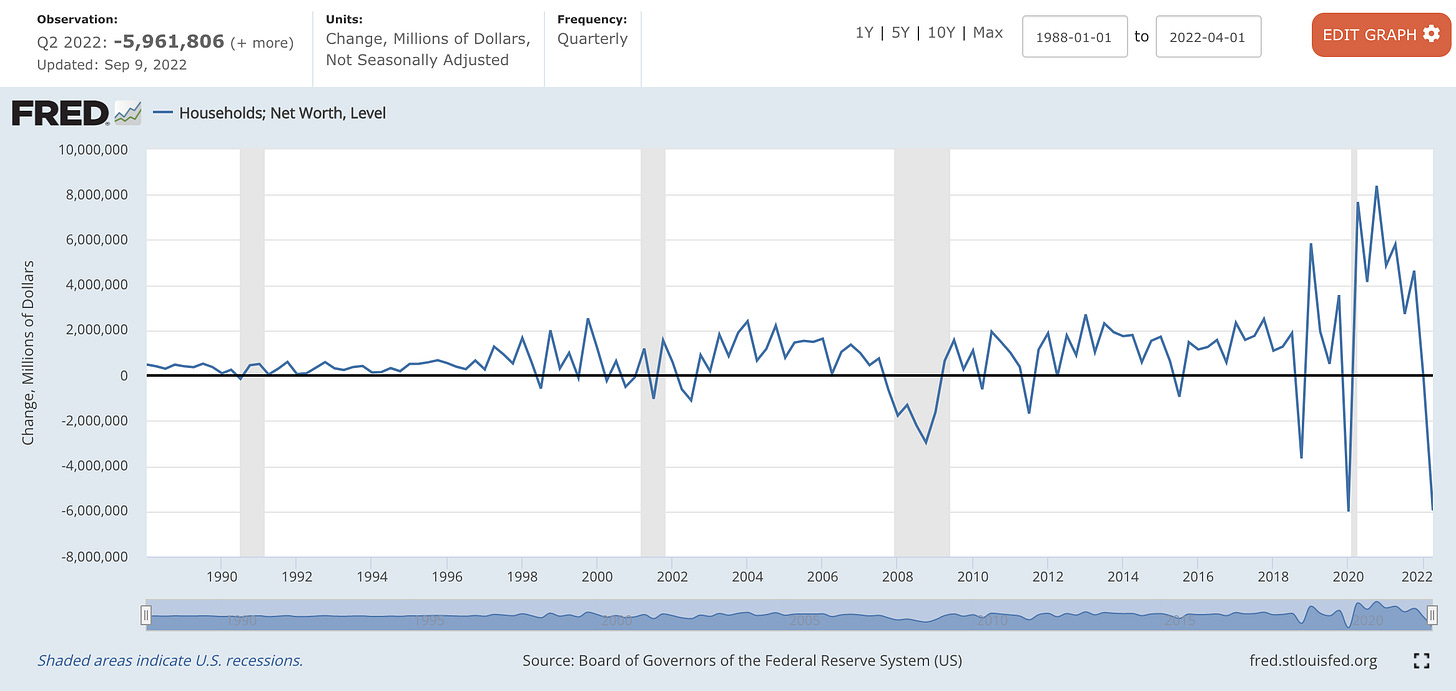
Switching to measures of wealth, we’re seeing a different picture relative to what income growth is showing us. Household net worth for Q2 2022 was reported to be totaled $135.7Tn, representing a sharp decline of -$5.96Tn relative to the Q1 2022 result, or a quarter-over-quarter decline of -4.2%.
Here is the result for total household net worth over time, highlighting the sharp decline that occurred in Q2.
Quite simply, the ongoing pressure across financial markets has caused net worth to plummet. In fact, the only quarter with a larger nominal decline was in Q1 2020 at -$6.008Tn:
While household net worth is still positive on a YoY basis, currently measured at +0.9%, this is likely due to flip negative if we continue to see pressure in the U.S. housing market. Based on the backtested research, each recession over the past 30+ years has been foreshadowed by a steep decline in household net worth, indicating that downward pressure in financial markets is a precursor for weakness in economic conditions.
Unequivocally, this data shows us that the Federal Reserve’s monetary tightening is working. The Fed has continuously stated their perspective that the current levels of high inflation are a result of high demand exceeding constrained supply. As such, they are trying to re-equilibrate the market at a lower price by reducing aggregate demand. One way to achieve this is via an inverse wealth effect, something that I briefly outlined in June:

Therefore, while we I don’t believe we are in a recession right now, I think that the U.S. economy is certainly trending towards a recession.
Stock Market:
While the Tuesday session was difficult to start the week, the stock market experienced a strong second-half of performance. From the market close on Tuesday, the S&P 500 gained +4.08% through Friday’s close. At the start of Tuesday’s session, I shared the following analysis on Twitter, highlighting the importance of where the market was trading at the time:
Sure enough, the S&P 500 SPY 0.00%↑ successfully rebounded within this key range and perfectly defended this important retest of potential support, generating a weekly return of +3.65%:
After a momentous defense, the stock market is attempting to produce a “higher low”, a key development to strengthen a bullish argument. In my August 27th note to investors, Edition #203, I shared an important reminder about market dynamics:
“Since the beginning of August, I shared my perspective that an eventual pullback will need to be defended by investors. What do I mean by “defend”? Quite simply, that the stock market indexes will need to produce a higher low relative to the June 2022 lows. I don’t care how deep the total drawdown is, all that matters is whether or not we can produce a higher low.”
While it’s certainly possible that this mid-week rally and potential higher low will fail, I think this is a major win for the bulls. Across the board, we’re seeing each of the stock market indexes develop in a similar bullish fashion.


We can’t know for certain if this will produce a sustainable local bottom, but hindsight will eventually be at our disposal to give us an answer. Either way, I think this price action increases the likelihood that the June 2022 lows are “the bottom”. Unfortunately, I can’t speak with conviction about whether or not the lows are absolutely in, as I will continue to analyze market outcomes in terms of percentages & likelihoods. There are still significant macro-related risks threatening the current price of financial assets, which can’t be ignored. The severity of these threats are certainly up for debate, including the likelihood that the threats materialize. However, at the present moment, it seems that there’s reason to celebrate in the stock market.
I’ll be discussing acute data and charts in tomorrow’s Premium Market Analysis, highlighting more dynamics that I think should be on your radar. If you’re not already subscribed, please consider upgrading your subscription to access this exclusive research:
Bitcoin:
The mid-week rally in financial assets was not exclusive to the stock market, as we saw a powerful move in the price of Bitcoin and across the broader crypto market. For example, Bitcoin’s daily candle for Friday produced a gain of +10.6% in a single session!
Very similar to the price structure we analyzed for the S&P 500, it appears that Bitcoin is also attempting to produce a higher low after rebounding from the $18.6k level. Currently priced at $21.3k at the time of writing, BTC has gained a respectable +14.9% since September 7th and +21.1% from the YTD lows in June 2022.
Still, the YTD performance for Bitcoin is an abysmal -53.8%, forcing current investors to reevaluate their conviction and potential investors to question if now is the time to begin investing in the digital asset. Much of the current crypto narrative is focused on Ethereum’s upcoming merge event, wherein the consensus mechanism will formally shift from proof-of-work to proof-of-stake. Considering that I’m an economist and investor, not a technologist, I’ll leave the details of this transition to people much smarter than me.
For those who are curious to dive into the merge, I found this video analysis to be informative:
Back to Bitcoin, I wanted to share an update on price structure by analyzing the following chart:
Notably, I want to highlight two key aspects:
I’ve added the 200 day exponential moving average (blue) and the 200 day simple moving average (yellow). Over the past 18 months, we’ve seen this moving average cloud act as dynamic support and resistance. Though it hasn’t been a perfect level of support/resistance, we can certainly recognize that price uses this range effectively within a small degree of error. At the present moment, the moving average cloud is valued at $28.75k-$30.25k, indicating that Bitcoin has room to rise before hitting this dynamic resistance level.
Note the price structure highlighted by the green trendlines and red rectangles that have formed since the bull market peak in Q4 2021. This price structure represents the new consolidation zones that eventually fail and begin the new extension lower. In each breakdown below the green trendlines, price continues to bleed lower. However, in the current scenario, we’re starting to see Bitcoin retrace back to the green trendline. This did not occurred in the two prior scenarios, possibly hinting that the Bitcoin is attempting to regain upside momentum. There’s a lot of work that must be done, but the development of a higher low relative to the June 2022 lows is increasing bullish outcomes.
While I still see risks to the downside, I think we’re seeing constructive developments across the crypto market that could be setting the stage for another rally. Whether or not that rally is a relief rally (bear market rally that fails to produce a sustainable bottom) or a bull market continuation, I can’t say for certain. As always, I’ll remain flexible based on new data and aim to provide objective & actionable analysis.
Nonetheless, my long-term conviction in Bitcoin has been unfazed throughout this bear market.
Best,
Caleb Franzen
DISCLAIMER:
My investment thesis, risk appetite, and time frames are strictly my own and are significantly different than that of my readership. As such, the investments & stocks covered in this publication are not to be considered investment advice and should be regarded as information only. I encourage everyone to conduct their own due diligence, understand the risks associated with any information that is reviewed, and to recognize that my investment approach is not necessarily suitable for your specific portfolio & investing needs. Please consult a registered & licensed financial advisor for any topics related to your portfolio, exercise strong risk controls, and understand that I have no responsibility for any gains or losses incurred in your portfolio.


