Investors,
This past week, I had the opportunity to write a guest post for Anthony Pompliano’s The Pomp Letter and published “The Key Data Driving Monetary Policy, Yields & Asset Markets”:
This was an amazing chance to reach a significantly larger audience, with a distribution list of 220,000+ readers. If you haven’t had a chance to check it out, I’m confident that you’ll enjoy it! Whether you’ve been a subscriber to Cubic Analytics for one week or one year, thank you for your support!
Macroeconomics:
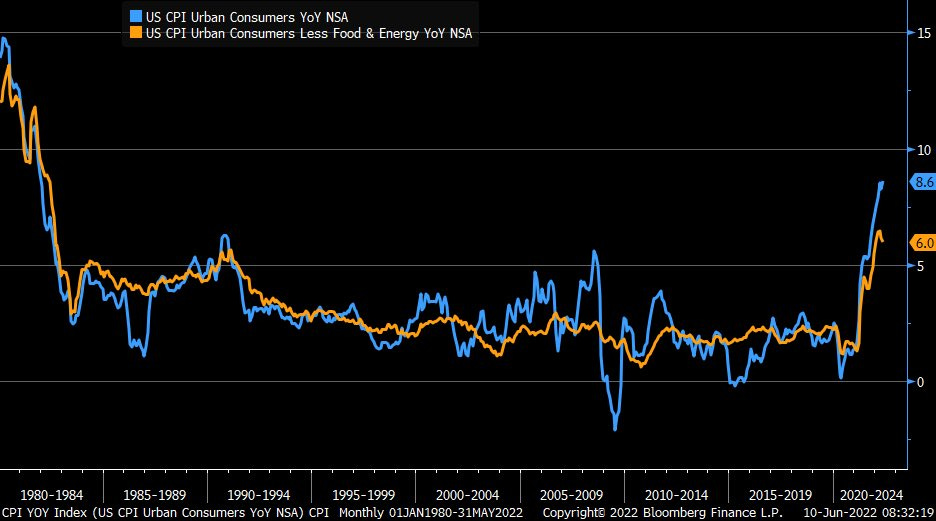
Yesterday’s release of the May 2022 CPI was arguably one of the most highly anticipated data releases I can remember. The “inflation is transitory” camp has been invigorated over the past few months, seeing the YoY CPI inflation rate fall from +8.5% in March to +8.3% in April. They’ve cited that the MoM inflation rate has stabilized and that the annualized 3-month PCE inflation rate has been slowing down.
I’ve heard these opinions loud & clear, although I’ve vehemently disagreed with them. In Edition #177, I discussed how deceleration ≠ decrease. I used the following analogy to highlight how a decrease in the rate of change (deceleration) is not equivalent to inflation decreasing:
“When a car is going 80mph on the freeway and the driver slows down to 65mph when they see a police officer ahead, the car is still going 65mph forward. Clearly, they had to decelerate (a term that intrinsically measures rate of change) from 80 → 65mph, but the car is still progressing in a forward manner during the deceleration period.”
The recent “slowdown” we’ve seen merely shows that the rate of change is decreasing, although inflation is still increasing.
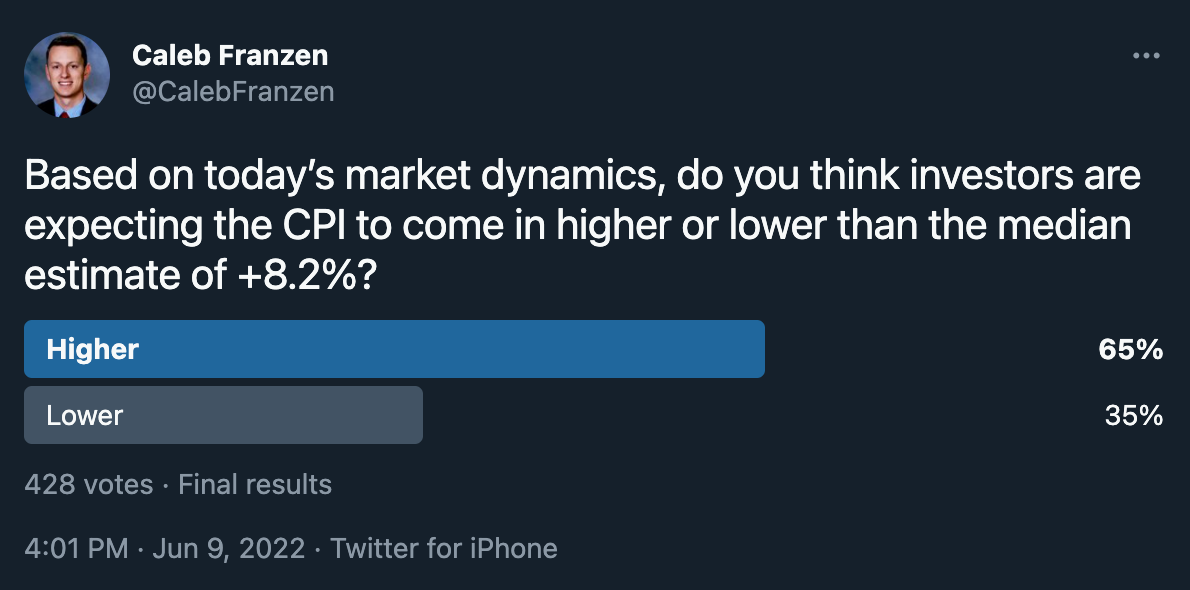
Earlier in the week, median estimates for the May 2022 CPI forecasted a YoY inflation rate of +8.2%, which would have been a slight decrease from April’s +8.3%. On Thursday afternoon, stocks & bonds had a terrible performance, almost as if the smart money was betting on higher-than-expected inflation on Friday morning. I ran a poll on Twitter to measure the sentiment of investors shortly after Thursday’s close:
It seems that retail & institutional investors alike both sensed that inflation would come in hot. They were right…
The May 2022 headline CPI was +8.6% on a year-over-year basis, the highest since December 1981. The month-over-month increase was +1.0% vs. estimates of +0.7%. The core CPI, which excludes food & energy prices, rose at a pace of +6.0% and fell slightly from April’s +6.2% pace. Again, Team Transitory is highlighting this deceleration as a major win, but I think that’s ridiculous. David Rosenberg, of Rosenberg Research, posted the following on Twitter:
“When you strip out of the CPI all the items that are linked to energy (air fares, moving/freight, rental cars, delivery services, new and used vehicles), the core was +0.36% and the YoY steadied near 4%. The truth beneath the veneer.”
I have a lot of respect for David, who’s a veteran in economic research, but this analysis is extremely moot. It’s the equivalent of saying, “when you exclude all consumer prices from the Consumer Price Index, the core was ±0% and the YoY was also ±0%, so there’s nothing to worry about!”
As I’ve been saying, further inflationary pressures will put more pressure on the Fed to accelerate their monetary tightening and QT, therefore putting upward pressure on yields and the U.S. dollar. The relationship is simple:
Inflation ↑ = Yields ↑ = U.S. Dollar ↑ = Liquidity ↓ = Asset Prices ↓
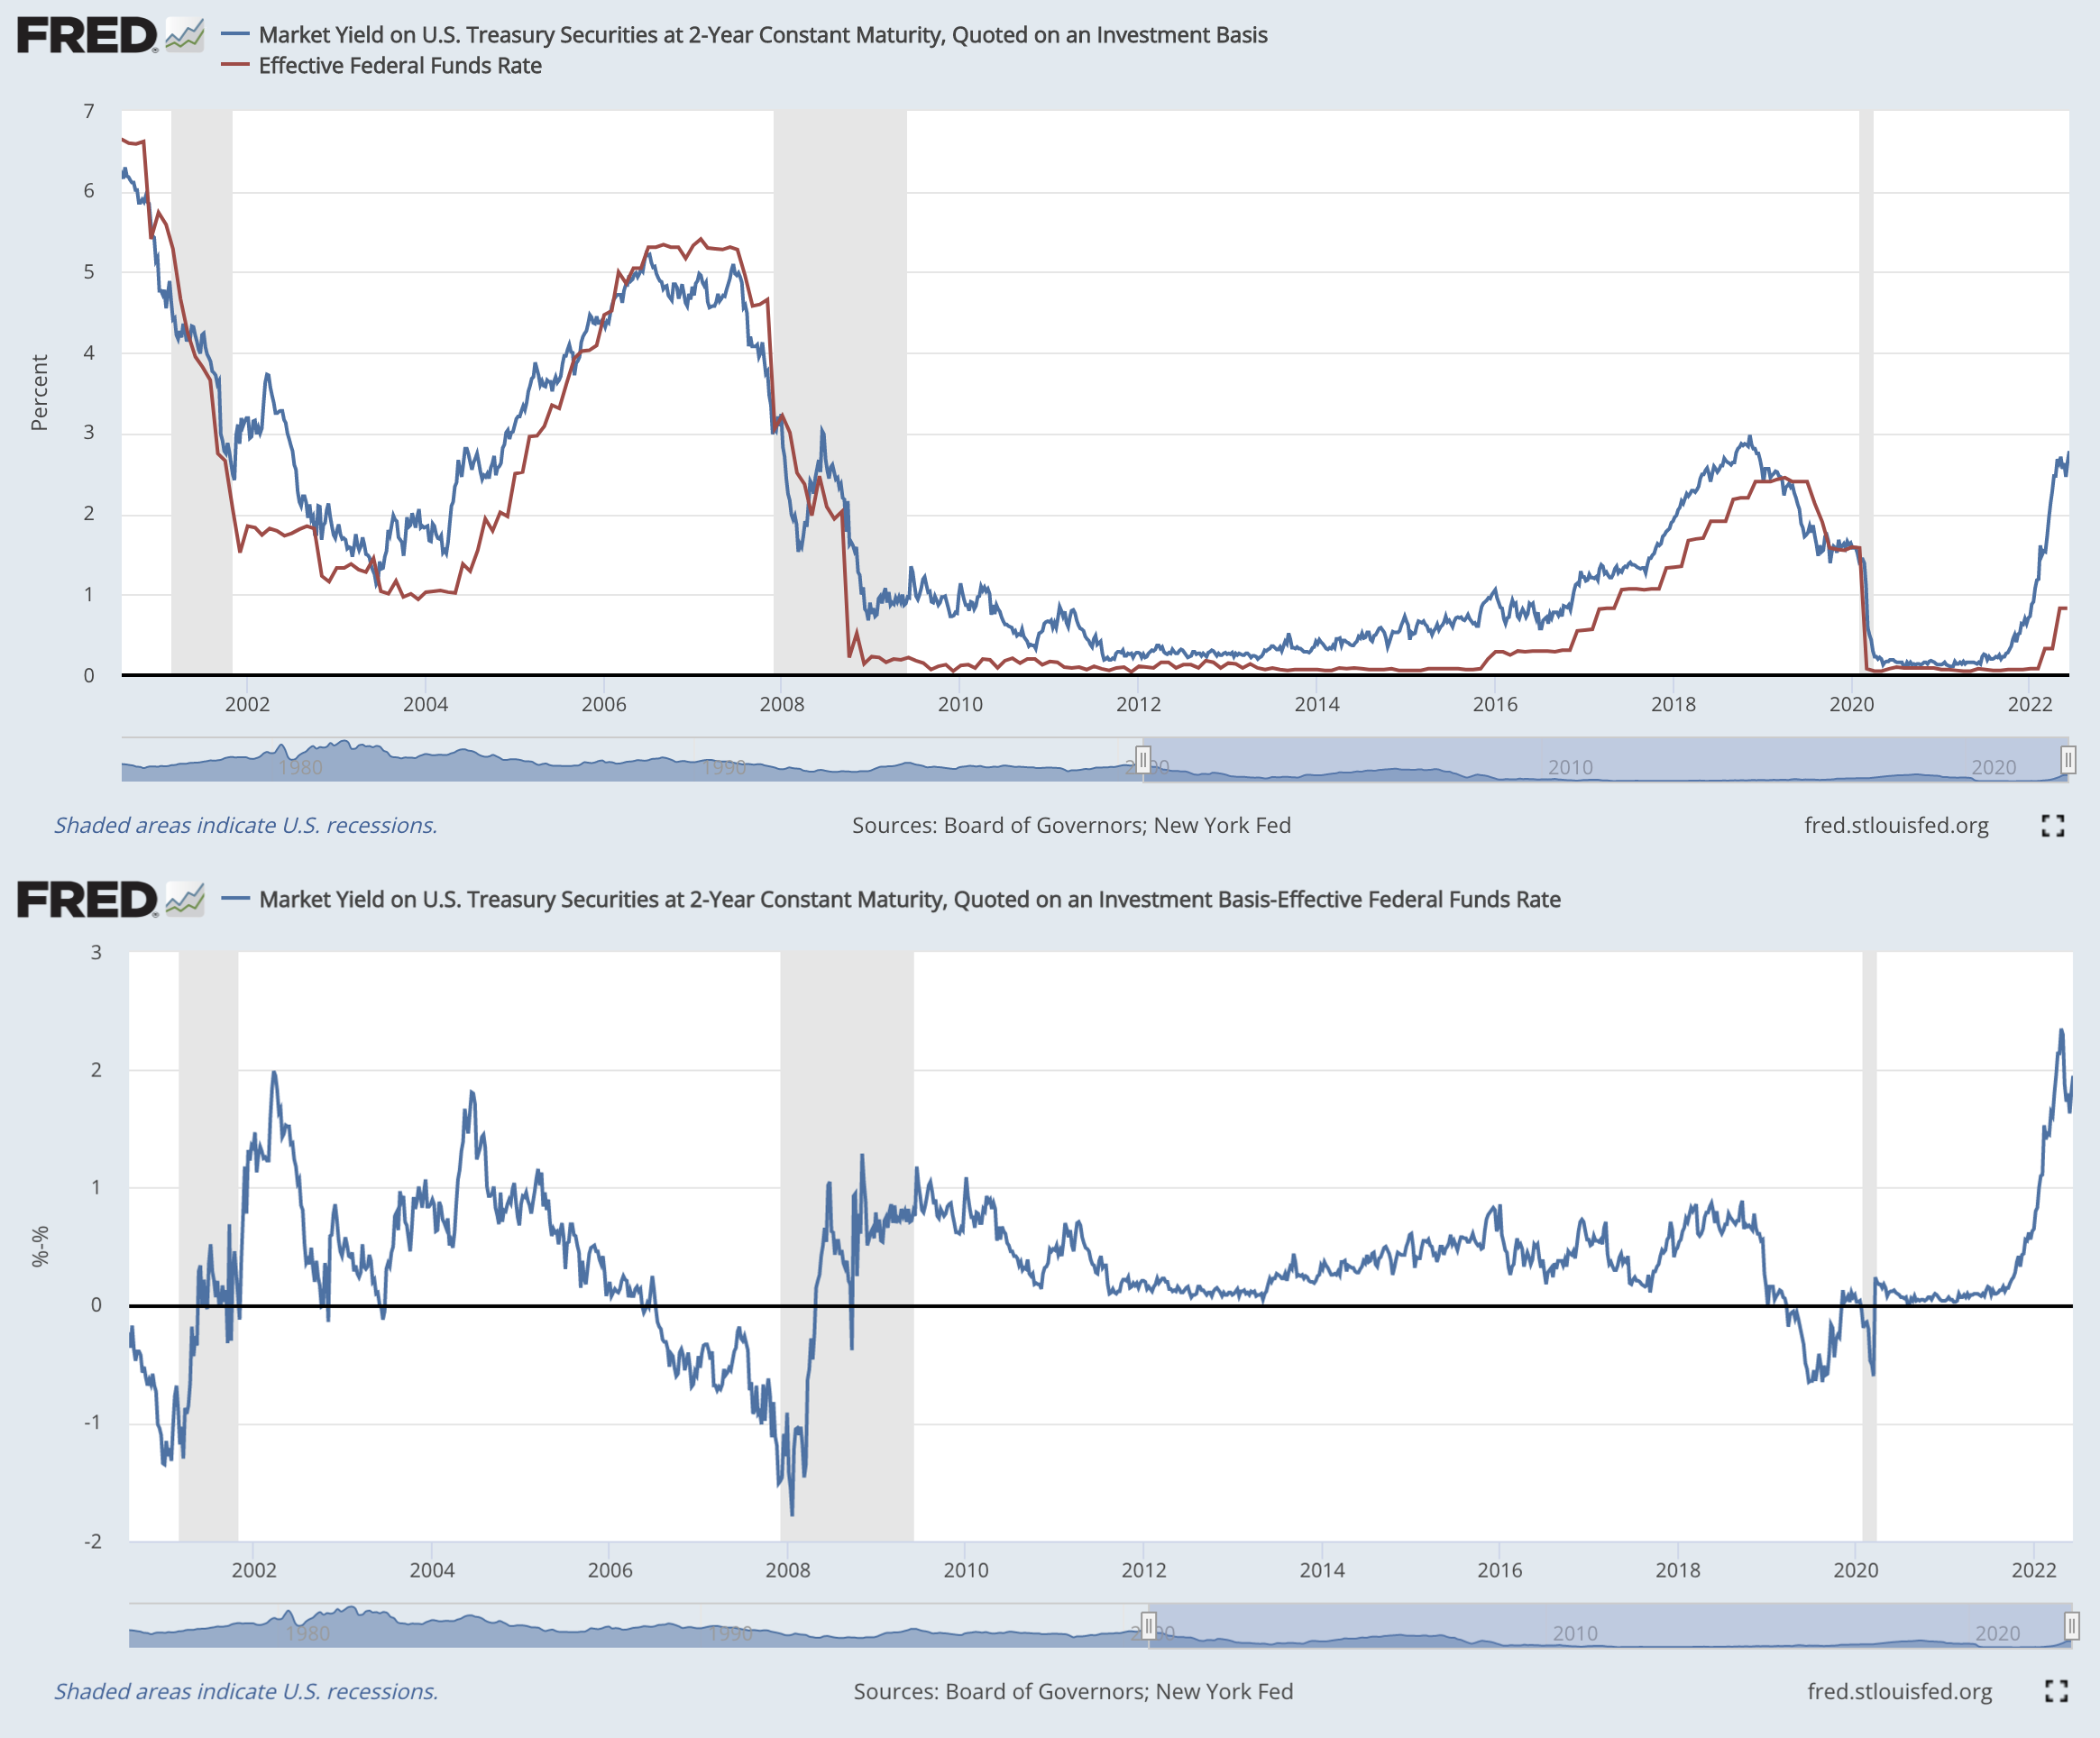
In response to the May 2022 CPI data, this is exactly what happened! 5 and 10-year Treasury yields launched higher, gaining +6.11% and +3.68%, respectively. The CPI acted as jet fuel for nominal 5-year yields, which have now blasted to new multi-year highs. As the data continues to evolve, it’s becoming increasingly evident that the Federal Reserve is behind the curve. Unquestionably so, as I’ve been highlighting for months. Below is the 2-year Treasury yield vs. the effective federal funds rate, with the spread between these variables shown in the lower-bound:
This chart quantifiably proves that the Federal Reserve is behind the curve. The spread between these two variables hit a series-high in April 2022, but then proceeded to decline for a month before accelerating higher again. Considering that the bond market can adjust faster than the Fed, I expect to see the spread hit new highs in the coming months. In turn, this will actually put even more pressure on the Fed to raise rates and combat inflationary pressures.
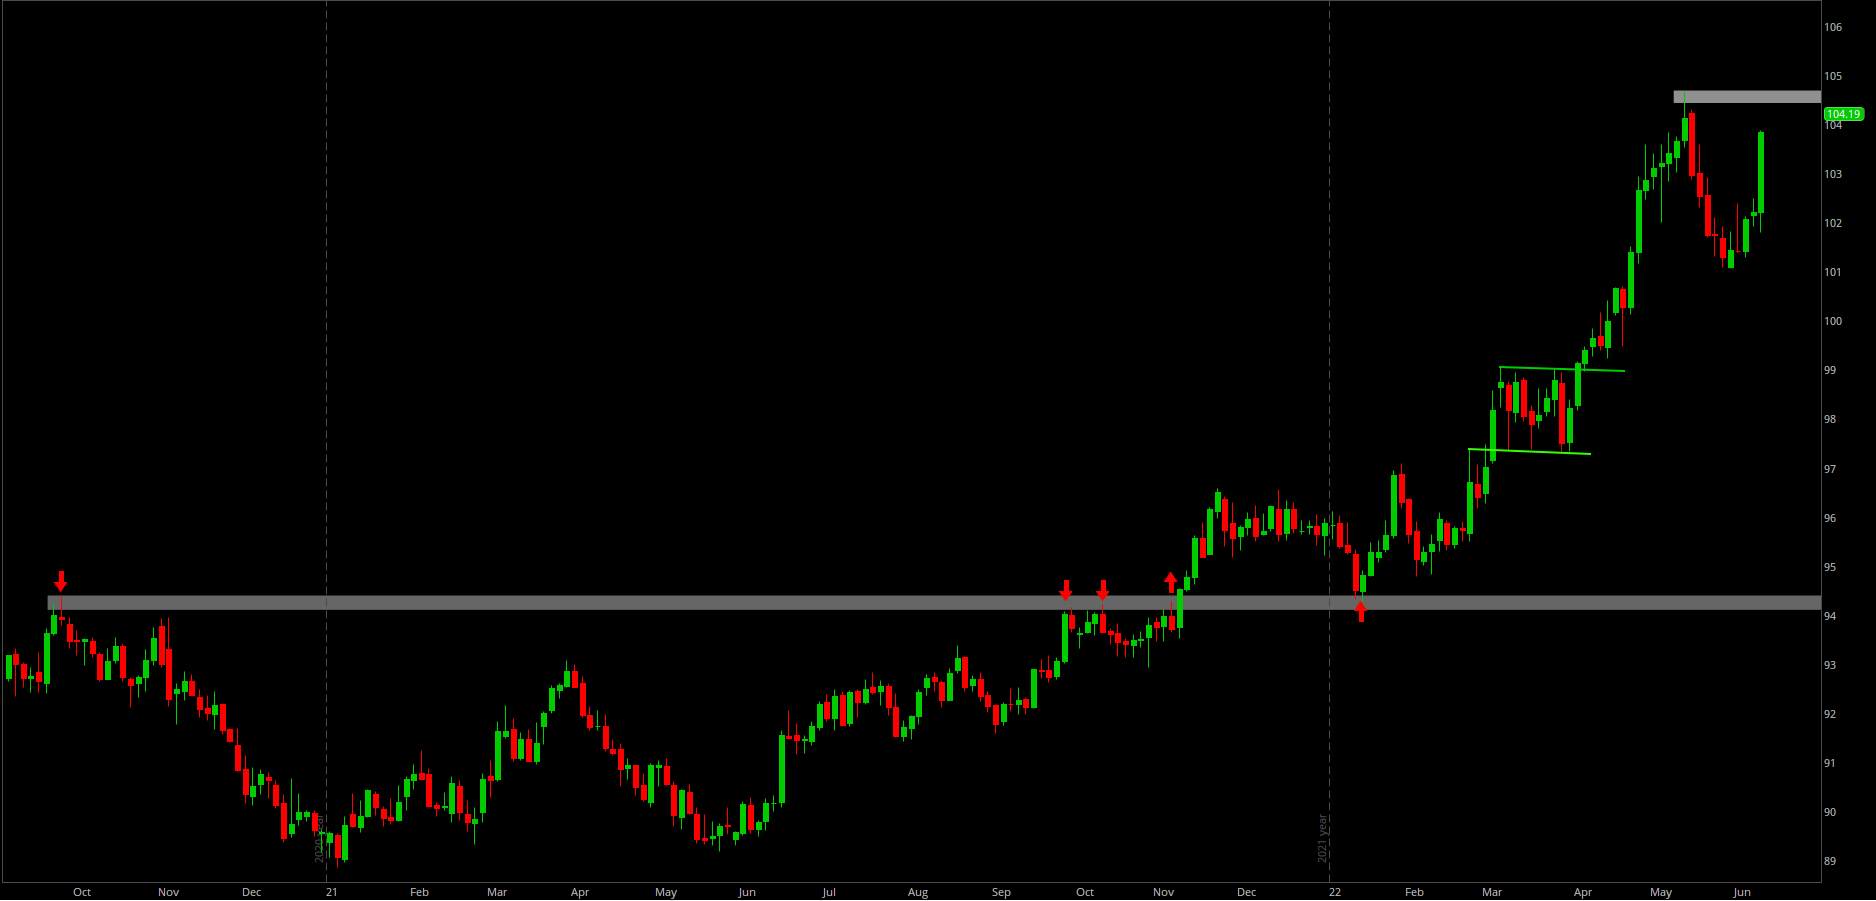
With the explosion in yields this past week, it’s important to recognize that the U.S. Dollar Index is also extending back to multi-year highs and the YTD peak:
With 2 & 5-year Treasury yields breaking above their YTD highs, I think those breakouts are foreshadowing an upcoming breakout for the USD.
Stock Market:
As I outlined in the section above, the theme for 2022 is:
Inflation ↑ = Yields ↑ = U.S. Dollar ↑ = Liquidity ↓ = Asset Prices ↓
With inflation hitting new highs, yields skyrocketing, and the dollar rising, asset prices faced more downward pressure this week. Each of the major U.S. indexes had a negative weekly performance:
Dow Jones Industrial Average $DJX: -4.6%
S&P 500 $SPX: -5.1%
Nasdaq-100 $NDX: -5.7%
Russell 2000 $RUT: -4.4%
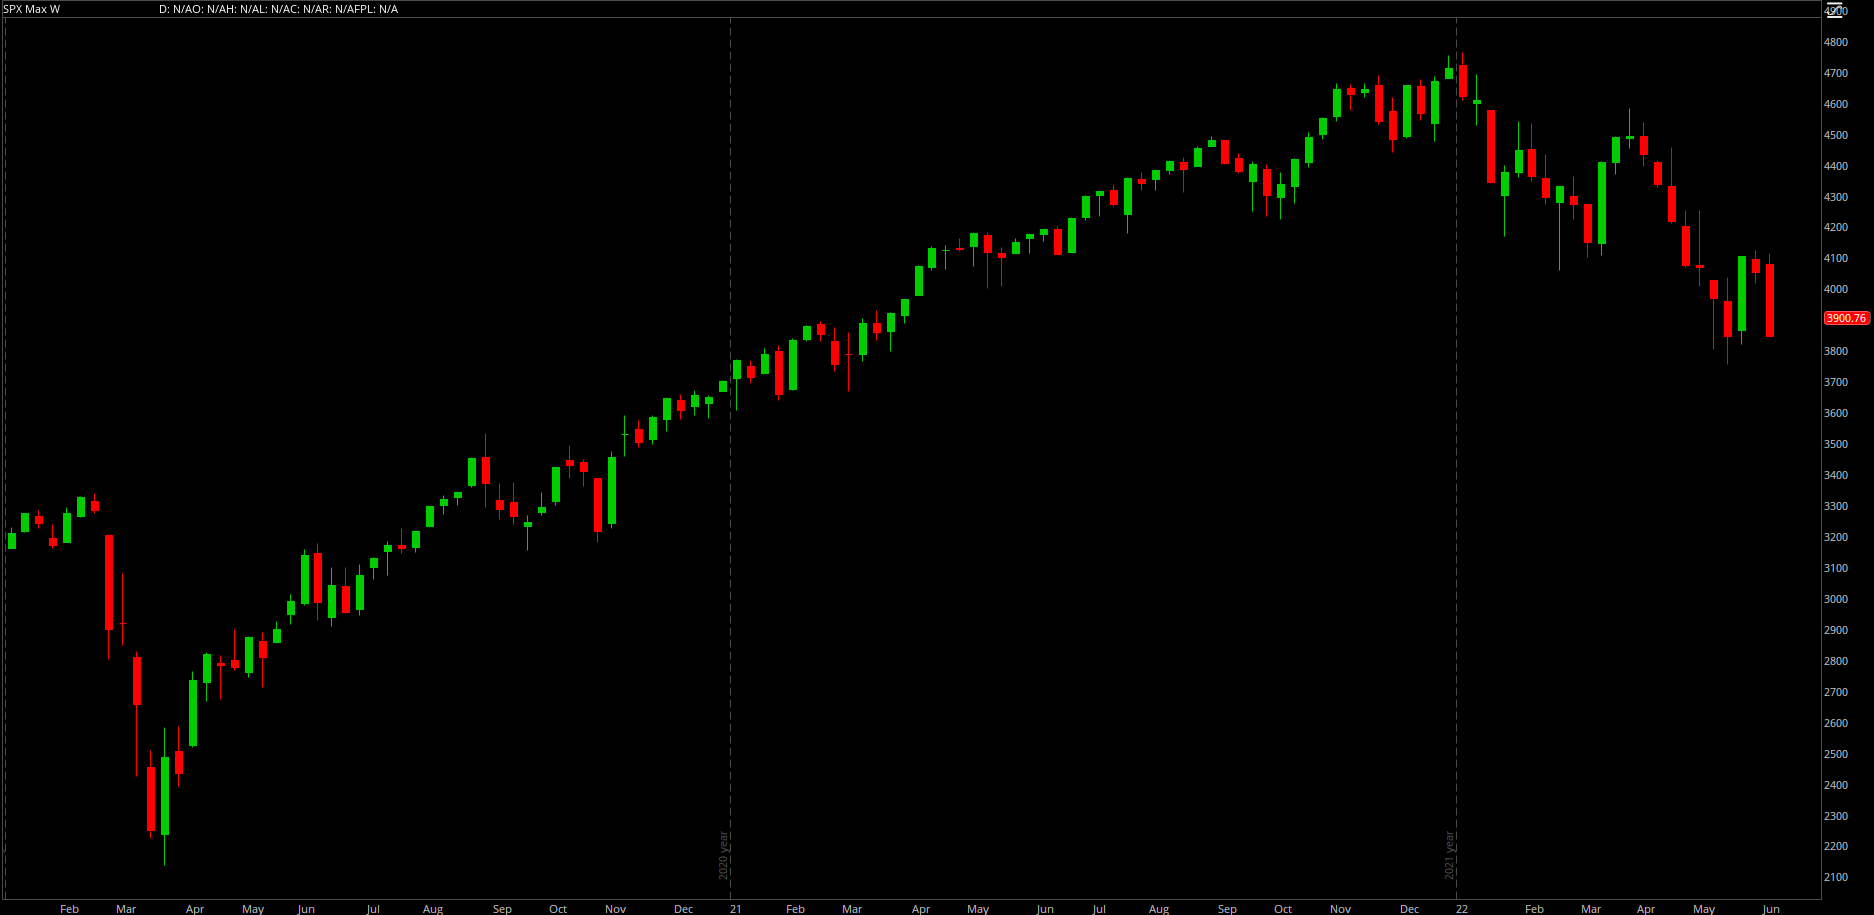
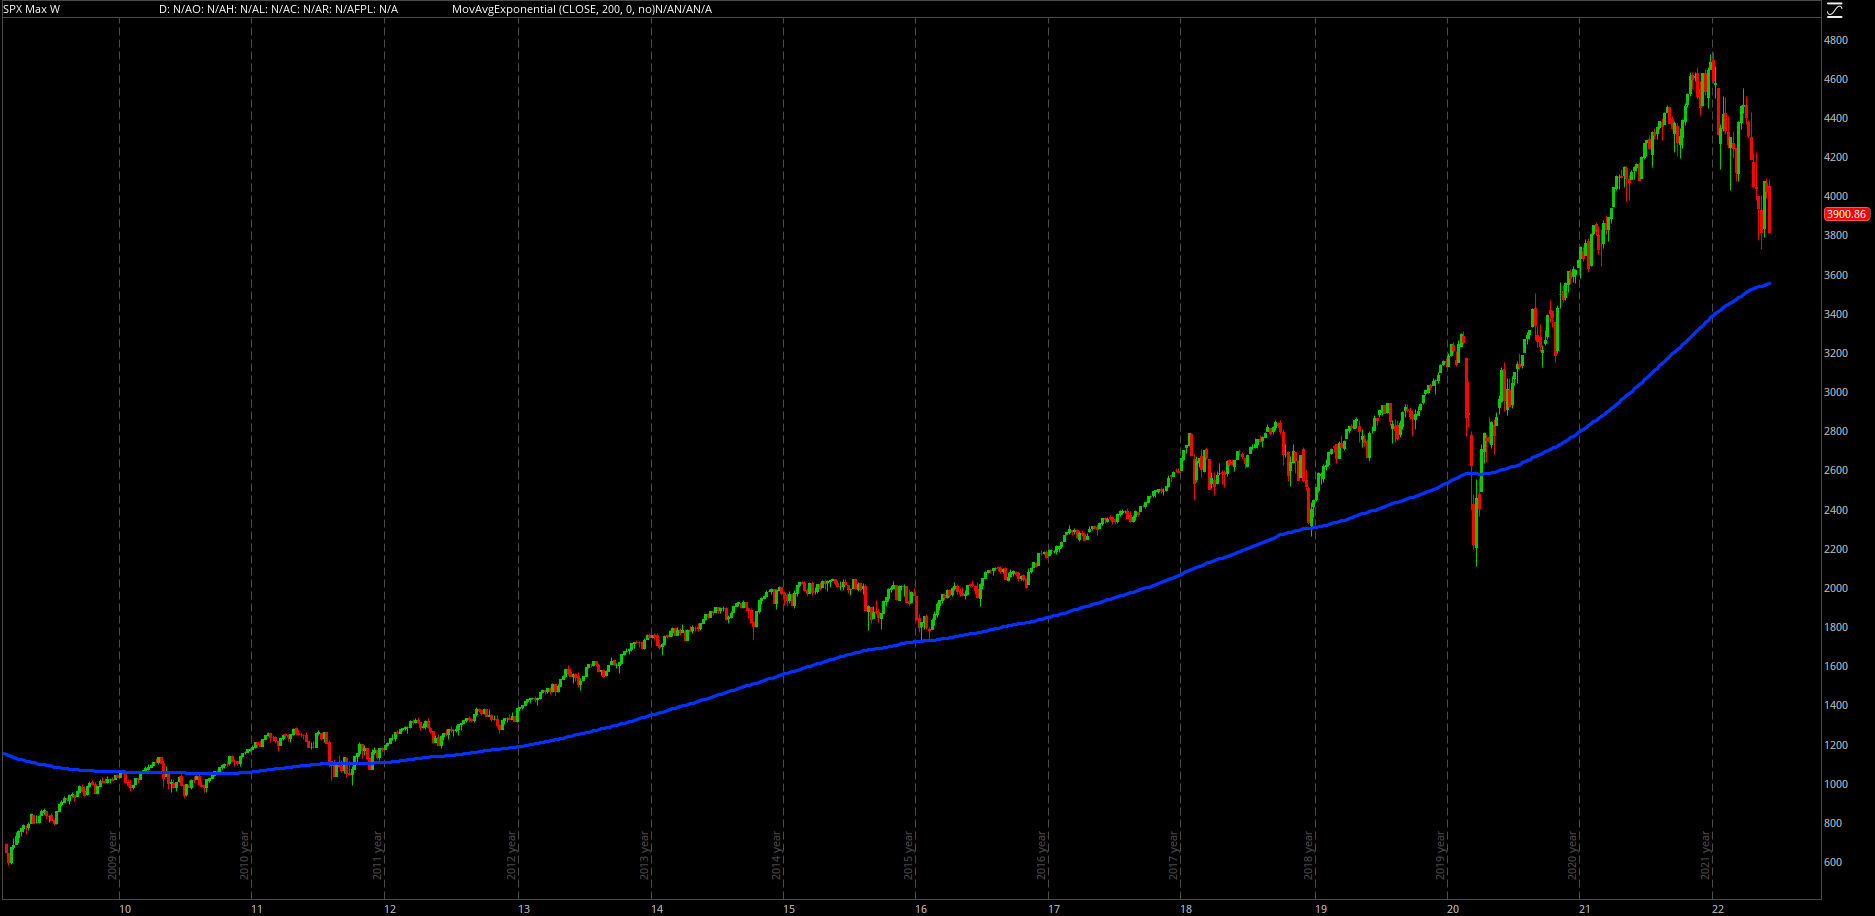
This continues to a tech-centric selloff, with consumer discretionary stocks also taking a beating. For the S&P 500 and the Nasdaq-100, this was the worst weekly performance since the week ending January 21, 2022. The chart of the S&P 500 is certainly dreary at these levels, particularly with the index closing at the weekly lows:
Premium members know that I’ve been calling for a retest of the 200-week EMA since February & March, which is currently around $3,638. Why the 200-week EMA? Since the Great Recession lows, this has been a mean-reversion magnet, with retests in 2011, 216, 2018, and 2020:
In 2011 & 2020, the S&P 500 fell below the 200-week EMA while the 2016 & 2018 retests marked the lows. That’s been my base case scenario since March, when I published Edition #159:
“In the current situation, the S&P 500 would need to fall -15% in order to retest the 200-week EMA. Of course, this will adjust over the coming weeks as the EMA continues to evolve based on the future price action of the index. Therefore, I reasonably think the S&P 500 could fall an additional -10% to -13% over the next 4-20 weeks.”
So far, we’re on pace for that prediction.
In this environment, I expect to see value, defensives, and commodity-related stocks outperform the broader market in the intermediate term.
Bitcoin:
Continuing along the theme of: Inflation ↑ = Yields ↑ = Asset Prices ↓, crypto will likely face even more pressure than stocks. However, there is still relative value within crypto and defensive assets that will likely outperform the rest of crypto.
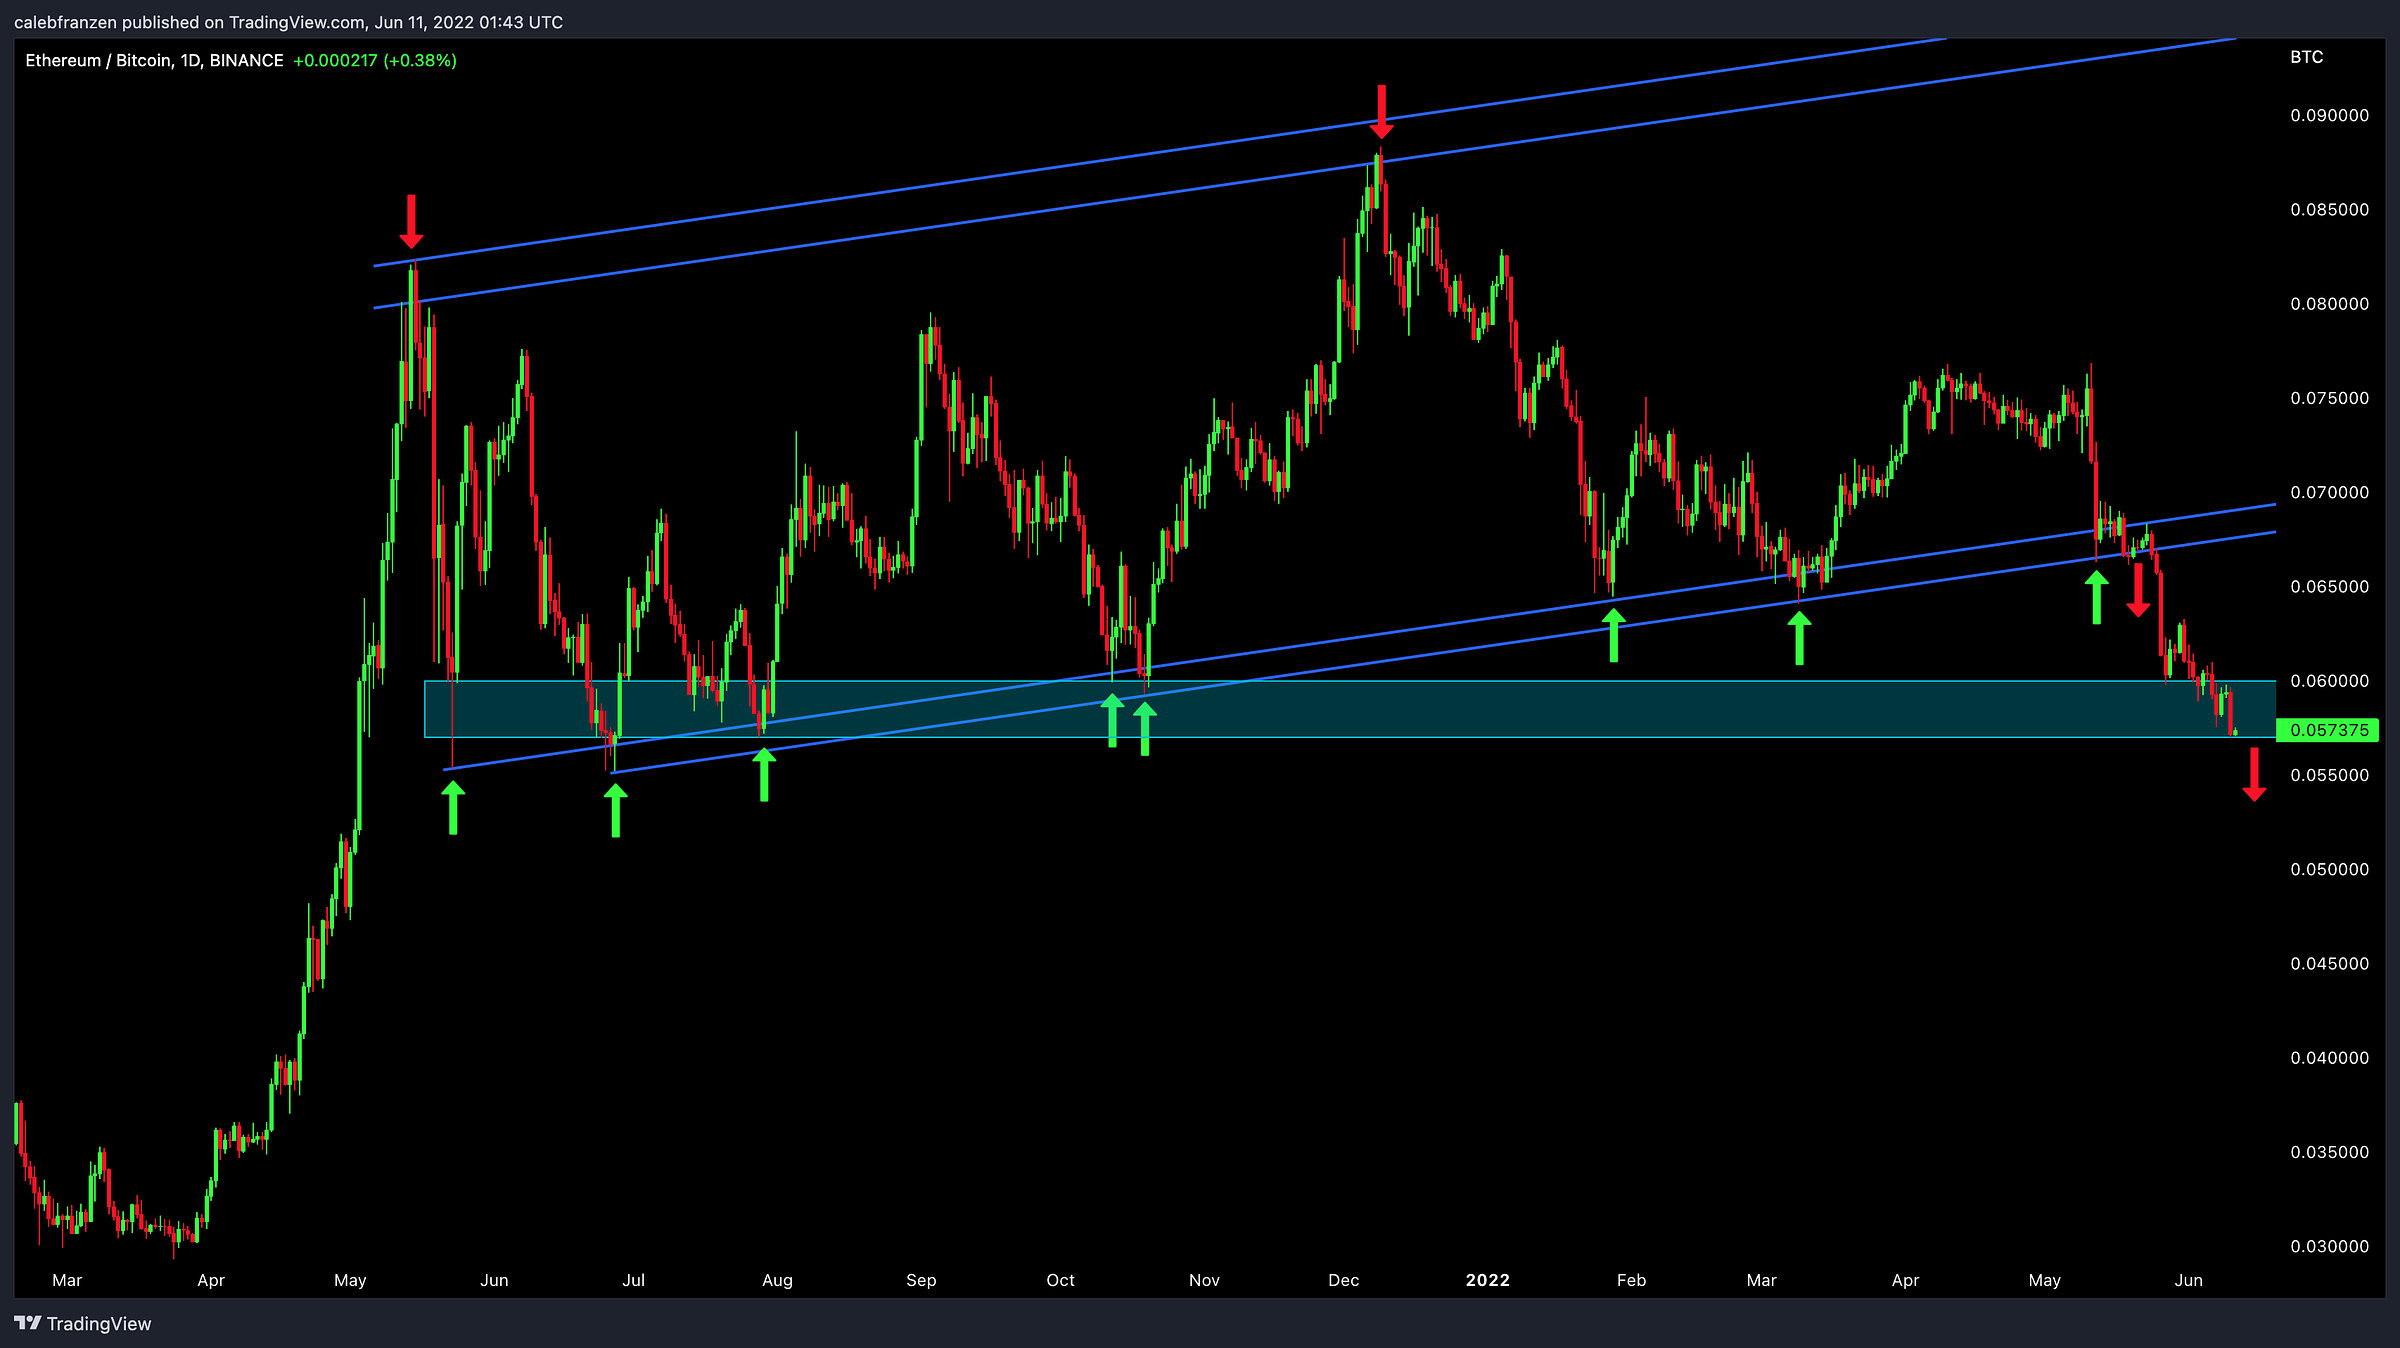
Below is the chart of Ethereum/Bitcoin, helping to highlight the relative performance of the two most valuable digital currencies:
After breaking below the blue channel, which I was warning about in May, $ETHBTC looks poised to break below the teal support range as well. As I write this at 9:45pm ET on Friday night, I think it’s likely we see a breakdown this weekend. If/when we do, this will symbolize an important deterioration of risk appetite within crypto. During defensive market cycles, when ETH/BTC is falling, investors shift their portfolios away from L1’s and altcoins in favor of Bitcoin.
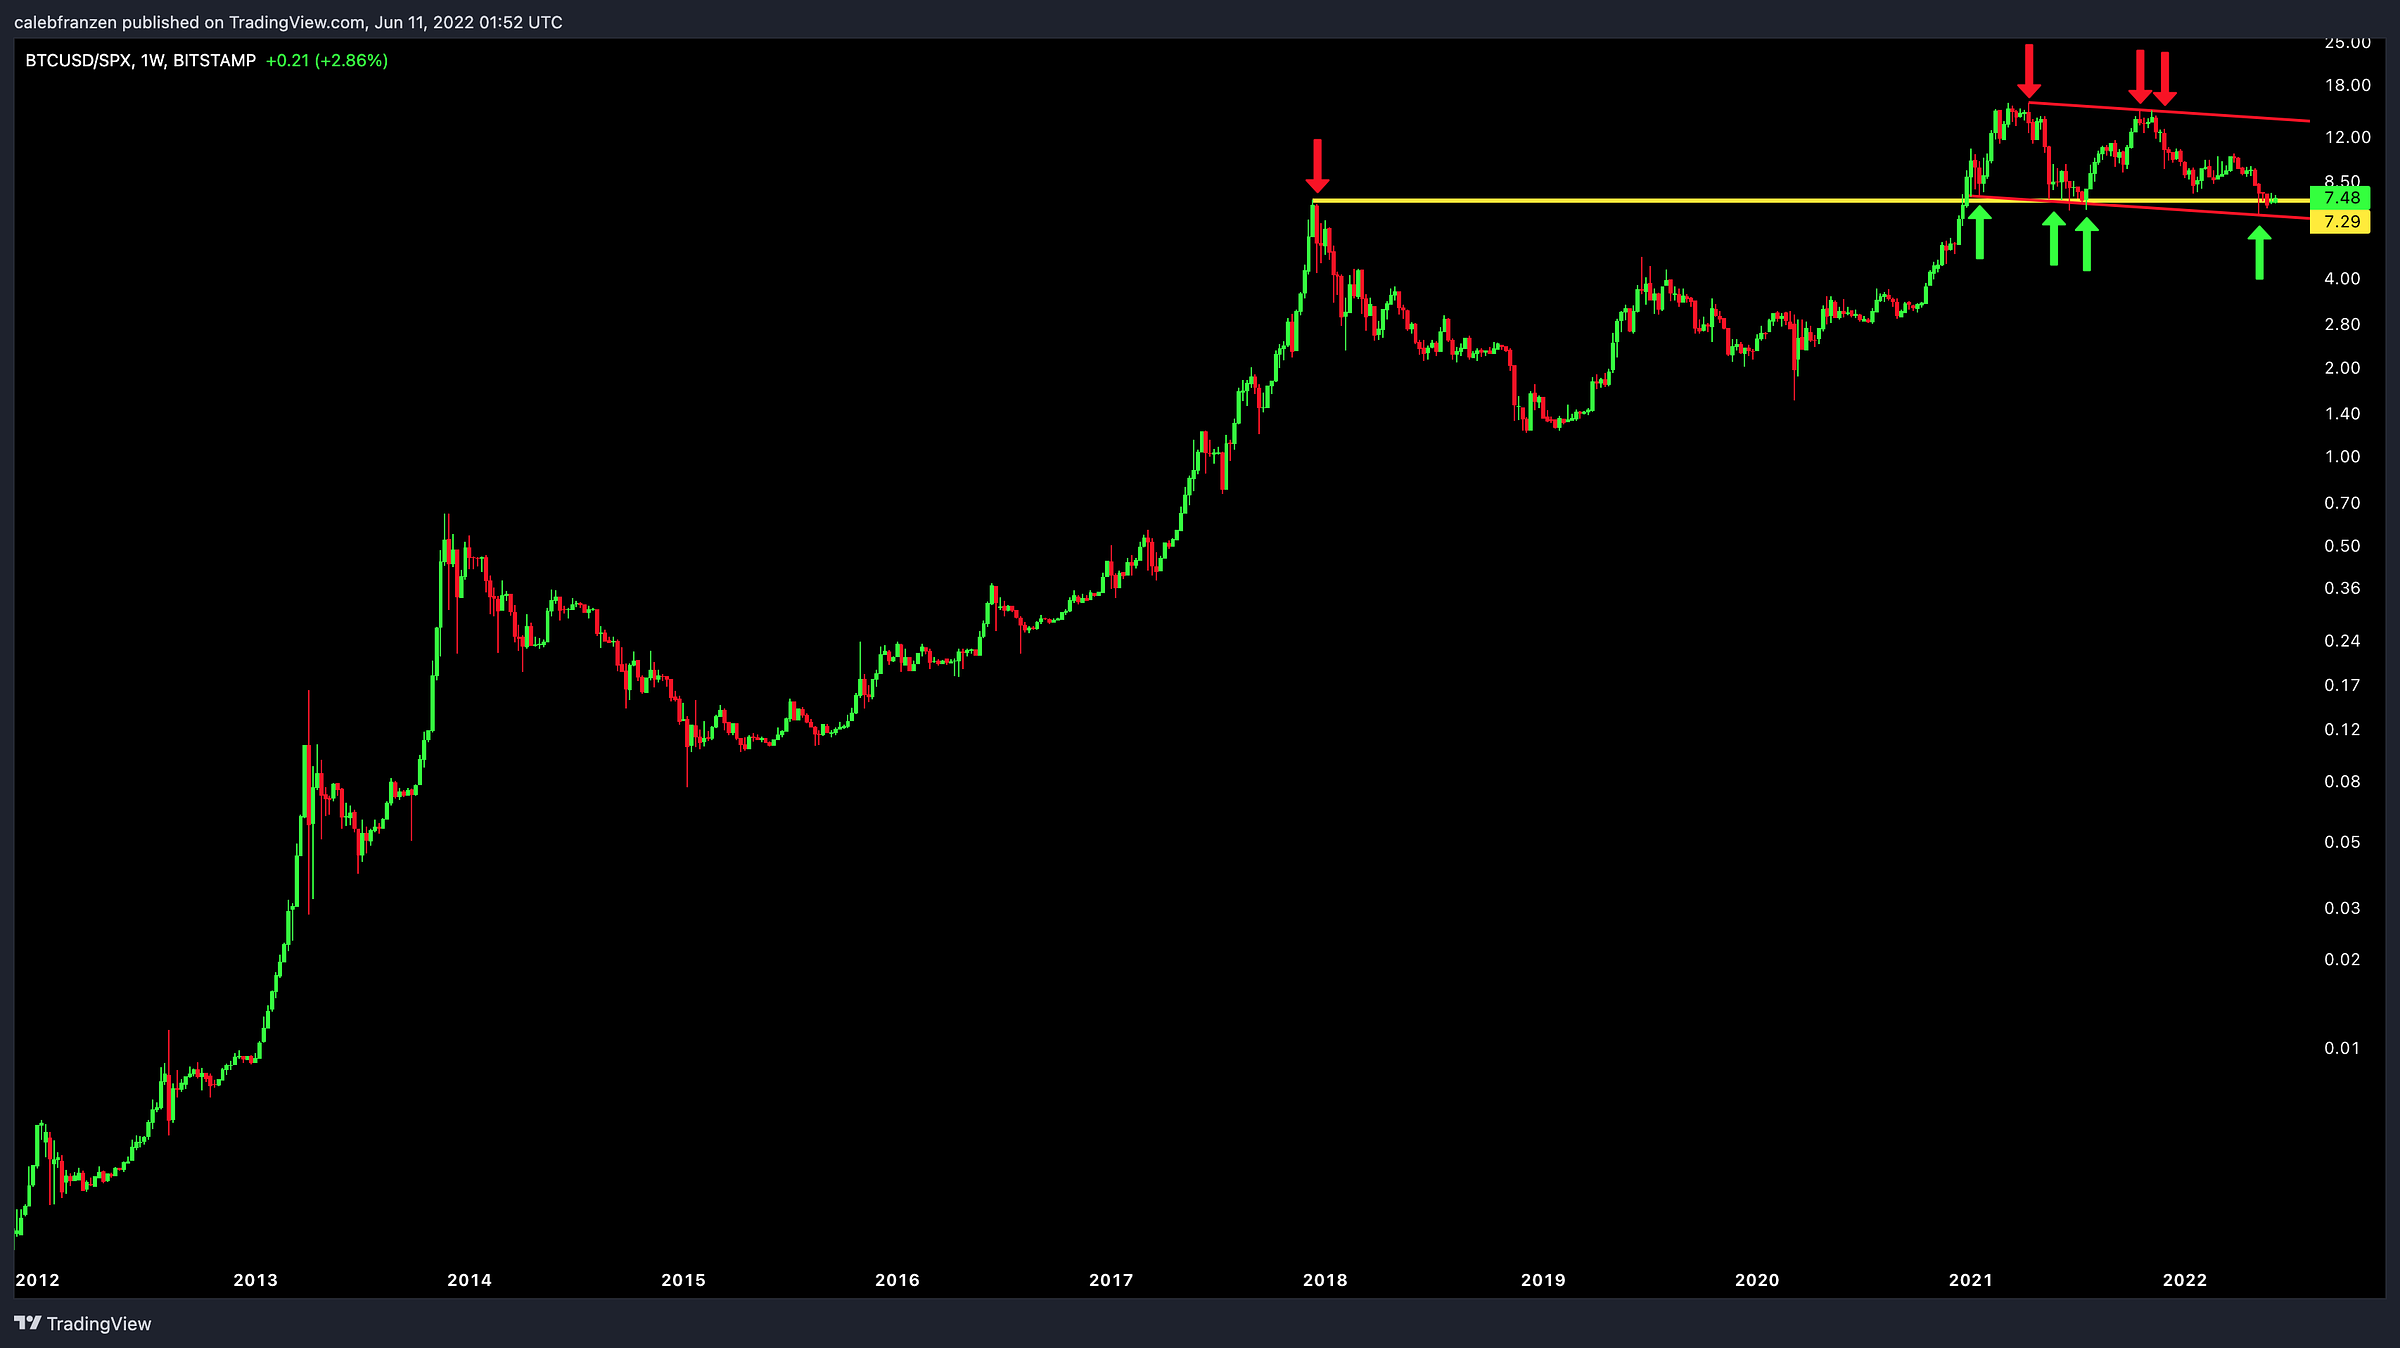
While I generally expect to see crypto underperform the stock market, I expect to see Bitcoin outperform the broader crypto market. With that said, we can also compare Bitcoin to the S&P 500 in order to determine relative value. Zooming out over the past 10 years:
BTC/SPX is currently retesting the 2017 highs, but moving within a parallel red channel. This is a potential support zone that investors should be aware of; however, it will be very concerning if we do break below this range. If/when that breakout happens, it would reflect a shift in investor appetite away from Bitcoin and into less risky assets like stocks.
Talk soon,
Caleb Franzen
DISCLAIMER:
My investment thesis, risk appetite, and time frames are strictly my own and are significantly different than that of my readership. As such, the investments & stocks covered in this publication are not to be considered investment advice and should be regarded as information only. I encourage everyone to conduct their own due diligence, understand the risks associated with any information that is reviewed, and to recognize that my investment approach is not necessarily suitable for your specific portfolio & investing needs. Please consult a registered & licensed financial advisor for any topics related to your portfolio, exercise strong risk controls, and understand that I have no responsibility for any gains or losses incurred in your portfolio.


