Investors,
I want to use this newsletter as an opportunity to discuss the fundamental economic factors that are driving market dynamics, sentiment, and forward-looking expectations. Investors, both retail & institutional, are coming to the increasing realization that fundamentals impact financial markets at a varying degree at different times in the market cycle. In times of exuberance & excitement, macroeconomic dynamics are less important and investors focus on sector-based fundamentals or company-specific value drivers, if at all. In times of prudence, like the market environment since Q4 2021, the macroeconomic factors become increasingly important drivers of market activity, risk appetite, and sentiment.
One thing that remains consistent in both of these cycles is the importance of yields, monetary policy, and the impact of an expanding/contracting money supply. Recall the framework that I outlined in my “Investment Outlook for 2022”:
“One of my favorite quotes about investing is: ‘Don’t fight the Federal Reserve’. While it may seem elementary to use the Fed’s expected monetary policy actions as the guiding principle for my market outlook, it’s proved to be extremely effective. The rules of this framework are simple:
• Remain overweight U.S. equities and dollar-denominated assets in periods of monetary stimulus and expansion of M2.
• Shift towards caution as the Federal Reserve reduces their rate of asset purchases and begins to transition into a period of monetary tightening (stagnant/contracting M2).
• De-risk during periods of blatant monetary tightening, reducing exposure to tech and emphasizing strong cash flows, profitability, dividends, and share buybacks. Note that de-risk doesn’t mean to sell everything, but simply to shift allocations.
I believe we are currently in the second category, with a strong chance of entering the third category by the end of 2022. As a result of this framework, I’m reducing my optimism for U.S. stocks in 2022, most appropriately described as cautious optimism. In the event that monetary policy remains accommodative for longer than we currently expect, I believe asset prices could continue to generate stronger-than-expected returns. Conversely, if the Fed is forced to tighten monetary policy more hastily, caused by relentless inflationary pressures, I believe asset prices could face worse-than-expected returns.”
So far, this framework has been the guiding principle of market dynamics in 2022, one in which we’ve seen a dramatic shift from the second category to the third. At the time I wrote this analysis, towards the tail-end of December 2021, the market expected this shift to take place gradually and was only pricing in 2-3 rate hikes in 2022. As soon as February 2022, the market was pricing in 9 rate hikes.
That rapid shift, driven by a sustained increase of inflationary pressures, has caused investors to rely on economic data to forecast the Fed’s actions with respect to monetary policy. This brings me back to the initial point of this newsletter: it is becoming increasingly important to rely on fundamental economic data as a gauge for market dynamics in the present and in the future, so long as we remain in a monetary tightening regime.
This newsletter will serve as a deep-dive on recent economic data releases, focusing on the labor market, inflation, and general business activity. The analysis & commentary below is extremely thorough, exceeding the email limit for Gmail. If you’re attempting to read this in your email, please go directly to the Cubic Analytics Substack website to read the full analysis, completely for free.
Regarding the path of monetary policy, the Federal Reserve seems poised to conduct multiple consecutive +0.5% rate hikes to the federal funds rate (FFR) after conducting a 50 basis point hike in May 2022. While Raphael Bostic, the President of the Atlanta Federal Reserve, posited that a temporary pause of rate hikes in September 2022 might be appropriate, this notion was quickly dismissed by several Fed officials. With the release of several key data points, the market seems to have shrugged off these comments, adding credence to the aggressive rhetoric and path of monetary policy.
Recall, the Federal Reserve has a dual-mandate to foster:
Price stability;
Full/maximum employment.
It’s vital to recognize where the Fed stands with respect to these goals. Inflation is significantly above the Federal Reserve’s long-term target, while the labor market has been quite strong since August 2021 and continues to show resilience in the current economic environment. The resilience of the labor market reinforces the idea that the Fed’s top priority is to reestablish price stability and intentionally pump the brakes on the U.S. economy. In my opinion, so long as the labor market remains strong, the Fed will see a green light to raise interest rates.
As such, it’s critical to understand labor market data as the Fed continues to embark on their fight against inflation. Thankfully, plenty of new data has been released for us to review.
Labor Market Data:
Let’s begin with the Job Openings and Labor Turnover Survey (JOLTS) for April 2022, which was released on 6/1/22. The general takeaway from this report is that the labor market remains strong, illustrated by a significant level of demand for new workers. Employers seem less willing to layoff their existing labor force, likely due to ongoing struggles to find skilled labor at a reasonable price. Total layoffs were 1.2 million, which sounds like a shocking number until we contextualize it as a 0.8% layoff rate. This aggregate figure is a new series low, with total layoffs declining by 170,000 relative to March 2022.
On the aggregate, there were 6.6M total hires and total separations of 6M, of which 4.4M were people quitting their job. This broadly implies that net hiring activity in April 2022 was roughly +600,000 jobs. It’s also important to measure the net employment gain over a trailing twelve-month period, which this JOLTS report indicates is 6.4M jobs since April 2021. With this strong data in mind, it appears that employers have a high demand to expand their labor force, with 11.4M job openings at the end of the month. This means that there are roughly 1.9 jobs available for every unemployed person in the United States. This massive gap is indicative of an extremely dynamic labor market, with ample opportunities.

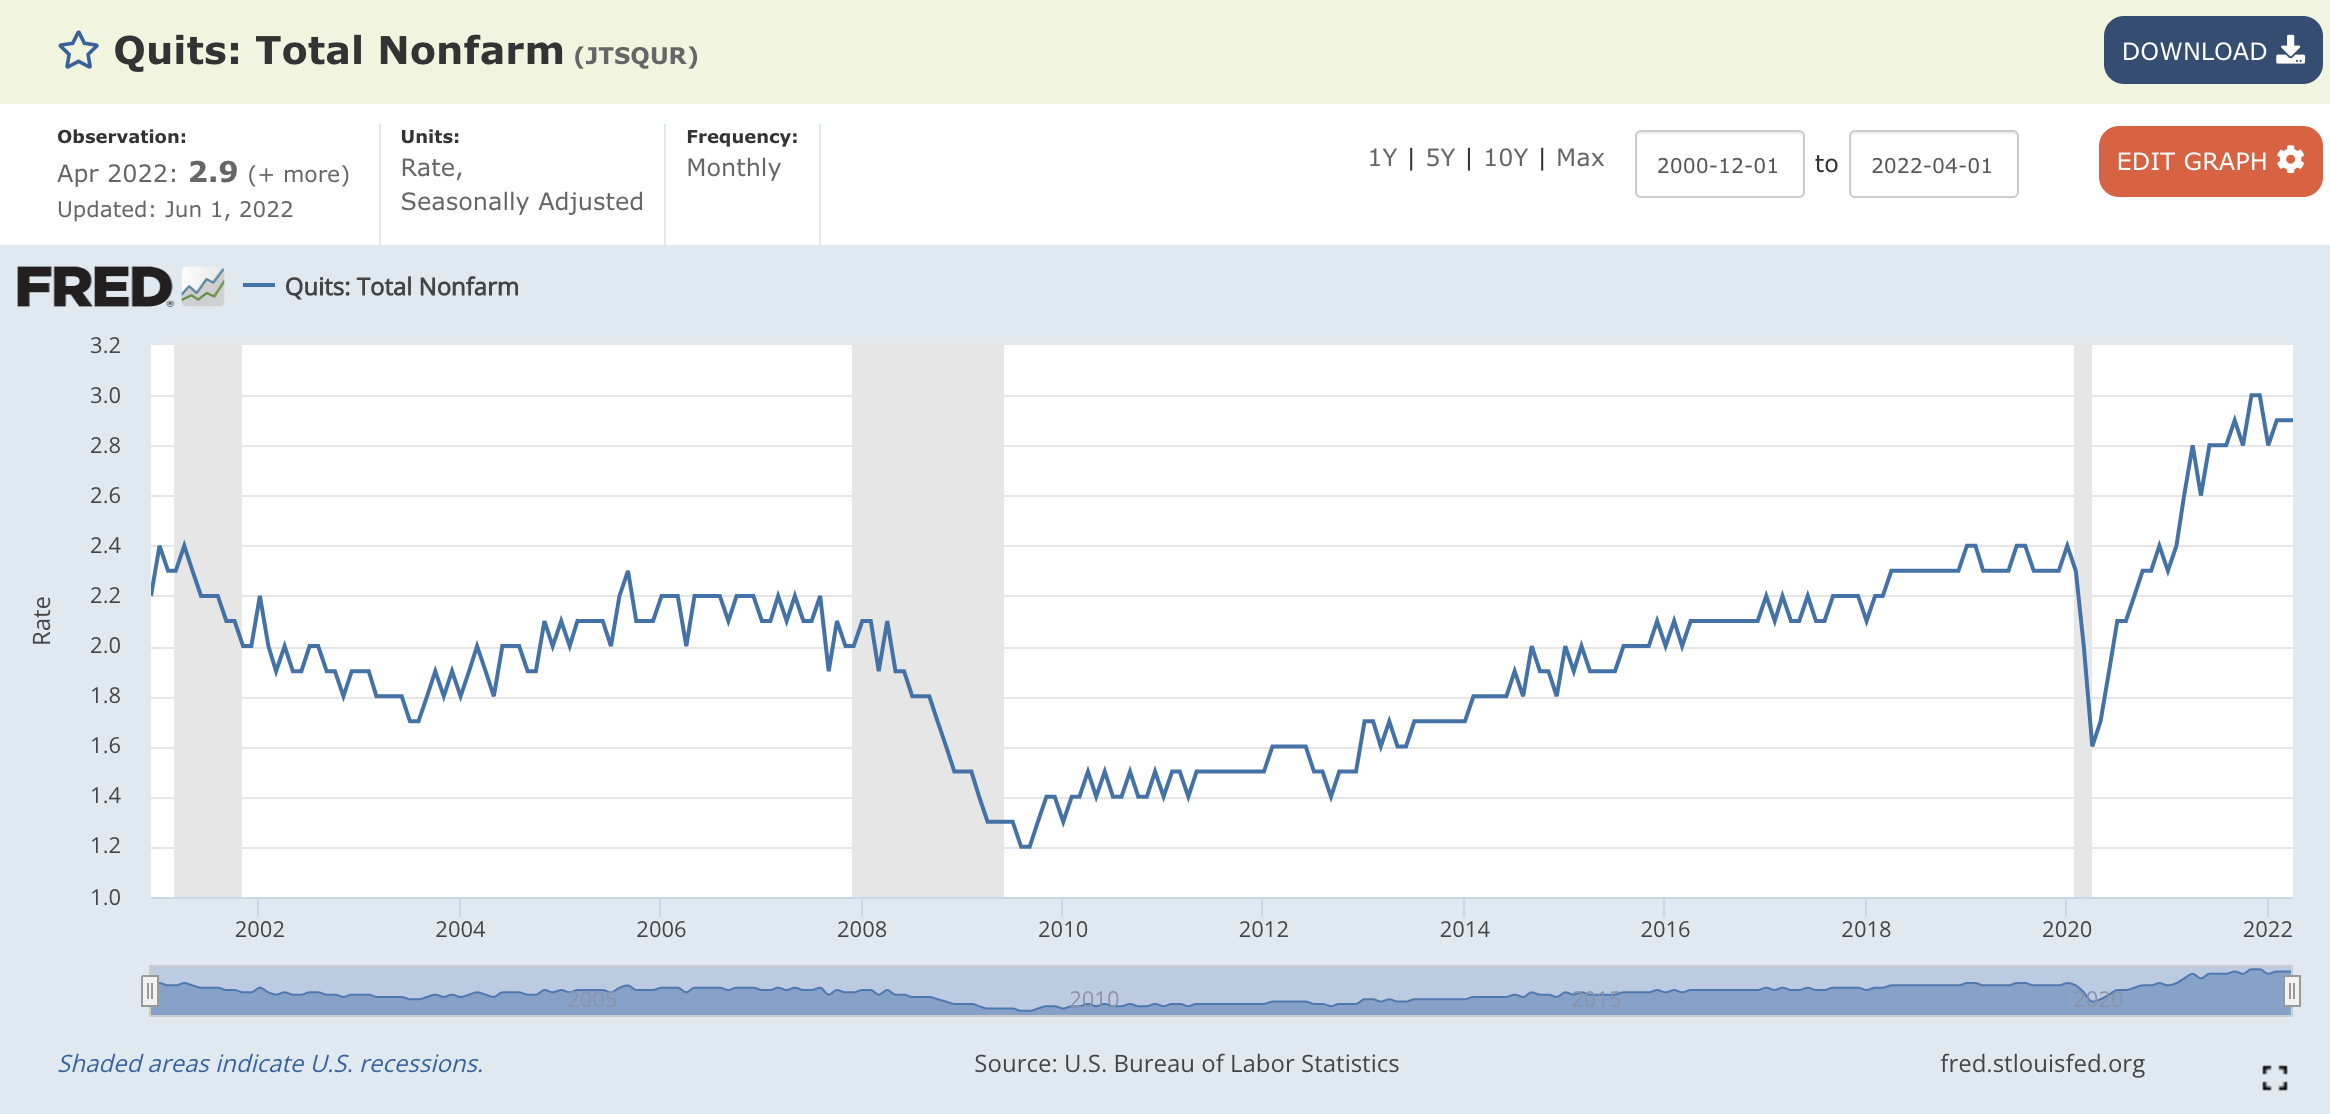
I want to quickly focus on data regarding quits, which is a vital metric to track because of the implications for inflation. I continue to reiterate that a high quits rate is actually the sign of a strong and dynamic labor market, signaling that workers are able to find “better opportunities, at higher pay, that are more aligned with their interests and skills.”
Recall, recent data from Indeed provided keen insights on this dynamic:
“Promotional increases within the same company typically amount to around 3%, whereas a person that switches jobs can expect a pay raise of about 10% to 20%.”
This is why a high quits rate foreshadows higher wages, which was confirmed by a 2015 study from the Chicago Federal Reserve that concluded the following:
“Job switchers drive up wages as they move up the job ladder... Furthermore, theory suggests that since the quit rate helps predict current and future costs of production (through wages), then it should also be important for predicting inflation. We find that these predictions hold true in the data.”
With the quits rate at/near all-time highs, measured at 2.9% for April 2022, this will likely keep inflation elevated.
It’s important to note that the data discussed above is telling us how the jobs data has evolved up until April 2022, and is therefore backward-looking. If we want to extrapolate how labor market data may evolve going forward, it’s important to keep a pulse on current headlines and announcements that companies are providing. We’re seeing major announcements about hiring freezes, layoffs, and/or increased scrutiny to hire new employees by the following U.S. corporations: Apple, Amazon, Facebook, Tesla, Nvidia, Salesforce, Coinbase, Wayfair, Twitter, Uber, Lyft, and many others.
We have yet to see the degree with which these announcements will impact labor market data, but I think it will be vital to contextualize these layoffs against net hiring activity for the broader economy as a whole. I’ll continue to watch monthly net employment gains, which could turn negative if these layoffs and hiring freezes become overwhelming. In the event that monthly net employment turns negative for consecutive months, this could start to raise some eyebrows for the Federal Reserve.
Thankfully, we have labor market data for the month of May to help get an idea for how these layoff announcements might already be impacting the market. On Friday, the nonfarm payroll (NFP) data was released with a headline number of +390,000 jobs created in May 2022, which was above the consensus estimate for +325k jobs. Rick Rieder, the Global Fixed Income CIO for BlackRock, shared that “the three-month moving average for NFP gains to 408,000 jobs… marks a deceleration in trend job growth since the start of the year, when the measure resided at 580,000.”
Rider’s comments are important in order to contextualize the dynamic nature of the labor market, one which generally appears to be slowing down from its rapid pace at the start of the year. Considering that Q1 2022 GDP contracted at an annualized rate of -1.4%, I suppose this isn’t much of a surprise, but at the very least serves as a confirmation that the U.S. economy is slowing down. However, job creation in May was still a net positive so it isn’t necessarily time to start ringing the alarm bells.
NFP data is quite robust, giving insights on several key indicators for the labor market. Here were some additional highlights for May 2022:
Unemployment rate was unchanged at 3.6%, at/near historical lows.
Labor force participation rate (LFPR) improved marginally from 62.2% → 62.3%.
Average nominal wages increased at +5.2% on a year-over-year basis, vs. +5.5% in April 2022.
On the aggregate, the data is encouraging and reflective of a resilient & expanding labor market. If we dig deeper, it’s even more optimistic. Consider the prime-age labor force participation rate, measuring the participation of U.S. adults age 25-54 relative to the total labor market, which increased from 82.4% in April to 82.6% in May:
Considering that the pre-Pandemic level was 83.1%, we’ve essentially recaptured the majority of losses from the COVID recession. Additionally, the prime-age employment to population ratio is currently 80% vs. a pre-Pandemic level of 80.5%. Essentially, the core workforce of the U.S. economy (from a demographic standpoint) has fully recovered. With prime-age economic participants largely leading the charge of consumer activity, I expect to see this translate into a relative resilient trend in consumer behavior.
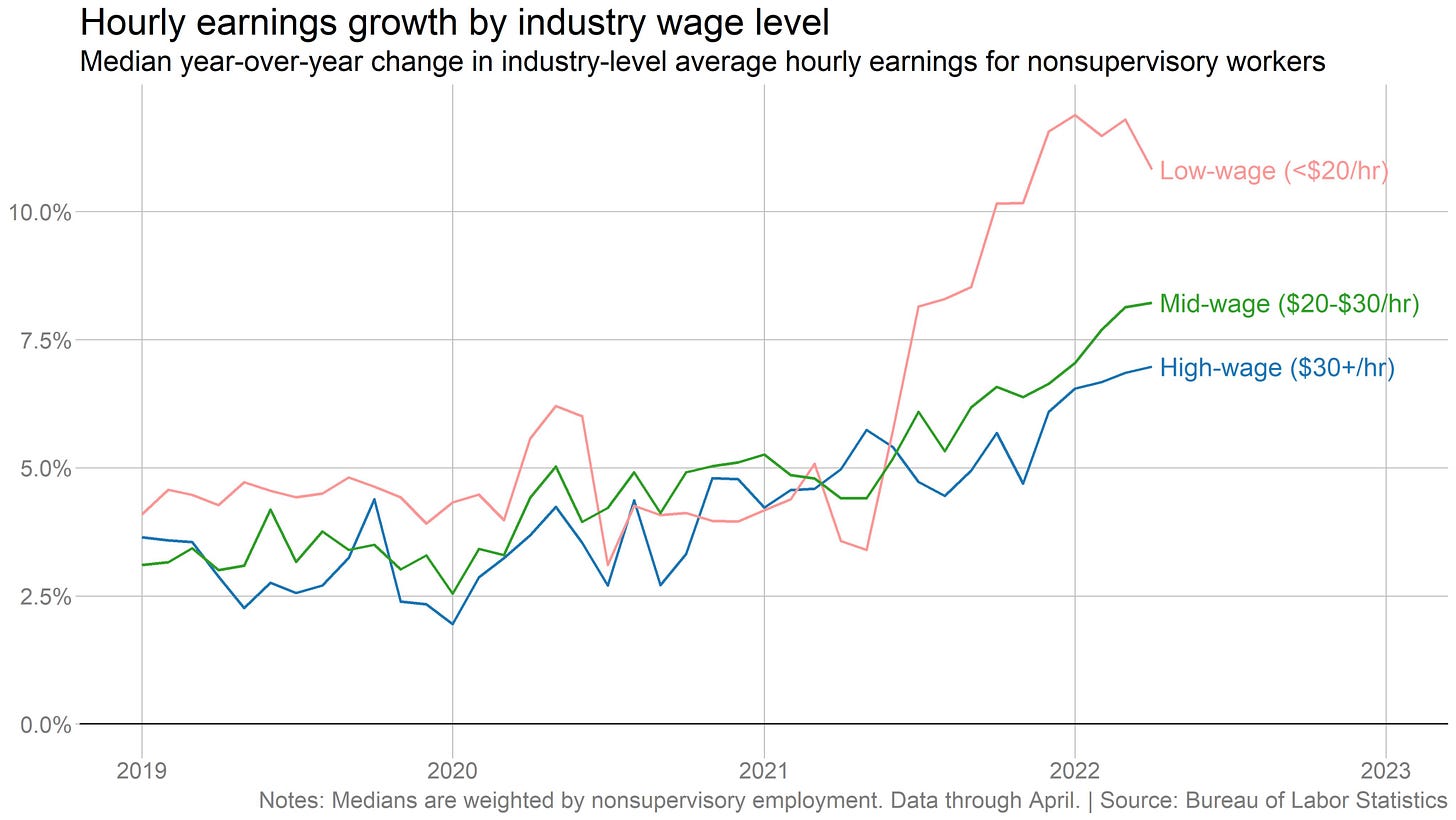
Average hourly earnings continued to grow at a monthly rate of +0.3%, consistent with the results from April 2022. If we analyze nominal wage growth by low, middle, and high wages, we can see that the low-wage group is experiencing the fastest rate of growth:

Regardless, all three categories are rising at an elevated rate. With the recent downturn in the year-over-year change for low-wage workers, I expect to see a continued downtrend over the coming months while mid & high-wage groups continue to remain elevated around +7.5%.
It’s important to recognize that these strong results for median hourly earnings growth are creating a buffer for consumers to absorb higher consumer prices. While real wage growth (nominal wage growth adjusted for inflation) is negative, it is evident that higher wages have allowed consumers to weather the inflationary storm to some capacity. However, hourly wages are only one component of an employees earnings. We must also consider hours worked and job growth, which cumulatively measures aggregate earnings:
Based on recent data, the YoY growth in aggregate earnings is just shy of +10% and has essentially stagnated around these levels for the past eleven months. Measured through this lens, it’s reasonable to see how & why the U.S. consumer has remained so resilient to absorb higher inflationary pressures.
Labor Market Conclusions: The labor market will provide a real-time pulse for how the Federal Reserve’s tightening cycle is impacting their dual-mandate. At the present moment, as we enter the early stages of the tightening cycle, labor market data remains strong. Is it perfect? No. Personally, I’d like to see more sustained increases to the labor force participation rate; however, I find comfort in the fact that the prime-age LFPR has recovered to pre-Pandemic levels. While wage growth is strong, all gains are being depleted by higher consumer goods/services. In turn, consumers are having to work multiple jobs, increase their hours worked, deplete their savings, and rely a bit more heavily on credit to finance their consumption habits. The recent downturn in average wages for low-wage workers could be foreshadowing a broader decline for mid & high-wage workers, but it’s too early to tell. So far, these categories remain in an upward sloping trend on a YoY basis.
It’s important to recognize that the Federal Reserve is actually trying to cool down the labor market. They recognize that a high quits rate is helping to create a wage-price spiral, which keeps inflationary pressures elevated. Former President of the New York Federal Reserve, Bill Dudley, spoke on Bloomberg this week and suggested that an unemployment rate of 4% or higher is conducive to bringing inflation back towards the 2% target. Considering that the current unemployment rate is 3.6%, it appears that the Fed is trying to use monetary tightening to outright weaken the U.S. economy and the labor market in order to suppress consumer demand, wage growth, and therefore bring inflation towards their 2% target. That’s not necessarily a rosy picture.
However, their dual-mandate is forcing the Fed to consider tradeoffs between the labor market and inflation. They perceive the labor market as being too tight and inflation as being too high, therefore they will attempt to balance the scales by weakening labor market conditions in order to bring inflation back within their target range. In the coming months, it will be very important to monitor labor market conditions. If the labor market doesn’t soften as the Fed continues to hike interest rates, this will likely mean that inflationary pressures remain elevated. While it’s possible that we see the CPI, PCE, and PPI inflation figures move lower with a hot jobs market, the Fed wants to confirm that inflation can materially move lower on a sustained basis. This will be more evident if the labor market weakens.
If/when we see that the labor market materially weakens, it’s vital to recognize that this will likely not deter the Fed in their tightening regime. This would actually imply that their tightening regime is working. If we see labor market data remain resilient to the Fed’s rate hikes, this will put more pressure on the Fed to accelerate or increase the magnitude of monetary tightening.
In response to the JOLTS and nonfarm payroll reports this past week, yields on 5, 10, and 30-year Treasuries rose, signaling that the bond market viewed these reports as a green light for the Fed’s rate hikes. Because yields and asset prices have an inverse correlation, stocks, bonds, and crypto all faced strong pressure this week. If labor market continues to remain resilient, which is my base-case scenario over the next 3-4 months, we will continue to see this dynamic unfold: yields ↑ & asset prices ↓
Broad-Based Economic Data:
As discussed above, the Fed is attempting to outright engineer a reduction in economic activity. This will materialize and ripple through the economy in different ways, in addition to the labor market impacts we’ve already analyzed. While we’ve already experienced a negative print for Q1 2022 GDP, I wanted to highlight recent economic data. Specifically, I want to focus on two main topics:
Consumer & business confidence.
Purchasing Manager’s Index (PMI) for services & manufacturing.
I think these are important to get a sense for how economic participants are navigating the economic environment and where they think it’s headed. It’s not a perfect metric to gauge where we are or where we’re going, but it’s significant nonetheless.
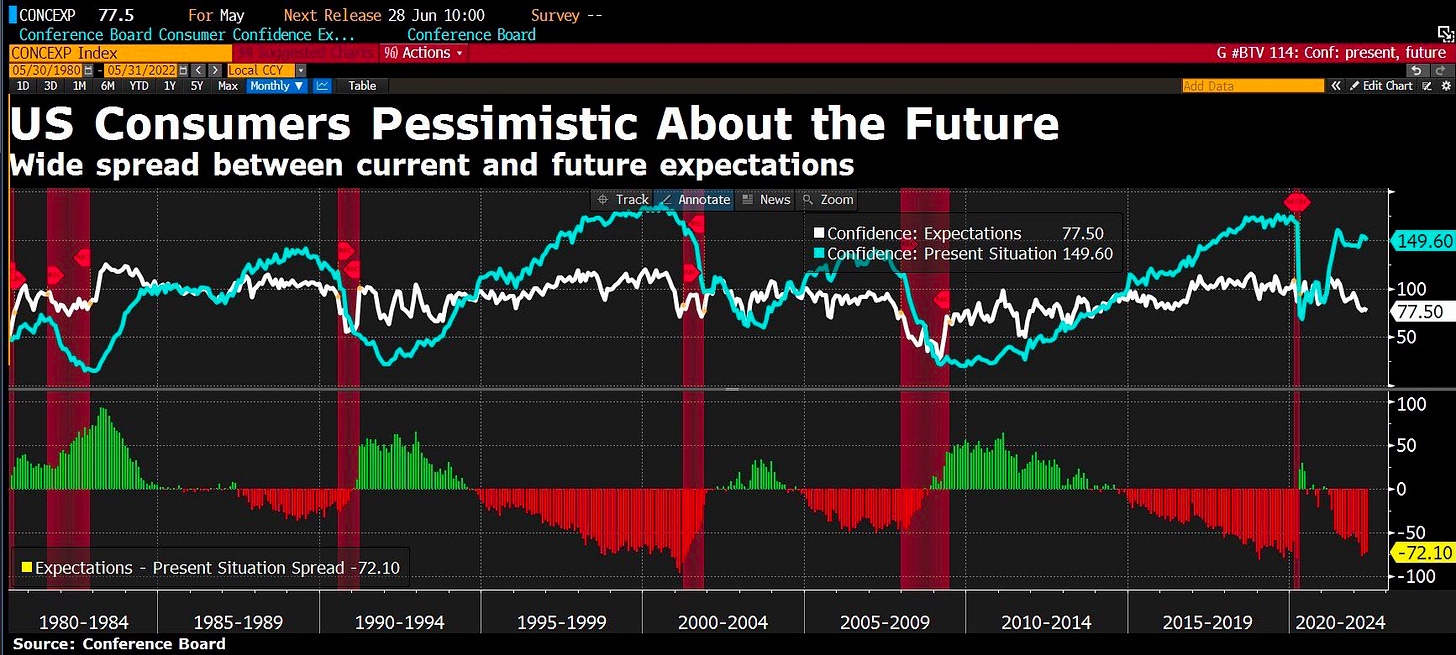
Consumer Confidence: The chart below does an excellent job of highlighting the gap between consumer sentiment about the future and current economic conditions:
Confidence about current economic conditions is holding up quite well, but still isn’t above the pre-Pandemic level. Unfortunately, consumers’ expectations about future economic conditions are currently worse than it was during COVID, highlighting the severe impact that inflation can have on economic sentiment. Signals of a recession could flash if we start to see both of these metrics fall substantially, indicative of a capitulation in consumer sentiment. Typically, we see a convergence in these two data points, either as a result of a recession or economic boom. Considering that the Fed is trying to engineer a recession, my base-case scenario is that we start to see consumer confidence about current economic conditions start to decline, particularly if we start to see an increasing degree of weakness in the labor market and more pressure in the asset markets.
Business Confidence: The graph below compares consumer confidence vs. business confidence, helping to create a full picture of general economic sentiment.

Business confidence is typically more volatile than consumer confidence, but they tend to move in the same direction. While consumer confidence has nosedived, we’ve seen business confidence remain relatively high. However, we’re starting to see early signs of capitulation for business confidence, evidenced by the recent peak and early-stage decline. The difference between consumer & business confidence is at all-time highs, indicating that a steep convergence is likely.
PMI Data for Services & Manufacturing Sectors: When evaluating PMI data, it’s necessary to understand that a figure above 50 is indicative of an expansion while below 50 is representative of a contraction. A negative rate of change (slope) indicates if an expansion is slowing down or if a contraction is speeding up.
The Services PMI was released on 6/1/22, still in expansionary territory; however, at a slowing rate of growth. Business employment is neither expansionary or contractionary.
The ISM Manufacturing PMI is still in expansionary territory as well, but also declining back towards 50. This generally confirms that both service sector and manufacturing activity are increasing at a declining rate. They are both getting close to an outright contraction.
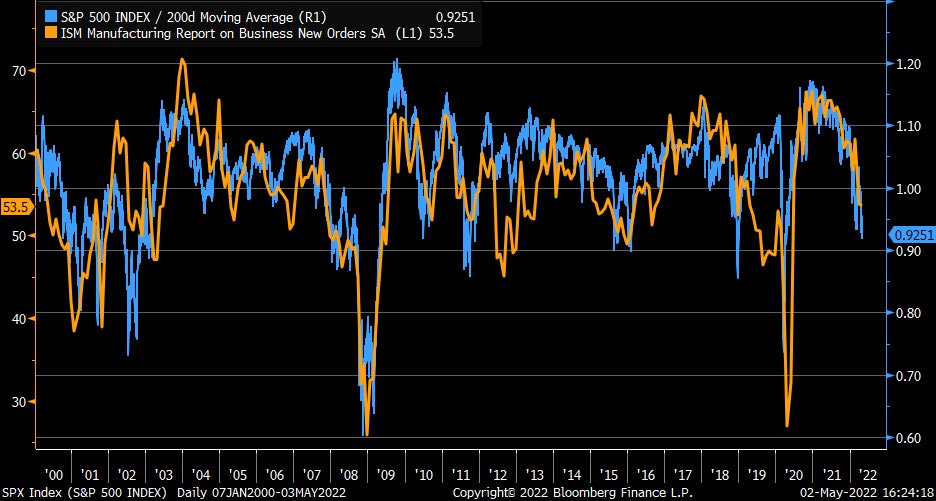
Why is this important? Because there’s a direct relationship between the rate of change in the PMI data and stock market returns, as evidenced by the following:
As we can see, a the index results for new orders is a near-perfect representation of how close or far the S&P 500 is relative to the 200-day moving average. As business conditions worsen, the S&P 500 tends to decline towards, or further below, the 200 moving average. Regardless of the expansionary or contractionary levels, the rate of change in manufacturing PMI is very important to asset market conditions.
Let’s prove it again with a slightly different measure, comparing how a YoY change in the manufacturing PMI tends to move in lockstep with the YoY change in the S&P 500:
Again, this data helps to contextualize how the significance of manufacturing activity and the impact that it has on the stock market!
Concluding Remarks:
On the aggregate, we’re seeing resilience in the labor market and a general decline in economic strength. Considering how strong the economic recovery was in 2021, it’s somewhat expected to see declining growth or outright contractions in economic data this year. With the Federal Reserve shifting towards outright tightening, economic conditions are likely to get increasingly difficult, putting a significant amount of pressure on U.S. consumers and businesses. With limited proof that inflation has peaked, the Fed will continue to prioritize monetary policy that will attempt to slowdown consumer demand, the labor market, and overall business activity.
Financial markets are forward-looking mechanisms, analyzing the possibility of various future outcomes and adjusting them into today’s market prices. Generally speaking, I believe inflationary pressures will continue to persist or be more difficult to defeat. I genuinely hope that I’m wrong in that assessment, but I’ve written about the substantiating factors here. While I do expect labor market data to soften over the coming months, I expect it to be strong/tight in the context of historical data. This will likely signal that the Fed can continue along their monetary tightening process, therefore pushing interest rates higher and causing further pressure on asset prices.
As I recalled at the beginning of this analysis, a monetary tightening environment will continue to create headwinds for asset prices. This has been the theme of 2022, which has been exacerbated by historically negative investor sentiment. Asset prices have experienced tremendous selloffs, whether we’re talking about technology stocks, consumer discretionary stocks, U.S. Treasuries, or crypto. So long as this environment persists, I think asset markets will remain volatile with a downside bias. In this environment, risk management, prudence, and patience will prevail over speculation and greed. In my opinion, this market necessitates short-term defense in order to be long-term opportunistic.
Conversely, a material & sustained decrease in inflation will cause markets to celebrate. Everything comes down to inflation and the labor market, which will directly impact the Federal Reserve’s decision-making, the path of monetary policy, and the yield environment. Over the coming months, the impact of economic data on financial markets will continue to increase. It’s important to take a weight-of-the-evidence approach and stay flexible with incoming data in order to interpret the evolving nature of a dynamic economy in a global system. That is what I will continue to do in my research at Cubic Analytics.
Best,
Caleb Franzen
DISCLAIMER:
My investment thesis, risk appetite, and time frames are strictly my own and are significantly different than that of my readership. As such, the investments & stocks covered in this publication are not to be considered investment advice and should be regarded as information only. I encourage everyone to conduct their own due diligence, understand the risks associated with any information that is reviewed, and to recognize that my investment approach is not necessarily suitable for your specific portfolio & investing needs. Please consult a registered & licensed financial advisor for any topics related to your portfolio, exercise strong risk controls, and understand that I have no responsibility for any gains or losses incurred in your portfolio.


