Investors,
I’m glad to be back after a mini-vacation. Without delay, let’s dive right into this week’s market update.
Macroeconomics: Fed Tightens, Economy Contracts, and Yields Skyrocket
It’s been a volatile two-week period, full of economic data releases and important monetary policy announcements. Most importantly, these dynamics can be summarized in a few key themes:
The Federal Reserve is finally backing up their aggressive rhetoric and verbal posturing. After raising rates +0.25% in March 2022, then ending their asset purchase program, the Fed escalated their tightening process this week by raising interest rates +0.5%.
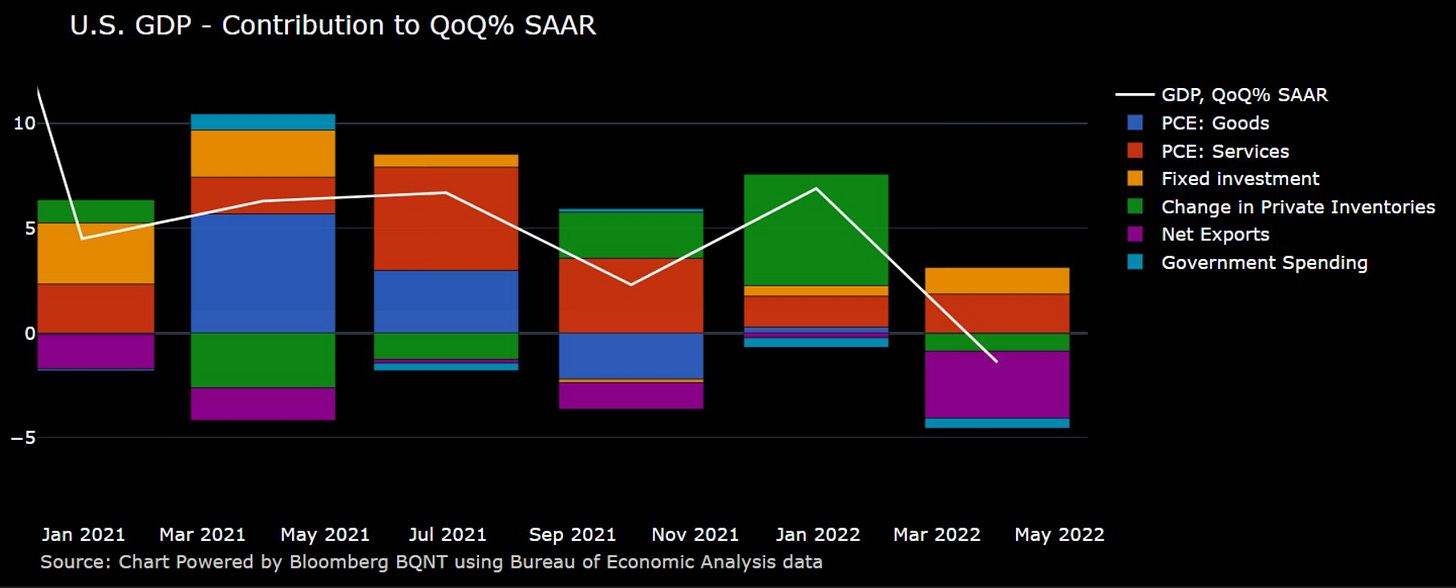
The economy is slowing down, although the consumer appears to be resilient in light of a multi-decade high inflation rate. The Q1 2022 GDP reflected a negative growth rate for the U.S. economy, largely restricted by high imports. On the aggregate, the economy contracted at an annualized rate of -1.4%; however, consumer spending rose at an annualized rate of +2.7%. Considering that the GDP forecast was an aggregate growth rate of +1.0%, this was a discouraging miss. Those arguing for stagflation, a period of economic contraction with simultaneous high inflation rates, are being vindicated.
Liquidity is getting pulled out of the financial system, exacerbating a rise in Treasury yields and pushing asset prices lower. This is a function of two things: Fed tightening and the bond market pricing in higher inflation.
Let’s dive into some of the data more directly.
Regarding monetary policy, the bond market is doing the heavy-lifting for the Federal Reserve. Bond investors continue to interpret the Fed’s tone as aggressive and steadfast, putting upward pressure on yields. With the Fed officially raising interest rates by 0.5%, the target for the federal funds rate (FFR) is now rangebound between 0.75%-1.00%. The chart below highlights the massive divergence between the upper-bound of the Fed’s FFR range and the rate of inflation.

Historically, CPI has generally remained below the Federal Reserve’s target for the FFR, particularly in the period from 1980-2002. Over the past 20 years, CPI has generally been in-line with the FFR & fluctuated slightly above it. Therefore, current inflation dynamics are clearly abnormal. This is arguably why the Federal Reserve is using such hawkish rhetoric — they’re expecting that the bond market will interpret their aggressive tone and adjust accordingly. So far, it’s working.
5, 10 and 30-year yields have been ripping higher, fueled by the Fed’s announcement in November 2021 that they were tapering their asset purchases. The markets had already begun to price-in the Fed’s reduction in asset purchases, but the official announcement officially gave the green light for yields to rise further.
As 2022 has progressed, inflation has accelerated, forcing the market to expect even more aggressive monetary tightening from the Federal Reserve. Here’s the data so far:
January 2022: +7.5% YoY
February 2022: +7.9% YoY
March 2022: +8.5% YoY
In 2021, the first quarter’s CPI inflation looked much different:
January 2021: +1.4% YoY
February 2021: +1.7% YoY
March 2021: +2.6% YoY
This has added more fuel to the fire, causing bond investors to reduce demand for fixed income securities in expectation of sustained inflation. With limited demand from the private market, yields on Treasuries have skyrocketed. As of May 6th, Treasury yields closed the session at the following levels:
2-year Treasury yield: 2.735%
5-year Treasury yield: 3.079%
10-year Treasury yield: 3.142%
30-year Treasury yield: 3.238%
While actions from the Fed haven’t done much to tighten financial conditions, their rhetoric has allowed the bond market to do the heavy lifting. For example, here’s 10-year Treasury yields since January 2018, given by ticker symbol $TNX:
10-year yields officially ended the week within the critical juncture, retesting the resistance range from 2018. In a monetary tightening regime, where the Fed appears committed to substantive rate increases, I think 10-year yields will breakout above this range and reach new multi-year highs. This will put additional pressure on asset markets, pulling liquidity out of the financial system.
As it pertains to GDP & economic activity in Q1 2022, I think the following chart from Michael McDonough gives an interesting perspective on GDP components:
Clearly, net trade (exports - imports) was the primary drag on domestic economic activity in the first quarter, while demand for services & fixed investment was resilient. In this sense, we have silver-lining that the U.S. consumer is still reflecting strength. I’m not overly concerned about the Q1 GDP data because of this; however, I will certainly flag concern if/when we see a formal contraction in private consumption.
Stock Market: Fear, Fear, and More Fear
In light of the yield dynamics mentioned above, stocks continue to get pummeled after the head-scratching rally in mid-March. As of Friday’s close, here are the YTD returns for each of the major U.S. indexes:
Dow Jones $DJX: -9.4%
S&P 500 $SPX: -13.5%
Nasdaq-100 $NDX: -22.2%
Russell 2000 $RUT: -18%
There has been almost no safety in the market. Traditionally defensive sectors are holding up significantly better than technology and consumer discretionary, but are generally struggling YTD:
Utilities $XLU: +0.9%
Industrials $XLI: -9.7%
Basic Materials $XLB: -6.7%
Healthcare $XLV: -7.9%
Each of the indexes are making lower highs and lower lows, the official indication that the market is rolling over and deteriorating. The S&P 500 is generally adhering to the bearish head & shoulders pattern I’ve been sharing since February. The former support range in grey is weakening after each retest, but is now acting as resistance. In my opinion, this should keep producing lower lows.
For final thoughts about the stock market, I wanted to share interesting data about the Nasdaq-100. As pointed out earlier in this section, the Nasdaq is the worst performing index so far in 2022. With technology stocks facing the brunt of the market’s pressure, tech investors are clearly experiencing extremely difficult times. In fact, it’s been historically difficult!
In the chart below, we’re analyzing the Nasdaq-100 (top blue line) since 2007. At the lower-bound, I’ve added a tracker for the percent of stocks within the index trading above their 200 day moving average.
As we can see, it’s extremely rare for the index to have less than 20% of its constituents trading below the 200 moving average. In fact, it’s only happened 6 times since 2007, with the most recent signal flashing on Wednesday, May 5th. Based on the data, this signal has actually been rather bullish and practically marked the market bottom in 2011, 2016, 2018, and 2020. The 2008 signal is the clear outlier, where the market continued to plummet an additional -30.7% to the market lows over the course of 7 weeks. This means that the signal has a success rate of 80% over the past 15 years.
It’s still far too early to tell which scenario will play out, although I lean towards more downside in the short-term. This isn’t a time for investors to be greedy and go “all in”, although I certainly believe that long-term investors with patience and tolerance for short-term pain will be the largest beneficiaries of this market volatility. Contrarian investors might get excited about this data point as a signal to dollar-cost average into core positions at a slow & steady rate.
Bitcoin: Price Compression & Long-Term Thesis
Amidst market-wide pressure, Bitcoin and crypto have not been immune to downside volatility. At the time of writing, on Thursday evening, Bitcoin is down -20.9% YTD.
Here’s the critical price structure I’m watching, simplified to highlight the most important levels. The bull market isn’t decisively over, but it’s holding onto a thin rope. The blue wedge is something that I was highlighting in March, with the upside breakout increasing bullish probabilities. While the probability of bullish outcomes rose, recent market dynamics have pushed price lower. We’re now retesting the lower-bound of the wedge, a critical support level that bulls need to defend.
If price fails to rebound on this level, I think there’s a strong chance we retest the lower-bound of the white consolidation range, between $28.8k and $30.2k. If/when we get there, I will evaluate how price reacts and listen to the signals of the market to interpret what happens next.
Essentially, Bitcoin has been range-bound between $29k and $65k for the past 16 months. The wild swings between these levels have given extreme confidence and fear to optimists and pessimists, depending where we are within the range. In the short-term, I think more pressure to the downside is likely; however, I remain steadfast in my outlook on long-term risk/reward of the digital asset.
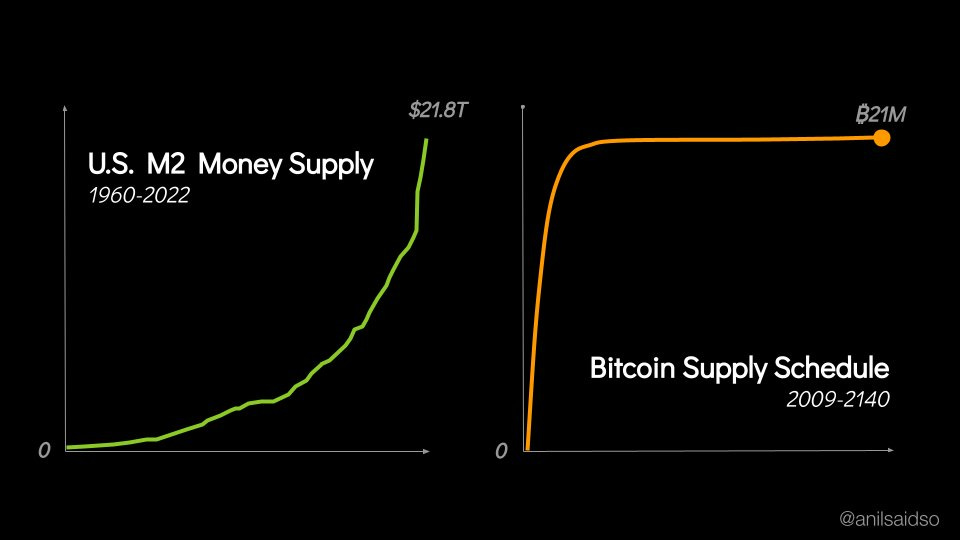
Have I been too optimistic over the past 24 months? At times, yes. However, the fundamental thesis remains the same: in a long-term environment where global central banks are certain to increase the magnitude of their monetary stimulus, thereby printing trillions of dollars in the process, scarce financial assets will appreciate in value.
With Bitcoin’s supply capped at 21M, and more than 19M of supply already in existence, Bitcoin’s monetary policy is designed to become increasingly more scarce over time. The inflation rate is known with certainty and the monetary network is a permissionless & decentralized system designed to promote economic sovereignty, while benefitting from an internet-like adoption curve. The network is defended by 227 quintillion calculations/second in computational power, operating 24/7 to validate each block of transactions.
In a fiat system designed to promote an increase in the money supply, Bitcoin is the apex scarce asset, which should make it the largest beneficiary of future monetary and fiscal stimulus.
Talk soon,
Caleb Franzen
DISCLAIMER:
My investment thesis, risk appetite, and time frames are strictly my own and are significantly different than that of my readership. As such, the investments & stocks covered in this publication are not to be considered investment advice and should be regarded as information only. I encourage everyone to conduct their own due diligence, understand the risks associated with any information that is reviewed, and to recognize that my investment approach is not necessarily suitable for your specific portfolio & investing needs. Please consult a registered & licensed financial advisor for any topics related to your portfolio, exercise strong risk controls, and understand that I have no responsibility for any gains or losses incurred in your portfolio.


