Investors,
For the first time in 6+ months, I didn’t distribute the free edition of Cubic Analytics this weekend. To make up for lost time, I’m sending this week’s Premium Market Analysis to all subscribers regardless of subscription status. These reports are my core investment research, analyzing the critical market data to broaden your perspectives and help give you the tools to try and navigate the market. For those of you who haven’t upgraded beyond my free research, I’m hoping today’s newsletter shines light on the additional value I publish on Substack. In celebration of crossing 10,000 followers on Twitter this week, I’m offering a 10% discount to the premium access of Cubic Analytics!
As a premium member of Cubic Analytics, you’ll receive weekly distributions of these “Premium Market Analysis” reports and monthly reports of my entire portfolio holdings & allocations, in addition to the free research you currently receive.
Without further ado, let’s dive in…
Markets continue to face pressure, caused by relentless pressure from rising yields & investor psychology. After an extremely strong rally from the March 14th lows through the March 29th highs, each of the major U.S. indexes (and crypto) have faced downside pressures. Since the close on 3/29/2022, here’s how each index has performed through last week’s close:
Dow Jones Industrial Average $DJX: -2.4%
S&P 500 $SPX: -5.1%
Nasdaq-100 $NDX: -8.8%
Russell 2000 $RUT: -6.00%
Based on these dynamics alone, we can make a conclusive statement that large cap, mature, high dividend, and value-oriented stocks are outperforming small caps, technology, and growth stocks. We’ll confirm if this is true later in the report, in addition to discussing overall market conditions, the key metrics I’m monitoring to evaluate market dynamics, and then highlight the core factors I’ll be watching this upcoming week.
In terms of relative strength/weakness amongst sector groups, here is last week’s relative performance:
Once again, we’re seeing market leadership from defensive industries (materials & consumer defensive) and commodity-related stocks (energy & materials). Premium readers know that I’ve been highlighting the strength of oil & energy services since Q4 2021. The reason why I’ve been so bullish on this group is because of how crude oil is impacted by an inflationary regime. As inflation & inflation expectations rise, crude oil prices have strong tailwinds to rise in lockstep. As crude oil prices and commodities rise, the biggest beneficiary are the producers of commodities. Similarly, rising inflation dynamics cause interest rates to rise. This puts pressure on growth & technology stocks, shifting investors towards defensive industries and value stocks that pay strong dividends. Again, this benefits commodity-related stocks.
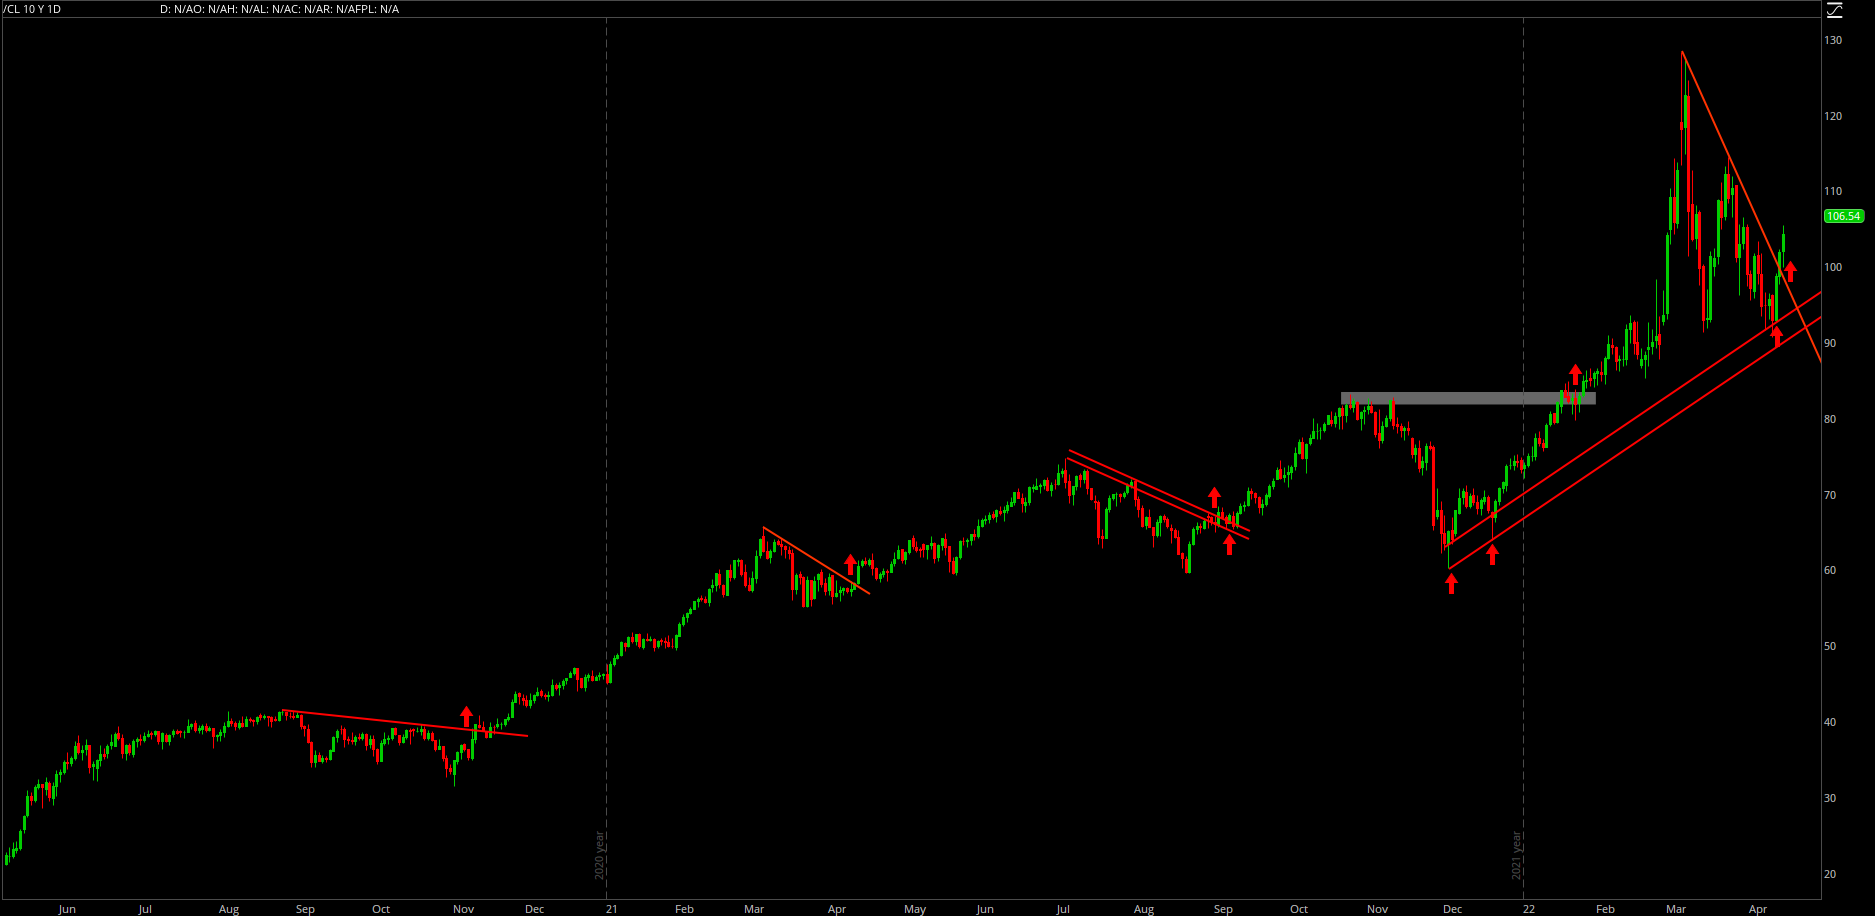
On 4/4/22, I shared the following analysis of crude oil futures with Twitter followers:
At the time I published this chart, I included the following commentary:
“What do you think happens when crude oil is able to break out of the current wedge?
Since Q2 2020, breakouts have produced a new leg higher within the bull market. Breakout, extension, consolidation, repeat.”
Since sharing that analysis, crude oil futures retested the lower-bound of the wedge & rebounded instantly. Over the next few days, we saw a breakout to the upside, which possibly hints towards a new extension higher. Here’s the current chart:
As I foreshadowed in my post on April 4th, another upside breakout would substantially improve the possibility of a new leg higher. I don’t know how long the extension will last, or how high it will go, but this is something that all investors should be paying attention to over the coming weeks.
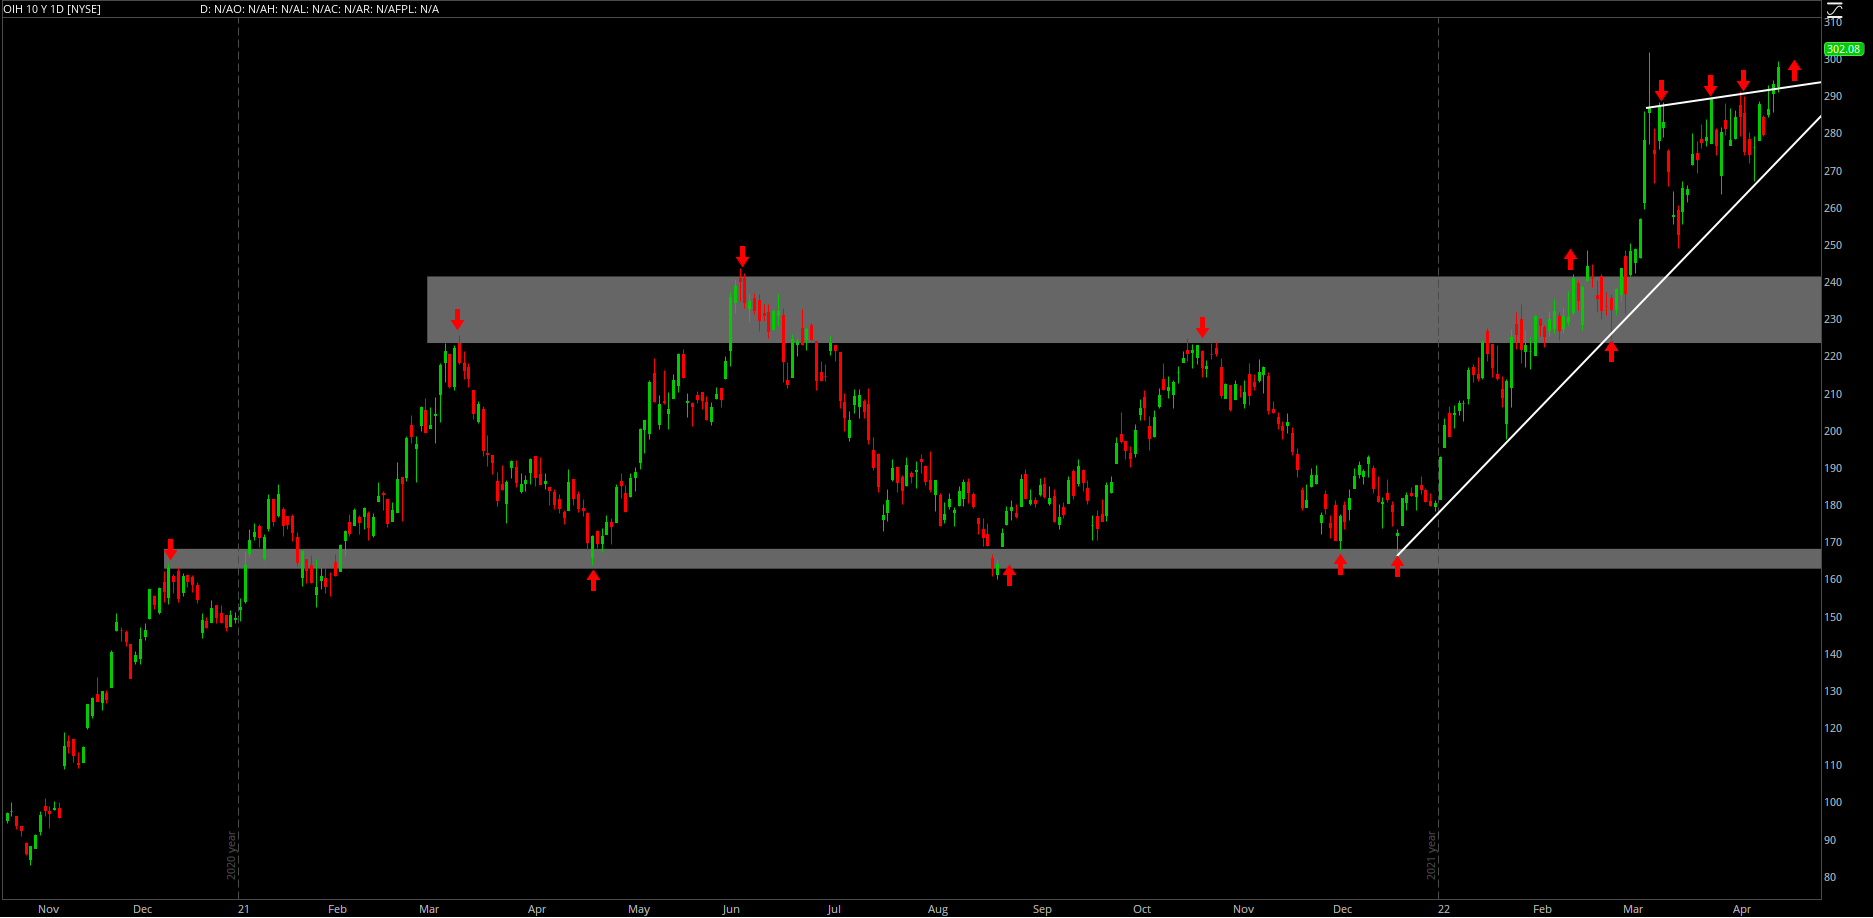
If we see a sustained increase in crude oil prices, oil services, exploration & production, and energy related stocks will be poised to run higher. My favorite fund to benefit on this thesis has been VanEck’s Oil Services ETF, $OIH. The fund is officially up +63.4% YTD, while the S&P 500 is down -7.8%. In terms of relative performance, it doesn’t really get much better than this. Here’s the chart of $OIH, achieving a bullish wedge breakout at the end of the week:
Here’s my takeaway: Based on recent price action, I think general market weakness will continue to benefit defensive sectors in the short & medium term. In an inflationary regime, commodity prices will continue to rise & therefore benefit crude oil & natural gas prices. In response to rising commodity prices, energy-related stocks have the strongest tailwinds in a rising rate & inflationary environment. Should inflationary pressures abate, I expect to see commodity prices cool off. Until that happens, I’m bullish on:
$OIH
iShares North American Natural Resources ETF $IGE
iShares U.S. Oil & Gas Exploration & Production ETF $IEO
Invesco S&P SmallCap Energy ETF $PSCE
Let’s analyze the important under-the-hood metrics for the S&P 500 that we continue to monitor:
197 stocks in the index have a positive YTD return vs. 197 last week and 203 two weeks ago.
238 stocks are trading above their 200-day moving average vs. 246 last week and 261 two weeks ago.
194 stocks are down at least -20% from their 52-week highs vs. 184 last week and 172 two weeks ago.
82 stocks are down at least -30% from their 52-week highs vs. 85 last week and 67 two weeks ago.
75 stocks are making new 20-day highs vs. 119 last week and 68 two weeks ago.
55 stocks are making new 50-day highs vs. 85 stocks last week and 52 two weeks ago.
33 stocks are making new 52-week highs vs. 57 stocks last week and 27 two weeks ago.
On the aggregate, this data suggest that the market is stagnating and/or deteriorating. Of the stocks making new 20-day, 50-day, and 52-week highs, the majority of these stocks are in defensive sectors. Technology is the most underrepresented sector in these bullish behavior screens, again confirming that investors don’t have strong demand for tech/growth in 2022.
At the beginning of this analysis, I posited that large caps, high dividend and value stocks are outperforming small caps, tech, and growth stocks since 3/29/22. Let’s confirm if this is true, based on on the performance of various ETF’s:
1. We can compare the Vanguard Value Index Fund ETF ($VTV) vs. the Vanguard Growth Index Fund ETF ($VUG):
Value $VTV: -1.44%
Growth $VUG: -8.65%
This validates that value outperformed growth last week, despite also having a negative return.
2. We can compare the Vanguard Small Cap ETF ($VB) vs. the Vanguard Large Cap ETF ($VV), which are both USA-specific ETF’s:
Small Caps $VB: -5.18%
Large Caps $VV: -5.36%
Interestingly, large caps are actually underperforming small caps, albeit by a negligible margin. Based on this takeaway, there doesn’t appear to be a meaningful difference between U.S. small caps & large caps.
In addition to broader market conditions, I continue to be hyper-focused on $ARKK as a gauge for risk sentiment and further market deterioration. In Edition #166, published on 4/3, I mentioned the following in regards to $ARKK and the 21-day exponential moving average:
“For growth & technology investors, it’s very important that $ARKK remains above the 21-day EMA this upcoming week. Should we fall below it and close beneath the 21 EMA for two consecutive days, I’ll officially regain my bearish sentiment on non-profitable tech/growth.”
What happened thereafter? Here’s the chart:
Two days after sharing that analysis (teal line), $ARKK fell below the 21-day EMA (yellow) and remained below it for the entirety of last week. With $ARKK officially achieving my bearish signal, I expect to see the 21 EMA act as resistance if/when we retest it in the coming weeks. To reiterate, this substantially increases downside probabilities for high risk assets in the short run.
As it pertains to the broader market, here’s the critical structure I’m watching for the Nasdaq-100:
As we can see, the Nasdaq closed the week perfectly within the grey region that I’ve been highlighting since last year. This zone was former resistance in 2021, but has been attempting to act as support in 2022. Should we fall below this zone & close below it for two consecutive days, I think the probability of making new YTD lows will be dramatically increased. In order to make new YTD lows, the Nasdaq-100 would need to fall -6.3% and break below 13,000.
Switching to the S&P 500, $SPX appears much stronger than the Nasdaq at the present moment:
The S&P 500 is still trading above the alternating resistance/support zone in grey, indicating that the broader market is outperforming large-cap tech. While it’s possible for the S&P 500 to fall to the grey zone, I think there’s a decent chance that price rebounds on the rising green trendline from the YTD lows. This indicates that the S&P 500 could fall roughly -1.5% until it retests that trendline & then rebounds higher. Should we face continued market pressure this week, I’ll be paying attention to how the index responds to this trendline. If we rebound on it, that’s bullish. If we break below it, that’s bearish.
Overall, this price action is not attractive for short-term investors/traders. As I’ve been saying for months, this market pressure will continue to provide long-term investors with substantial opportunities if they can stomach the short-term volatility. I think dollar-cost-averaging (DCA) into core portfolio holdings is appropriate at this time. We are no longer in the speculative craze of 2020 & 2021, where new investors were able to capitalize on a market fueled by monetary stimulus. This is a time where prudent and patient investors will emerge victorious, but only earn their flowers over the next 24-60 months.
Thankfully, I used the mid-March rally to reduce equity exposure and raise cash to take advantage of DCA’ing into the market over the coming 12-18 months. To reiterate, short-term greed won’t be rewarded in this market environment, but I think long-term greed will.
Best,
Caleb Franzen
DISCLAIMER:
My investment thesis, risk appetite, and time frames are strictly my own and are significantly different than that of my readership. As such, the investments & stocks covered in this publication are not to be considered investment advice and should be regarded as information only. I encourage everyone to conduct their own due diligence, understand the risks associated with any information that is reviewed, and to recognize that my investment approach is not necessarily suitable for your specific portfolio & investing needs. Please consult a registered & licensed financial advisor for any topics related to your portfolio, exercise strong risk controls, and understand that I have no responsibility for any gains or losses incurred in your portfolio.


