Investors,
In this newsletter, we’ll be covering the following topics:
How/why Treasury yields have continued to rise higher, reaffirming the outlook that I’ve been providing in this newsletter and on Twitter.
Rising yields have been consistent across all maturities, but are accelerating the faster on shorter maturity Treasuries. As a result, the yield curve continues to compress and is inverting on various spreads. I explain why I this is happening from a macro standpoint.
Bullish momentum thrusts are occurring throughout the equity markets. I created insightful analysis on the Nasdaq-100 which indicates bullish behavior for technology stocks and risk assets going forward. Historically, this signal has produced strong forward returns.
Bitcoin’s price action has been remarkably strong in recent weeks, and has generally been very stable so far YTD. It’s quietly outperforming the Nasdaq so far this year. I share the key levels I’m watching on my chart, as well as a bullish signal I’m seeing that has only happened 3x in the past 24 months.
Let’s dive right in…
Economy:
At the beginning of March, investors were grappling with extremely tumultuous markets. To address the volatile market conditions, I published “Edition #157: Navigating Uncertainty”, where I analyzed the root causes of market pressure and explained where I thought markets would go next:
At it’s core, this newsletter was a deep-dive on interest rate dynamics. At the end of my analysis, I explained why I believed yields would continue to rise going forward and shared the following chart of 10-year Treasury yields:
Based on this analysis, I shared my outlook for what yields would do next:
“The grey zone acted as resistance for the entirety of 2021, but has been acting as support so far in 2022. We are currently retesting this grey range once again, and I believe the most likely case scenario is that yields rebound on this level.
Combining the inflationary factors, monetary policy outlook, bond market dynamics, and my own personal technical analysis, I reiterate my expectation for yields to rise. This will exacerbate the trends we’ve been seeing since November 2021, likely causing increased volatility in financial markets and increasing economic uncertainties.”
Since I published this research on March 5, 2022, 10-year Treasury yields have increased significantly. Here’s what the chart looks like after this week’s close:
As I suspected, yields rebounded exactly on the level that I outlined and have broken to new multi-year highs. In fact, the 10-year Treasury yield is currently at 2.488% vs. 1.72% on March 5th, a +45% increase! We continue to see a rapid acceleration in yields, particularly on shorter maturity levels. The yield curve, a representation of yields at various maturities, continues to flatten and invert in some cases:
Principally, rates are rising for two key reasons:
1. Since the Federal Reserve officially increased the federal funds rate by +0.25% on March 16, rates have accelerated even faster. It seems evident that 25 basis point rate hikes won’t be effective to combat inflation, and we’ve continued to see increasingly aggressive statements by the Federal Reserve. Over the past ten days, we’ve heard the following comments from key members of the Fed:
“If we conclude that it is appropriate to move more aggressively... we will do so” - Jerome Powell
“Not wedded to moving only 25” - Raphael Bostic
“Very open to half-point moves” - Tom Barkin
“The data is basically screaming at us to go 50” - Christopher Waller
“50... would have been a better decision” - James Bullard
Clearly, they’re preparing the markets for more aggressive rate hikes after the first 25 basis point increase. As I’ve been saying, the Fed is using rhetoric and posturing to help suppress inflation expectations; however, they’ll also need to follow-through with more aggressive actions if they want to materially reduce inflation.
2. The bond market is pricing-in higher levels of inflation. Additionally, it’s possible that the bond market doesn’t believe the Fed’s monetary tightening will be effective to combat inflation, resulting in a more aggressive tightening schedule that causes rates to rise higher & faster. Because bond yields and inflation are positively correlated, rising bond yields indicates that bond market participants are expecting to see more inflation.
Therefore, rates have tailwinds to rise further based on these two factors: an increasingly aggressive Federal Reserve and higher inflation expectations.
Despite the rapid acceleration in yields since November 2021, real yields (aka the inflation-adjusted nominal yields) are still negative! Per data from Nasdaq, the core maturities (5, 10, and 30-year) on various Treasury yields are negative, although the real 30-year yield is about to become positive once again:
Stock Market:
U.S. stocks have accelerated at an historic rate over the past two weeks. At the end of last week, the S&P 500 had produced two strong bullish signals, which I covered with premium Substack members on Sunday:
The bullish price action continued this week, with each of the U.S. indexes having solid gains. Since the market close on 3/14, here’s how each of the major indexes have performed:
Dow Jones Industrial Average $DJX: +5.8%
S&P 500 $SPX: +8.9%
Nasdaq-100 $NDX: +13.1%
Russell 2000 $RUT: +7.0%
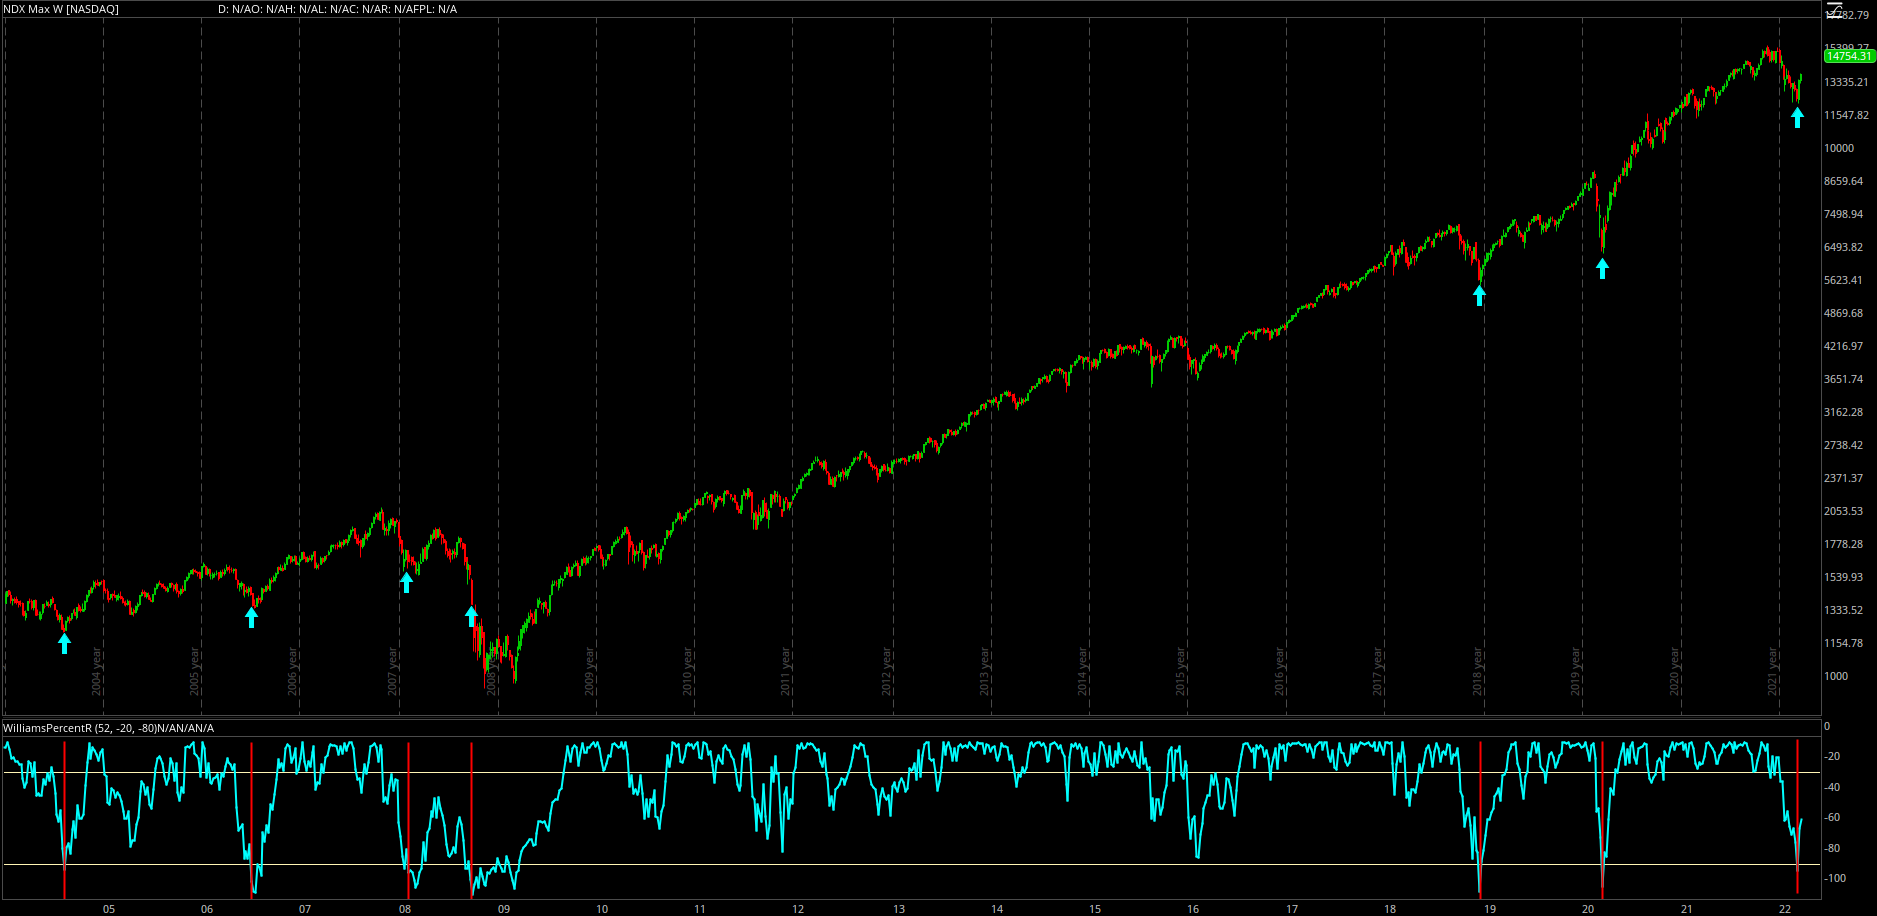
There’s an extremely important chart that I wanted to share with everyone, which I discovered on Wednesday evening. In the chart below, we’re looking at the Nasdaq-100 since 2003, displayed with weekly candles in logarithmic scale:
I added the Williams%R oscillator at the bottom of the chart, which compares the price of an asset relative to the historical price over X periods. In this case, I used the 52-week range in order to get a 1-year comparison of relative value. When the oscillator falls below the lower-bound, this indicates that the asset is “oversold”.
The Williams%R has only become “oversold” seven times since 2003, with the most recent signal happening on March 11, 2022. I was immediately curious to know how the Nasdaq-100 performed in the six prior instances after becoming “oversold”, so I backtested the data and came away with the following:
The data is remarkably bullish, indicating very strong returns on a wide-range of timeframes. The September 2008 case is the worst-performing signal, in which the Nasdaq-100 fell an additional -30% over the subsequent six months; however, the average six-month return was still +16.13%.
Considering that the signal just flashed again on March 11th, the forward-looking returns for the index are quite encouraging. It should be noted that the Nasdaq has already increased by +10.9% so far since the signal flashed on 3/11/2022. While I have recently taken a more bearish tone on short-term market dynamics, this study reaffirms that long-term investors should be optimistic and level-headed during market volatility. With an average three-year return of +55% and a median return of +32%, the long-term outlook during market selloffs is very strong, even if short-term conditions remain volatile.
In addition to the bullish data we covered in last week’s premium report, this new data increases the likelihood of bullish outcomes; although I’m not certain the short-term volatility is over. More to come in this weekend’s premium report:
Bitcoin:
As it pertains to the crypto market, digital assets also had a strong week. Relative to the prior week’s close, Bitcoin gained +6.8% while Ethereum gained +6.5%.
Very quickly, I want to mention that the bullish signal that we covered for the Nasdaq-100 also bodes well for Bitcoin. I backtested Bitcoin’s performance after the Nasdaq signal and generated the following returns:
It’s an extremely small sample size, so it’s important to take this data with a grain of salt. Nonetheless, it’s an encouraging sign for risk-assets in general.
If we examine the price chart for Bitcoin, I’m still focused on the same key price structure:
The breakout above the green trendline is a very bullish development, potentially signaling a trend reversal to the upside. The red trendlines have continued to act as support at the lower-bound, pushing price higher after each retest since January 2021.
I want to specifically call attention to the 45-day Williams%R indicator at the bottom of the chart. This allows us to view where the price of Bitcoin is relative to it’s 45-day history. Within an uptrend, a full oscillation from “oversold” (lower-bound) to “overbought” (upper-bound) can be used to indicate a momentum thrust to the upside. This full oscillation has only occurred three times since March 2020, with the most recent signal happening this past week. The prior two instances reflect bullish conclusions:
May 6, 2020: Bitcoin’s price closed at $9,335.
1 month later: $9,800 (up +5%)
3 months later: $12,035 (up +29%)
6 months later: $15,465 (up +66%)
12 months later: $55,925 (up 500%)
August 5, 2021: Bitcoin’s price closed at $40,975.
1 month later: $50,210 (up +22.5%)
3 months later: $61,075 (up +49%)
6 months later: $44,155 (up +7.8%)
12 months later: N/A
This signal has been able to produce strong returns, therefore I’m optimistic about Bitcoin in this environment.
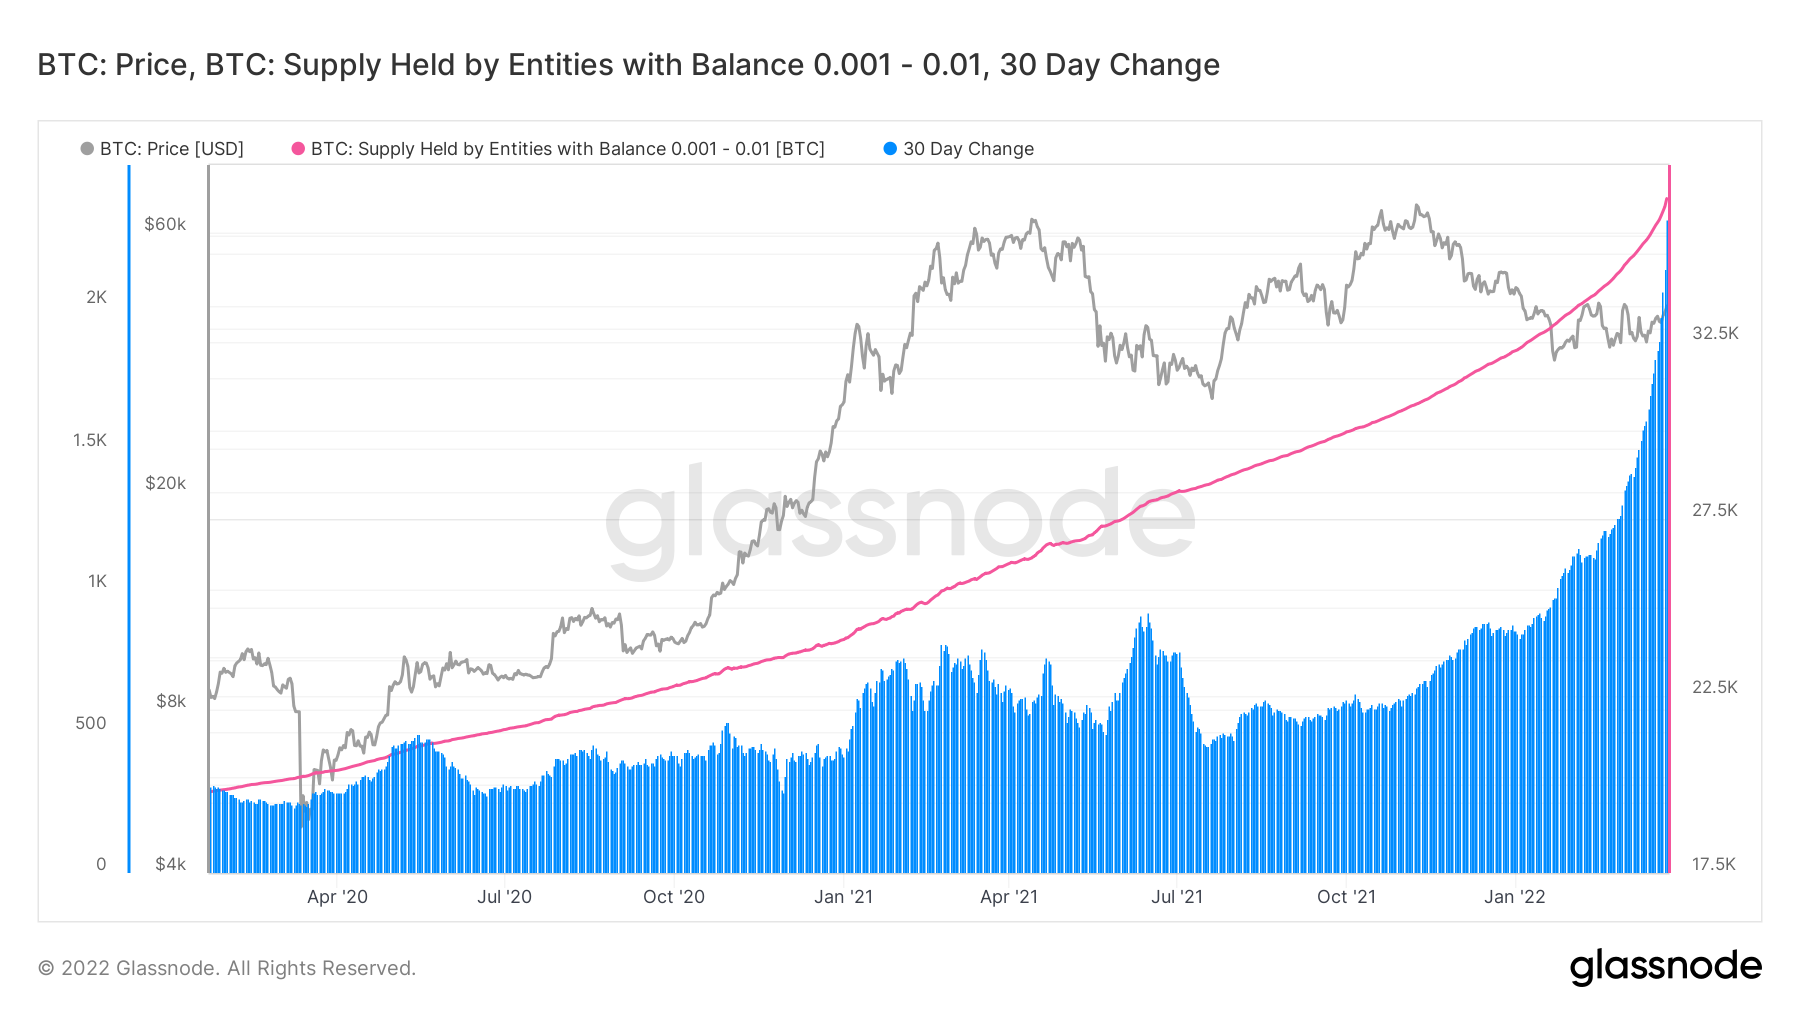
As a final note, I wanted to share some on-chain data from Twitter account @PricedInBTC:
The chart shows the total amount of Bitcoin held by wallets containing between 0.001 and 0.01 BTC, currently valued at $44.42 - $444.27. These small wallets have been increasing their Bitcoin exposure exponentially, as reflected by the 30-day change shown in blue. These wallets collectively hold over 32,500 BTC, equivalent to $1.44Bn. Considering that the total market cap of Bitcoin is $843Bn, the BTC held in these wallets is relatively insignificant relative to the total value of the digital asset. However, it’s worth noting that the adoption by these small wallets (aka investors who are dipping their toes into Bitcoin) is consistently increasing.
Adoption ↑ Value of the network ↑ Price ↑
Talk soon,
Caleb Franzen
DISCLAIMER:
My investment thesis, risk appetite, and time frames are strictly my own and are significantly different than that of my readership. As such, the investments & stocks covered in this publication are not to be considered investment advice and should be regarded as information only. I encourage everyone to conduct their own due diligence, understand the risks associated with any information that is reviewed, and to recognize that my investment approach is not necessarily suitable for your specific portfolio & investing needs. Please consult a registered & licensed financial advisor for any topics related to your portfolio, exercise strong risk controls, and understand that I have no responsibility for any gains or losses incurred in your portfolio.


