Edition #160
Fed Walks the Walk, Stocks Launch Higher, Bitcoin Showing Strength
Economy:
For the first time since December 2018, the Federal Reserve hiked interest rates by +0.25% on March 16th, 2022 . This officially marks the end of quantitative easing as a monetary policy tool to combat the economic downturn caused by COVID, though the Fed will certainly embrace QE in future recessions and financial crises. When the Fed announced the start of tapering in November 2021, that was the beginning of the end of monetary stimulus; however, the Fed has now crossed the inflection point to conducting outright monetary tightening in order to fight inflation.
With the regime change underway, I thought it would be useful to see the current state of affairs in regards to monetary economics.
1. The Fed’s balance sheet reached $8.95Tn this week, relative to $4.17Tn on January 1, 2020. This means that the Federal Reserve has purchased $4.78Tn worth of Treasuries & mortgage-backed securities from financial institutions and commercial banks. Where did that $4.78Tn come from? It was “printed” by being digitally deposited into the accounts of commercial banks in exchange for Treasuries & MBS. Here’s the Fed’s total assets since 2003:
2. Money supply, as measured by M2, has accelerated at an historic rate. Since December 31, 2019, M2 has increased by +42.5% from $15.325Tn to $21.840Tn, as of January 2022.
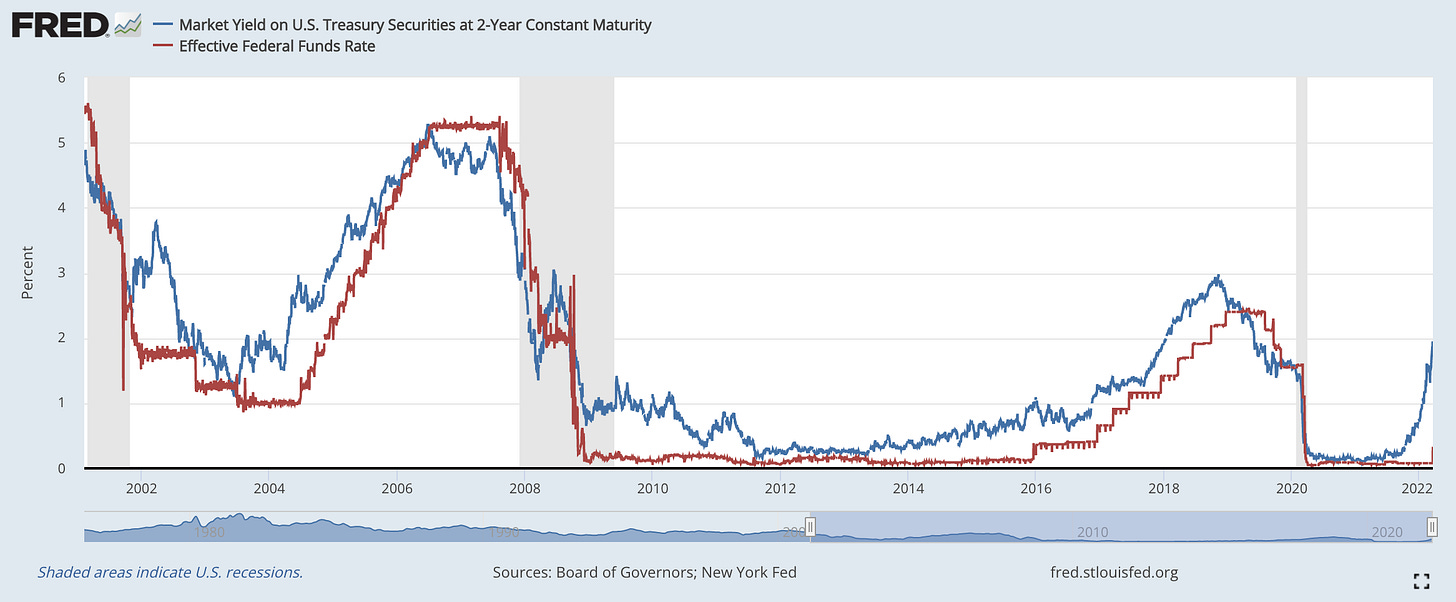
3. While the Fed has continued to provide monetary stimulus, markets have been adjusting to inflationary dynamics, economic conditions, and risk. Yields on short-term bonds have been rising dramatically. Historically, the 2-year Treasury yield has been perfectly correlated with the federal funds rate. The chart below shows how significant the Fed’s artificial suppression of interest rates was, indicating that there’s a lot of room to catch up:
4. In response to decreased asset purchases from the Federal Reserve, shorter maturity Treasury yields have been rising at an accelerated pace relative to longer maturity yields. This has produced a “flattening of the curve”, a term used to describe how yields at different maturities are changing relative to each other. We can evaluate these dynamics in multiple ways:
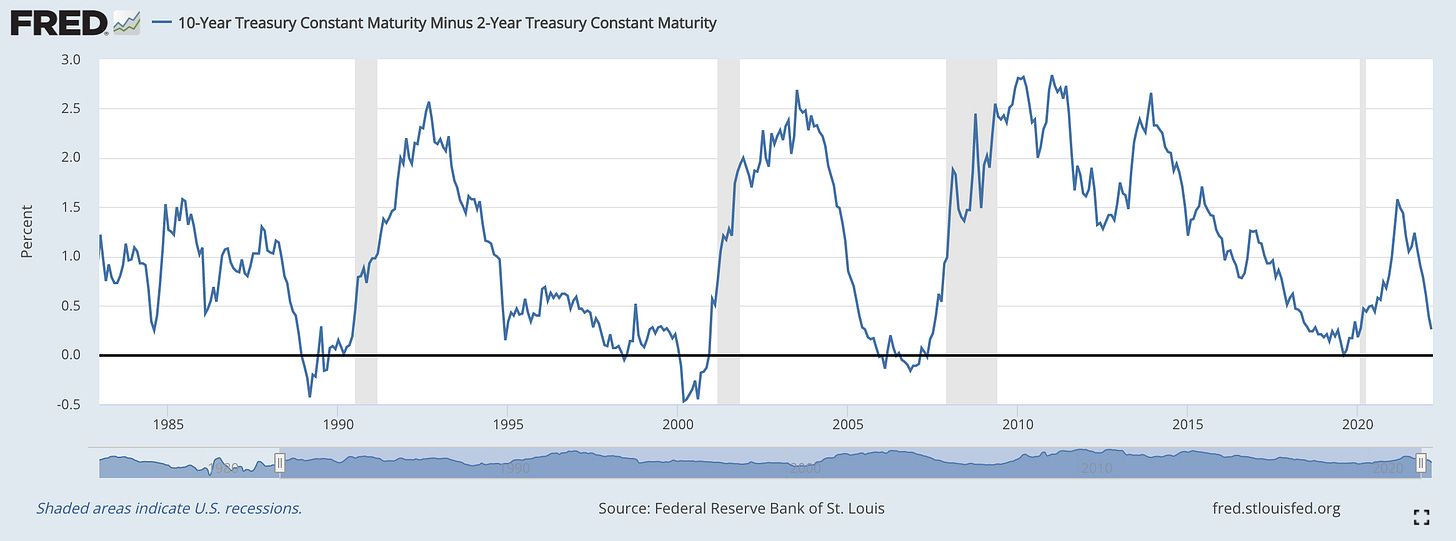
10-year Treasury yield minus the 2-year Treasury yield: As of 3/17, the differential is 0.26%. As we can see in the chart below, an inversion of this relationship (when the 10-year yield is less than the 2-year yield) has been an excellent signal of an imminent recession (grey regions).
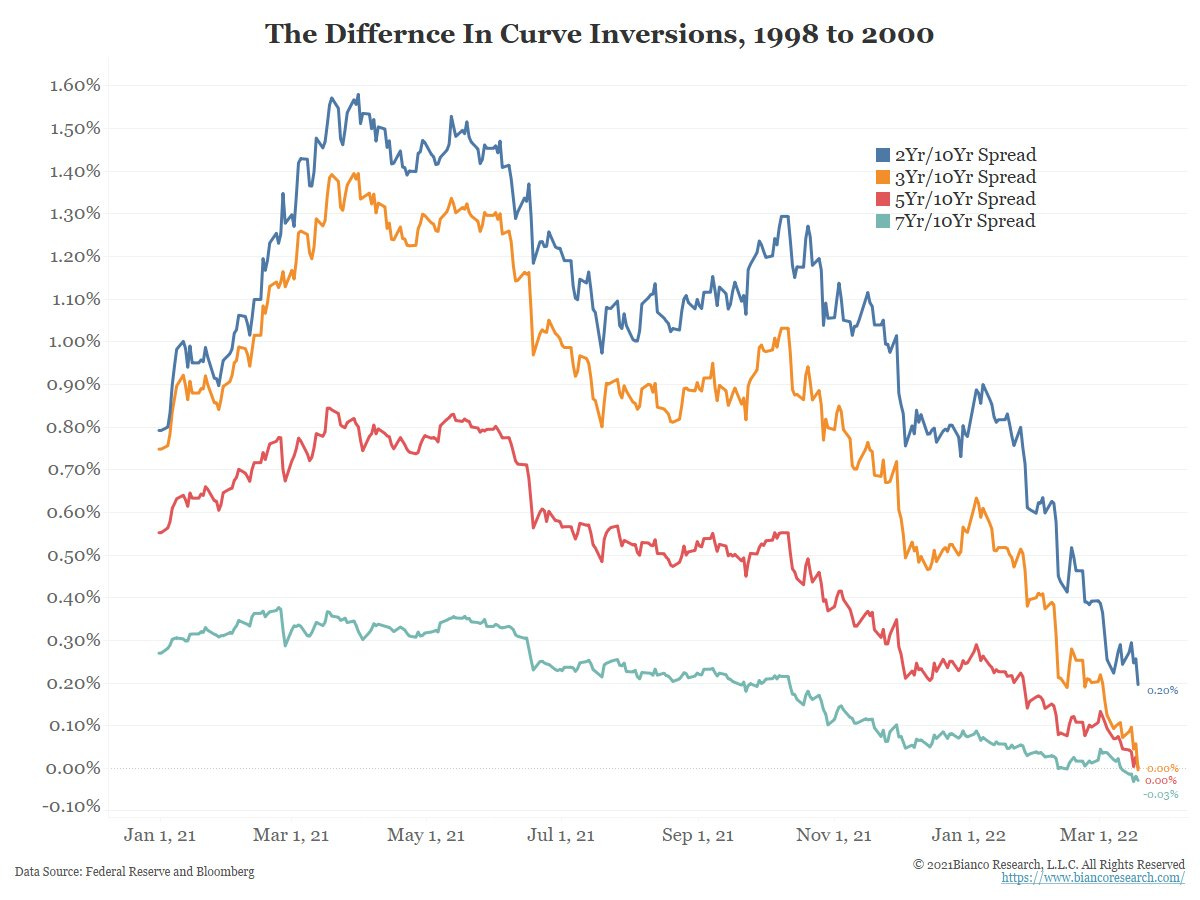
The following chart from Jim Bianco shows the spread between various maturities, indicating that “the curve inverts from the inside out”:
Finally, the actually yield curve. This chart shows the yield earned from various maturities at the present moment, relative to their position 1-month and 6-months ago. The curve is clearly being pulled up and to the left, indicating that short-term yields are rising at a faster pace than long-term yields.
So what does all of this mean and how do I foresee these dynamics evolving?
Unequivocally, yield curve dynamics show how financial conditions are getting tighter and how bond investors are perceiving worrisome market conditions. I’m specifically referring to two things:
Inflation is expected to worsen. Because inflation and yields are positively correlated, consider short-term yields a real-time view of how the market is viewing inflationary dynamics.
Short-term economic conditions are becoming less optimistic and/or more uncertain. Treasury yields are a gauge of risk, indicating what investors are guaranteed to earn on their money. If an investor believes that likelihood of getting repaid is decreasing, they’ll demand a higher rate of return to compensate for that risk. Rising yields is therefore indicative that market participants are concerned about short-term economic conditions. In light of decelerating economic growth, a tight labor market, a 40-year high inflation rate, and geopolitical conflict, it makes sense why short-term outlooks are more uncertain.
As the Fed officially transitions towards contracting monetary supply, M2 should flatten out and their balance sheet should begin to shrink. The market is currently expecting consistent but gradual rate hikes for the remainder of 2022, based on the existing outlook for economic conditions. Personally, I don’t think this approach will have a meaningful impact to suppress inflationary pressures. I fully expect to see the 12-month inflation rate exceed +9.0% within the next three reports (March - May 2022).
To wrap this section up, there were critically important quotes this week by various Fed officials that help to highlight the Fed’s aggressive tone to raise interest rates:
“The labor market is so tight, it’s unhealthy.” - Jerome Powell
“We’d like to slow demand.” - Jerome Powell
The current policy rate is “far too low to prudently manage” inflation. - James Bullard
“Data is screaming at us to do 0.5% increase, but geopolitical events call for caution.” - Christopher Waller
“I would shrink the balance sheet at double the pace versus last time.” - Neel Kashkari
Again, the Fed is verbally committed to fighting inflation but their actions haven’t been congruent with their rhetoric. Now that they have begun tightening, will we see a follow-through in their actions?
Stock Market:
U.S. markets absolutely ripped this week, contrary to what I was expecting amidst general market weakness and the FOMC policy decision. In my premium market report last weekend, I outlined key market structure that signaled signs of caution.
Markets have seemingly rallied on the fact that the Fed raised interest rates by +0.25%, rather than the potential +0.5% rate hike that many market participants were still pricing in. It’s also possible that this was a “sell the rumor, buy the news” event, in which investors & traders had been fearing a potential rate hike and therefore shorted the market. Now that the rate hike has taken place, fear has subsided and these investors have closed their trade. In doing so, market participants have rotated from sellers to buyers, therefore causing a rally in U.S. equities.
This is just a theory, so I expect my perception will change as more time passes. It’s worth noting that of these news-driven events lead to short-term catalysts that can fade rather quickly. Next week will be important for equity investors to see continued demand for risk-assets and U.S. equities in order to increase confidence in a market rally.
In support of the bullish case for U.S. stocks, I saw a great chart from Carsten Valgreen on Twitter, reviewing the S&P 500’s performance immediately after entering a -10% drawdown in cases where there wasn’t a recession within twelve months of the -10% correction:
This chart shows how the market performs once the S&P 500 crosses a -10% correction, absent a recession in twelve months, over the subsequent 100 days. The S&P 500 is currently close to the lower-bound of the data, indicating that we’re in a unique scenario. Considering that the median return over the first 100 days is +11%, investors who believe that the U.S. economy will remain strong over the next twelve months should be enthused.
Financial markets are forward-looking indicators, therefore equity prices are cognizant that the Fed expects to raise rates seven times this year. While I’m happy to see the resilience in U.S. stocks and a momentum thrust higher, I still remain very cautious about taking on new risk. In my opinion, this is not the time to buy high-risk equities like non-profitable tech, and I’m much more attracted to value stocks that pay a high dividend and have announced substantive stock-buyback programs over the past year.
As an example, Vanguard’s High Dividend Yield ETF, $VYM, is currently up +0.25% YTD. While this may seem insignificant, it’s important to recognize that the S&P 500 is down -6.4% YTD and the Nasdaq-100 is down -11.6% YTD. In a market environment where rates are expected to rise, I think higher volatility should be expected. As such, I would emphasize exposure to low-beta stocks that offer better downside protection over tech stocks.
Bitcoin:
First & foremost, Bitcoin’s price has remained very stable and strong over the past few weeks. This shows great resilience and could be bullish in the event that we see a broad-market rally in U.S. stocks. In terms of the price structure, I’m still watching the same key levels:
Bitcoin is retesting the green wedge from the November 2021 ATH’s. If we can break above this level over the weekend, I think it’s reasonable to expect a return to $45k rather quickly. There’s an intermediate white price level on my chart, right at $45.5k, which has acted as both support & resistance since Q4 2021. If we break above the green trendline (still a big “if”), I’ll be on alert to see how price reacts to the $45.5k level. Bitcoin is generally trading in no man’s land, fluctuating within a well-defined consolidation zone. Until we start to see confirmed breakouts above potential resistance, I’m remaining extremely patient and expect to see further fluctuations within the consolidation zone.
I also want to call attention to the Williams%R oscillator at the bottom of the chart. The indicator is coiling around the lower-bound of the oscillation range, referred to as the “oversold” threshold. If we can see a substantive extension higher in this oscillator, I think that will increase bullish probabilities.
Interestingly, Bitcoin’s YTD performance is -8.7% in 2022, compared to -11.6% for the Nasdaq-100. Most of Bitcoin’s downside was felt between early November through mid-January, having gained +27.5% from the YTD lows.
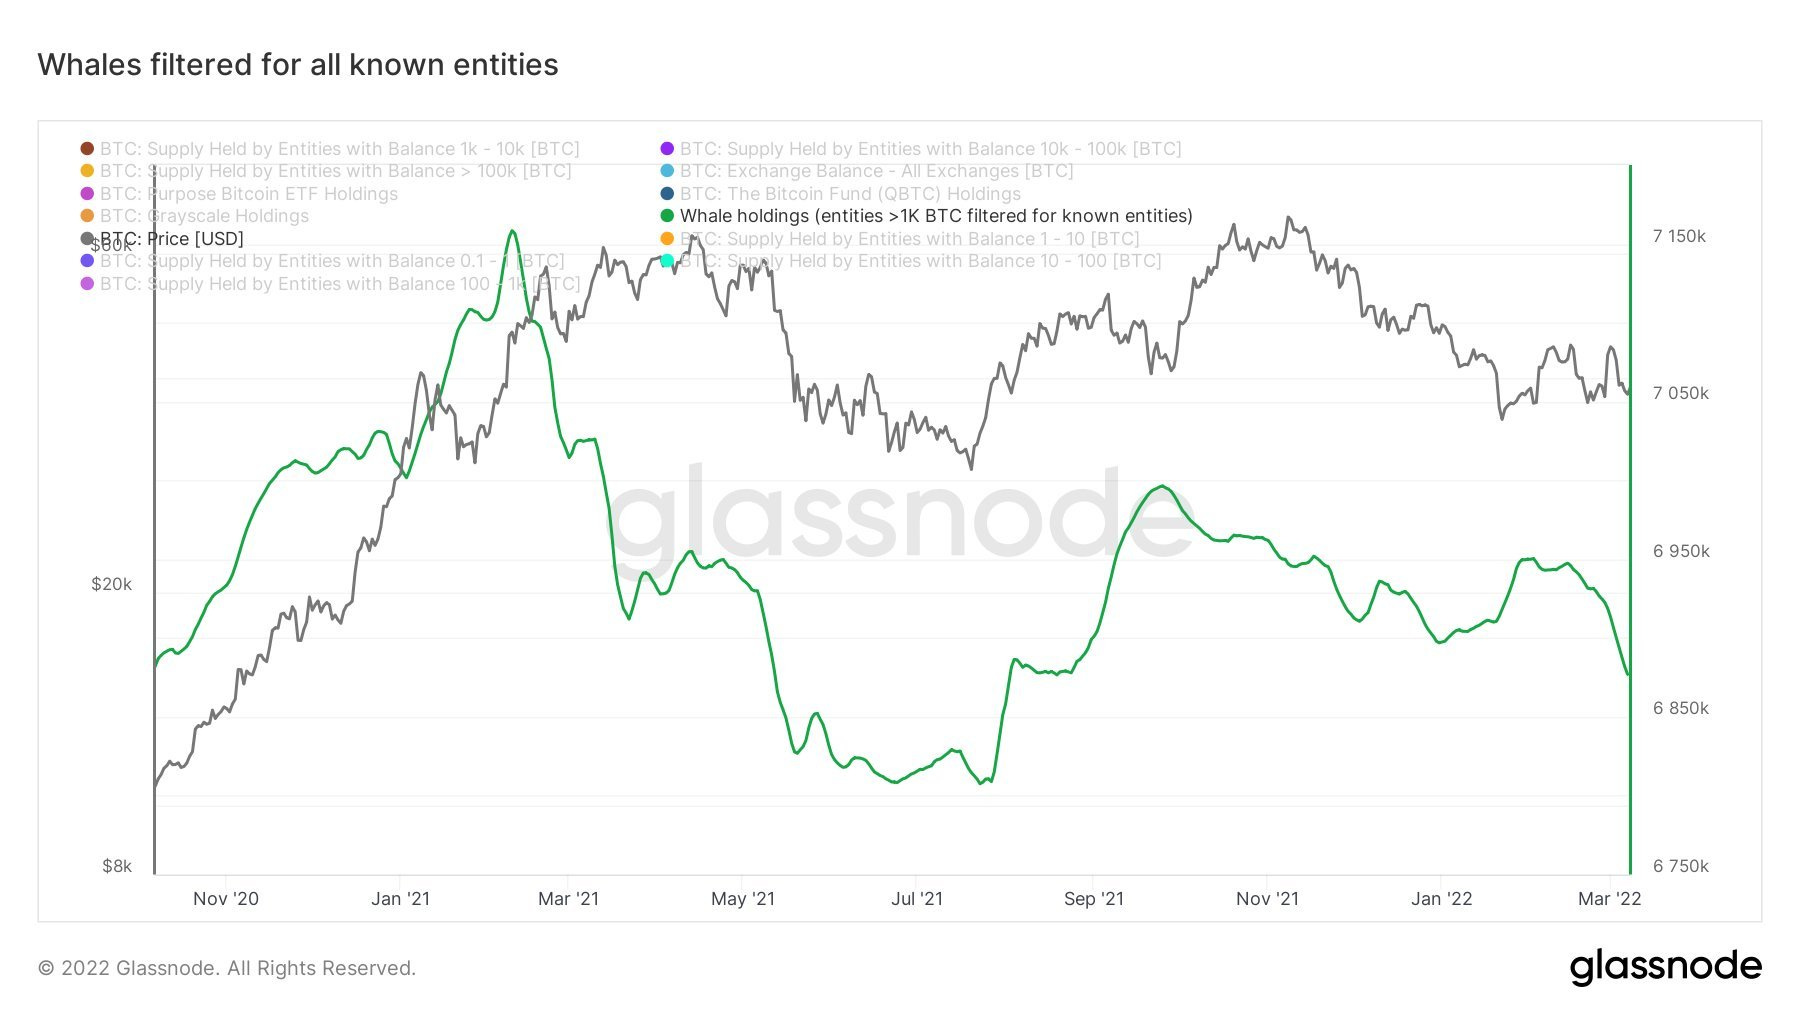
On a final note, I wanted to share some on-chain data to analyze the trends and behavior of large Bitcoin wallets. In the chart below, we’re tracking the number of Bitcoin held in wallets with at least 1,000 BTC.
Generally speaking, we can see that the number of Bitcoin held by “whale wallets” has decreased substantially since the the peak in Q1 2021, indicating that large investors have been reducing their Bitcoin position during this 15-month consolidation. Based on this data, it appears there are 6.87M Bitcoin held in these wallets, relative to the total supply of 18.987M BTC. While there have been periods of increasing supply held by whale wallets, the general trend over the past fifteen months is to the downside.
Logically, this makes sense as Bitcoin investors naturally take profits and potentially de-risk their portfolio. Perhaps these investors are even moving further out onto the risk curve, using their former Bitcoin holdings to rotate into other crypto assets. The way I view it, these wallets are one representation of high-conviction Bitcoin investors. In an ideal situation, I’d like to see these investors increase their Bitcoin holdings as a representation that “smart money” is regaining bullish sentiment. While we continue to consolidate in a sideways manner, I think this is within the realm of reason and it’s certainly something I’ll continue to watch going forward.
Talk soon,
Caleb Franzen
DISCLAIMER:
My investment thesis, risk appetite, and time frames are strictly my own and are significantly different than that of my readership. As such, the investments & stocks covered in this publication are not to be considered investment advice and should be regarded as information only. I encourage everyone to conduct their own due diligence, understand the risks associated with any information that is reviewed, and to recognize that my investment approach is not necessarily suitable for your specific portfolio & investing needs. Please consult a registered & licensed financial advisor for any topics related to your portfolio, exercise strong risk controls, and understand that I have no responsibility for any gains or losses incurred in your portfolio.


