Edition #15 - 6.4.2021
Unemployment Claims, Russell 2000 Makes a Pivotal Rejection
Economics:
The headline news today in terms of economics was the data surrounding unemployment with the release of initial unemployment claims as well as updates on continuing unemployment. Per the weekly report from the Department of Labor, initial unemployment claims for the week ending 5/29/2021 were 385,000 vs. 405,000 in the prior week. This was the lowest amount of initial claims since March 14, 2020 and puts the 4-week moving average at 428,000. Considering the trajectory we’ve been on, this is about as solid of a report as we could hope for as the labor market continues to trend in a positive direction.
I saw a great chart from Oxford Economics, which helps to illustrate the improvements the U.S. economy has seen in terms of initial unemployment claims.
Considering that the week ending January 9, 2021 had initial claims of 904,000, we’ve clearly made significant progress so far YTD & my expectation is that the trend will accelerate faster, particularly in the fourth quarter of 2021.
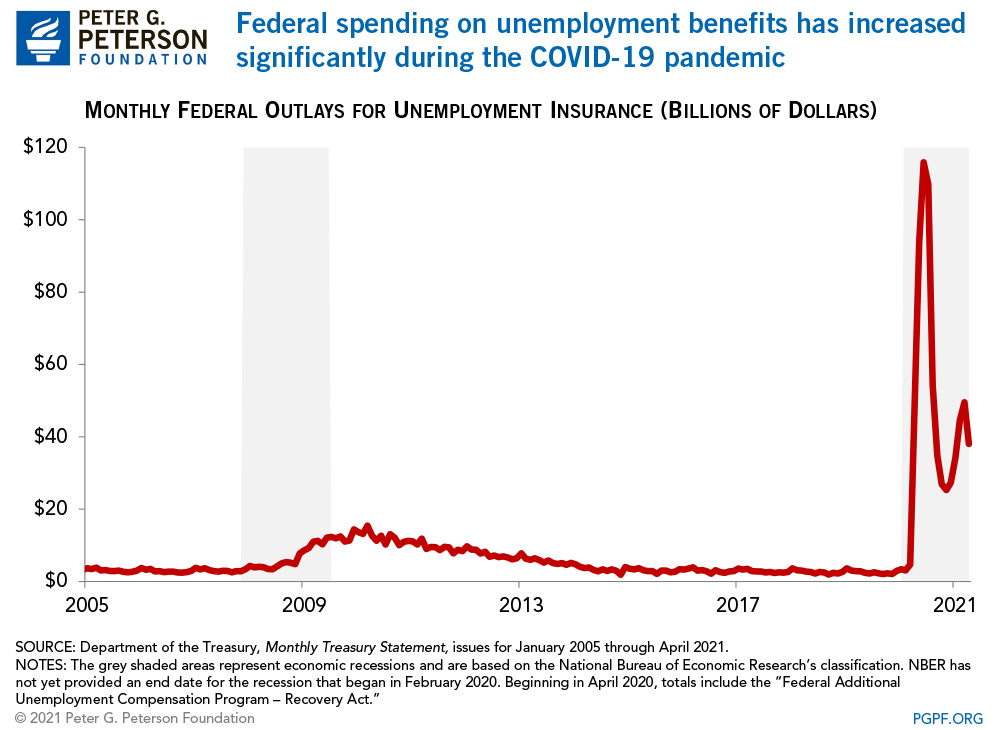
With that being said, I was curious to see how much the Federal government is spending on unemployment benefits, particularly in a historical context. I was able to find the following chart from the Peterson G. Peterson Foundation which was published in mid-May 2021 for Federal monthly expenditures, with the most recent data point being April 2021.
We’re currently in the $30Bn/month range, which is nearly twice as high as the peak from the Great Recession. Once again, still a lot of room to go & this also helps to shed some light on the tremendous amount of fiscal stimulus required for unemployment benefits alone.
Stock Market:
In Edition #12 that I released on 6/1/2021, I showed two important charts of the S&P 500 and the Russell 2000 which highlighted the price structure over the last 18 months. As it relates to the Russell, there were some key developments that have materialized over the course of the three trading days so far this week. While the chart that I shared on Tuesday morning had daily candlesticks over the last 18 months, the chart below is zoomed in with 4hr candlesticks starting on January 1, 2021.
In the analysis that I previously shared, I highlighted that the small-cap index was moving in a fairly tight consolidation range. The upper-bound was comprised of two factors: the descending white trend lines & the grey region between $2,300-$2,316. Similarly, the lower-bound was given by the ascending white trend line & the grey zone of $2,065-$2,085. At the time of Tuesday’s newsletter, the price of the index was pressing against the upper-bound of the white wedge. With the initial breakout to start the week, I felt fairly encouraged, but was aware that the index could still face resistance at the grey zone. This is why I was not surprised by today’s performance of -0.81% considering that we closed the Wednesday session retesting the overhead resistance level.
This is one of the several reasons why I rely heavily on technical analysis to plan my trading activity & forecast market movements. While they may not work with 100% certainty, they at least allow me to understand price structure & see where price may react in a positive or negative way. Today’s rejection from the $2,300 level could be over tomorrow, or it could continue lower (as it has during previous rejections). I’ve drawn dotted purple lines to show the prior rejections from the upper-bounds, in which price has dropped to the rising white trend line at the lower-bound every time. At the present moment, a decline to the white trend line would imply a -5.5% correction, which is very minimal in the grand scheme of things but is something that should be mentally prepared for. Is it the most likely case scenario? Not necessarily, but it’s an outcome that should be accepted. It will be interesting to see how the price structure continues to develop.
Cryptocurrency:
No major news or exciting information. The price of Bitcoin & Ethereum continue to move sideways since yesterday’s newsletter & there haven’t been any major developments in terms of fundamental news, on-chain analysis, or sentiment changes.
Until tomorrow,
Caleb Franzen


