


Edition #148
Labor Market Booms, Stocks Indecisive, Bitcoin Makes a Move Higher

To investors,
As a quick reminder & follow-up to my announcement this week, I want to remind everyone that these newsletters will now be published on a weekly cadence instead of bi-weekly. There are no changes being made to the quality or format of the newsletter, only the frequency of the free publications. There are no changes being made to my premium subscription content.
Please reach out directly if you have any questions!
Economy:
The economic data released this past week was very focused on the U.S. labor market, which showed encouraging signs about the U.S. economy. There were three major reports pertaining to the labor market this week:
December 2021 JOLTS;
Weekly unemployment claims; and
January 2022 non-farm payroll.
Here’s the most important stuff I think you should know:
Regarding the Job Openings & Labor Turnover Survey (JOLTS), there were 10.925M job openings as of 12/31/2021 vs. 10.6M at the end of November 2021. For the past several months, the U.S. economy has continued to fluctuate around 11M job openings, well-above the pre-pandemic trend.
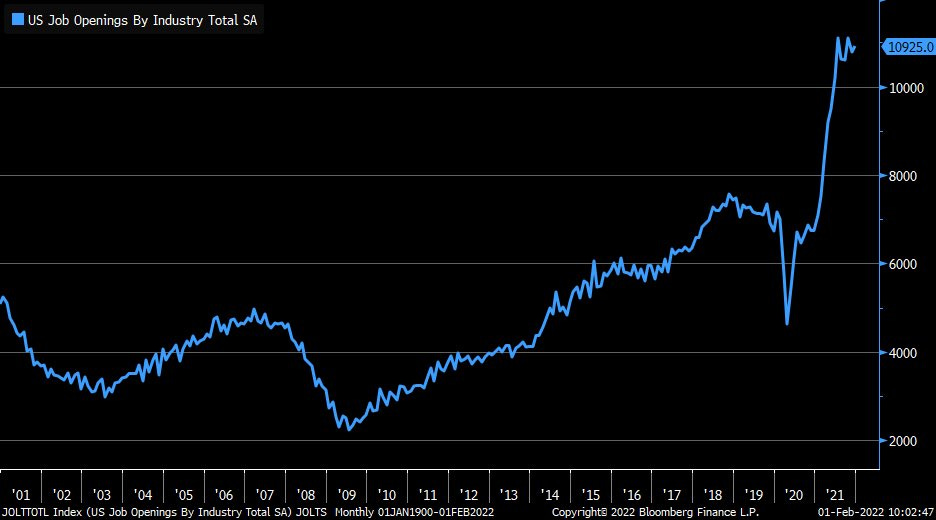
Companies, perhaps struggling to retain talented employees, had the lowest layoff rate since data has been collected at 0.8%. Businesses seem content on expanding their labor force and are still focused on hiring talent employees. Potential job opportunities are plentiful, reflecting that employees are able to find roles that better suit their interests, passions, skills, and salary expectations. The private-sector quits rate remains elevated at 3.2%, helping to confirm the abundance of labor opportunities and a flexible labor force.
Moving onto the weekly unemployment claims, consensus estimates were expecting to see 245,000 initial jobless claims. The result of 238,000 was a modest surprise, confirming a strong general trend of an improving labor market. Continued unemployment claims stand at 1.63M, down from the prior week of 1.67M. The chart below shows both of these data points in their historical context. The takeaway is that we’re essentially in-line with the pre-pandemic levels.

The biggest report for the week came on Friday morning with the non-farm payroll data for January 2022. Estimates were calling for a gain of 150,000 jobs, but the data came in significantly higher at 467,000. It seems estimates were so low in light of the economic concerns from Omicron, but the labor market seemed to shrug it off entirely. Additionally, the December 2021 data, which was initially reported to be an increase of 199,000 jobs, was revised higher to 510,000. All in all, this was a massive report.
The non-farm payroll data also includes important information on several other labor market statistics:
• The unemployment rate ticked higher to 4.0% from 3.9%
• The labor force participation rate increased to 62.2% from 61.9%. This is the highest reading for the LFPR since the pandemic began, and has been a key focus of mine to confirm a healthy & strong recovery in the labor market. I’m extremely happy to see this data point accelerate higher!

• Nominal wages were up +0.7% relative to the prior month, and up +5.7% on a year-over-year (YoY) basis. This is also an encouraging sign; however, we must consider that the current reading for the 12-month inflation rate is +7.0%. As such, we could conclude that real wages are actually down by -1.3% YoY. This is something worth our concern.
In total, the labor market data from this week was very strong and reflected encouraging signs for the U.S. economy. In my opinion, this gives the Federal Reserve additional reassurance that the economy could withstand higher interest rates, and likely removes any doubts that we are at/near maximum employment. In response to each of these reports, Treasury yields rose higher. Below is the 10-year Treasury Yield Index, $TNX, since January 2020:
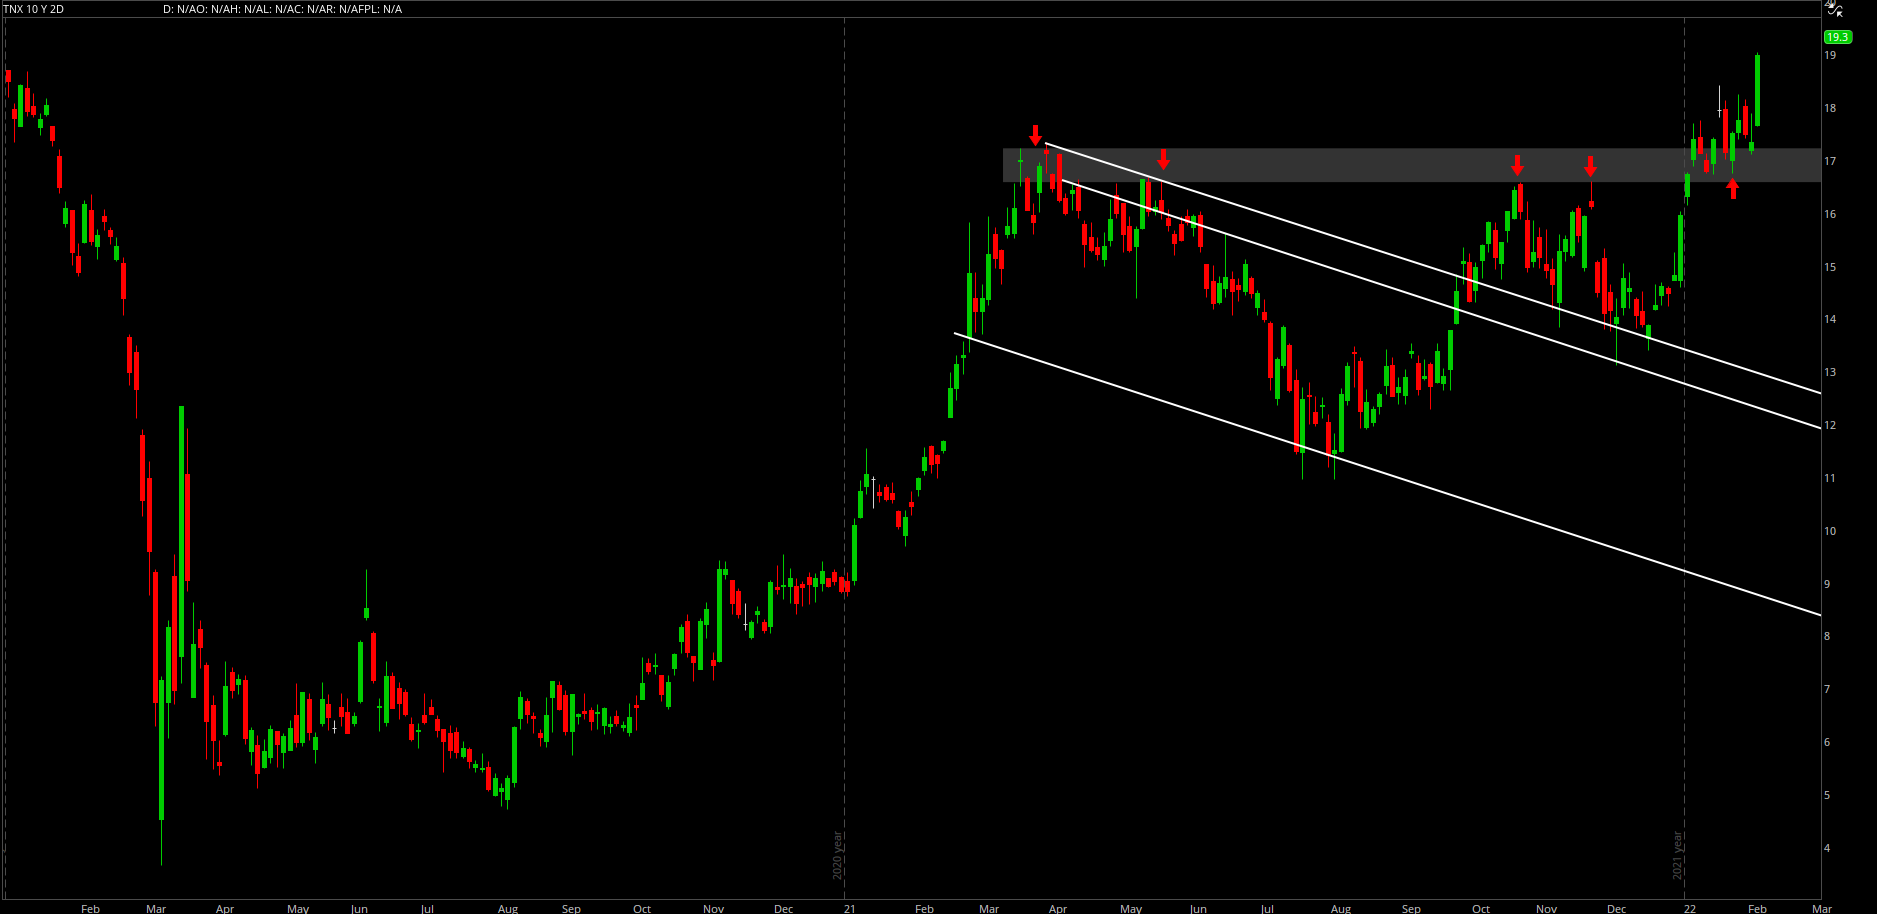
On December 3, 2021, the yield on 10-year U.S. Treasuries was at 1.34% vs. a current level of 1.916% as of February 4, 2022. This is definitely a rapid increase as the markets have begun to price-in higher & higher interest rates due to monetary policy, inflation, and economic growth expectations.
Stock Market:
With 10-year yields continuing to accelerate higher, it’s understandable why U.S. stocks have faced pressure and choppy market conditions. “Choppy” is likely the more appropriate term over the past three weeks, seeing wild swings in both direction. For the recent week, the major U.S. indexes had the following returns:
• Dow Jones Industrial Average ($DJX): +1.05%
• S&P 500 ($SPX): +1.55%
• Nasdaq-100 ($NDX): +1.67%
• Russell 2000 ($RUT): +1.75%
While each of the indexes closed higher relative to the prior week, each of them had fallen substantially from the intra-week highs:
• $DJX: -1.65% from weekly highs
• $SPX: -2.07% from weekly highs
• $NDX: -3.33% from weekly highs
• $RUT: -2.5% from weekly highs
In the midst of earnings season, there was massive news from Facebook’s Q4 2021 earnings report. While revenue was up +20% YoY, reaching $33.67Bn for the quarter, total costs & expenses increased by +38%. As such, their profitability decreased to a net income of $10.285Bn, representing a decrease of -8% relative to Q4 2020. In response to the miss on earnings and anemic user growth, shares fell -26% the day after the release.
According to data from Bloomberg, the $252Bn loss of market cap was the largest single-day decline in history.

This created a lot of concern for U.S. tech & growth stocks, resulting in the Nasdaq-100 falling by more than -4% on Thursday’s session.
The earnings from Alphabet (Google) caused the market to cheer on Wednesday, then weep on Thursday from Meta (Facebook), and then cheer again on Friday after strong numbers from Amazon. With the big dogs out of the way, I expect decreased market volatility due to earnings. Nonetheless, I’m extremely focused on the rapid rise in Treasury yields, which will continue to generate increased volatility for U.S. stocks.
Recall, my “Investment Outlook for 2022” called for an 80% chance of below-average returns this year, specifically due to the rate environment and the monetary policy outlook. So far, that outlook has been justified through the first month of the year.
Cryptocurrency:
Crypto markets continue to trade significantly below their 2021 highs. After experiencing a -53% drawdown from peak to trough (for now), Bitcoin has begun to rally back over $40k during Friday’s session. This is a sign of optimism for crypto bulls after a severe digestion and market recalibration.
During the entire drawdown, I’ve been sharing important charts on Twitter to highlight what I’m seeing in terms of the price structure. As it pertains to Bitcoin, here’s one worth watching closely:

As we can see in the chart above, the yellow/grey band has been a very important range for Bitcoin. It has acted as either support or resistance every single time it has been touched. Since we fell beneath that range in January, I’ve been concerned that it will act as resistance during the next retest. We’re about to find out.
Breakout = bullish.
Rejection = bearish.
In terms of the fundamentals, Lex Moskovski shared excellent data to show Bitcoin’s illiquid supply. Recall, the illiquid supply is the aggregate amount of Bitcoin stored in cold wallets outside of exchanges. This would essentially be like transferring your Bitcoin from your Coinbase/Gemini/Kraken account and onto your own personal hardware/software wallet.

Illiquid supply, ie. Bitcoin that is not available for sale, is currently at all-time highs. Unlike the correction we experienced in May - July 2021 where illiquid supply decreased, Bitcoin holders are staying extremely resilient. In April & May 2021, Bitcoin investors transferred BTC back into their exchange accounts at a rapid rate in order to sell and reduce their positions. Slowly but surely, investors began to accumulate BTC in off-exchange wallets, particularly beginning in June 2021. Since then, Bitcoiners haven’t stopped.
I continue to believe that the recent decline in Bitcoin’s price is the most attractive risk/reward opportunity in the market, for short, medium, and long-term time horizons. The on-chain data is encouraging, and I’m starting to see signs of encouragement on the price chart as well.
Talk soon,
Caleb Franzen
DISCLAIMER:
My investment thesis, risk appetite, and time frames are strictly my own and are significantly different than that of my readership. As such, the investments & stocks covered in this publication are not to be considered investment advice and should be regarded as information only. I encourage everyone to conduct their own due diligence, understand the risks associated with any information that is reviewed, and to recognize that my investment approach is not necessarily suitable for your specific portfolio & investing needs. Please consult a registered & licensed financial advisor for any topics related to your portfolio, exercise strong risk controls, and understand that I have no responsibility for any gains or losses incurred in your portfolio.