Economy:
In light of continued inflationary pressures, market participants are becoming increasingly focused on real yields. By offsetting a nominal yield by the inflation rate, investors and market participants can better assess the true yield or cost of an asset. Len Kiefer, the Deputy Chief Economist at Freddie Mac, shared some insightful data pertaining to real mortgage rates. Homeowners with a fixed mortgage rate benefit from inflation because inflation decreases the purchasing power of the debt they need to repay. Essentially, higher inflation can make the mortgage more affordable, assuming that the interest rate on the loan is fixed.
This data shows that the rate of inflation is outweighing the average 30-year fixed rate mortgage by a considerable amount. If real mortgage rates are negative, homeowners are essentially getting paid to build equity in their home! Under this context, it’s obvious why the housing market has been so hot over the past 24 months — the real cost of a mortgage was at historical lows in 2020 and then flipped negative in 2021. At a negative cost, the incentive structure is providing clear signals to investors and homebuyers: get paid to own a mortgage and simultaneously build equity in a home.
Investors could take this sweet deal, then consider to refinance in the near future, pull the equity out of the home via a home equity line of credit, then use those funds to put money down on a new home, all by leveraging the bank’s money.
The last time real mortgage rates were this low was in the mid-1970’s, but it was rather short-lived. In light of double-digit inflation in the late-1970’s, Paul Volcker of the Federal Reserve raised the federal funds rate from 10% to 19.7% between 1979 and 1980. We can see how the federal funds rate has evolved since 1977 in the chart below:
Currently, the effective federal funds rate is 0.08%…
While it seems imminent that the Federal Reserve will end their tapering schedule and begin raising rates in the coming months, it’s important to recognize a key characteristic of this chart. In each of the tightening periods, the Fed hasn’t been able to raise rates back above their prior peak. Essentially, each rate hike period produces a lower high amidst a generational downtrend in rates. Considering that the last period of monetary tightening peaked at 2.25% - 2.5%, I think it’s reasonable to expect the federal funds rate will remain below that level during this upcoming tightening schedule. However, if inflation continues to garner upside momentum and reach double-digits over the coming months, despite the Fed’s reduced monetary stimulus, it’s possible that this trend comes to an end.
Stock Market:
On November 23, 2021 I published analysis on Ark’s Innovation fund, $ARKK. Here’s what I said at the time via Twitter:
“Is it possible to track the return of $ARKK excluding $TSLA? It’s clear that the fund is investing in the most innovative companies, and arguably the ones that are most critical to future tech, but the fund is currently -15% YTD and down -33% from the YTD highs. $TSLA is up +63% YTD…
I just pulled $ARKK’s holdings report as of 11/23/21 and the YTD return data on each holding they currently have. The average YTD return is -13.2%. If we exclude $TSLA, it’s -15%. This is an equal-weight average, which isn’t intended to show us $ARKK’s YTD return. Of the 42 stocks they currently own in the fund, 31 have a negative YTD return (26% hit rate). 21 positions in the fund currently have a YTD return worse than -20%. Every -20% loss requires a +25% return to break even. 7 positions in the fund have a YTD return larger than +25%. Along these same lines, there are 8 positions in the fund with a YTD return worse than -50%, but only 2 positions with a return larger than +100%. Essentially, there are a handful of massive losers and not enough winners to offset them. This approach above is weighting agnostic.
On 11/27, I conducted a full deep-dive on this topic for premium Substack members, sharing my expectation that non-profitable tech stocks would continue to bleed over the coming 3-12 months. In that publication, I wrote the following:
“Therefore, on the aggregate, if we want to know how high growth technology stocks will perform going forward, it’s imperative to attempt to understand where rates are headed. As I laid out in my newsletter to all subscribers this morning, yields plummeted during Friday’s session as investors rushed to safety from the new COVID variant; however, it’s most likely the case that yields will rise under the Federal Reserve’s tapering process and liftoff schedule.
As an investor with a time horizon of 3-12 months, I’d be extremely wary to get invested in unprofitable tech/growth stocks barring any material outlook in the trajectory of rates going forward.”
Every week, I share in-depth views on stock market dynamics and share what key factors I’ll be monitoring closely in the coming week. The purpose of these reports is to give investors additional tools to make informed decisions and to help understand why I’m paying attention to certain market dynamics. If you’re interested in receiving these weekly distributions, consider clicking the link below!
Since the original analysis I shared on 11/23, $ARKK has fallen an additional -25.5%. On January 14th, I saw a fantastic post from Brian G. highlighting the similarities between $ARKK and the Nasdaq-100 during the internet bubble:

$ARKK continues to bleed at a rapid pace, and is already down -15.2% in 2022. In Edition #137 on 1/6/22, I shared that the $ARKK was breaking below critical support levels and giving investors a “get out of the way” signal. Based on market dynamics since then, that analysis has proven to be worthwhile. I continue to believe that $ARKK and non-profitable tech/growth stocks will face strong pressures in 2022.
Cryptocurrency:
This past week was an emotional one for most economists and investors. Not only were markets volatile and choppy, but economists had to grapple with important economic data, such as the December 2021 CPI report and the retail sales data. As we reviewed earlier in the week, the December CPI data reflected a 12-month inflation rate of 7.0%. In a fiat monetary system, the inflation rate of the money supply (different than the inflation rate of consumer prices) is determined by central bankers and bureaucrats who whimsically decide to print or destroy money based on economic conditions. Every economic actor within that system is forced to place an exorbitant amount of trust in those central bankers to maintain the value of that currency, but there is never any promise.
M2 money supply has increased from $15.47Tn in January 2020 to $21.43Tn in January 2022. This +38% inflation in the money supply was decided arbitrarily by the Federal Reserve, with no formal consent from people within the U.S. economy or those who use U.S. dollars as a savings mechanism. This inflation rate will continue to fluctuate in perpetuity, however the trend is decisively up. Since 1959, M2 money supply has continued to grow at an exponential rate:
The key point here is that the rate of inflation of the money supply is not constant and is unpredictable in the future. The Federal Reserve could increase the inflation of the money supply at a faster rate at some point in the future. It’s possible to imagine a scenario where the Fed increases money supply by +100% over the span of a few years. What’s stopping them, or any other fiat monetary system, from making those missteps?
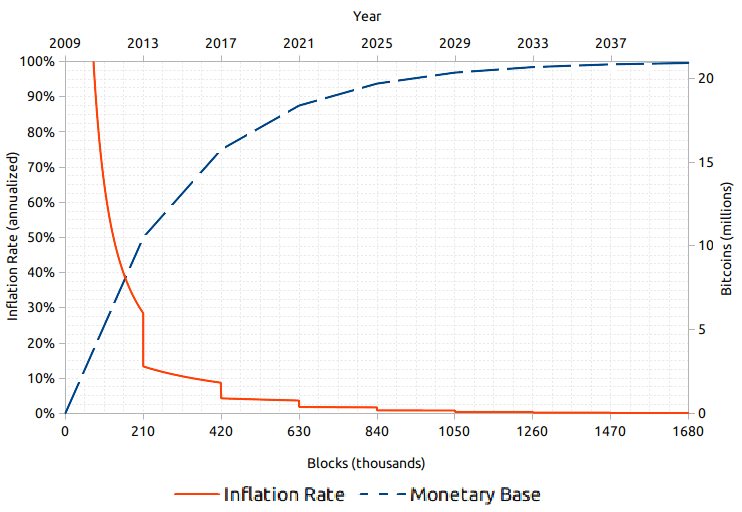
One of the critical value components of Bitcoin is that the monetary system is programmatic, known with certainty, and verifiable, all while being decentralized. There isn’t a small group of elite central bankers deciding the money supply of Bitcoin, it was literally coded into the software when it was released in 2009. The maximum supply of USD is unknown and not verifiable, while Bitcoin’s total supply is capped at 21 million BTC. Even if we wanted to know the amount of USD in existence, we are forced to rely on data from the Federal Reserve, meanwhile anyone can run and operate a node to verify the blockchain and the money supply of the Bitcoin network.
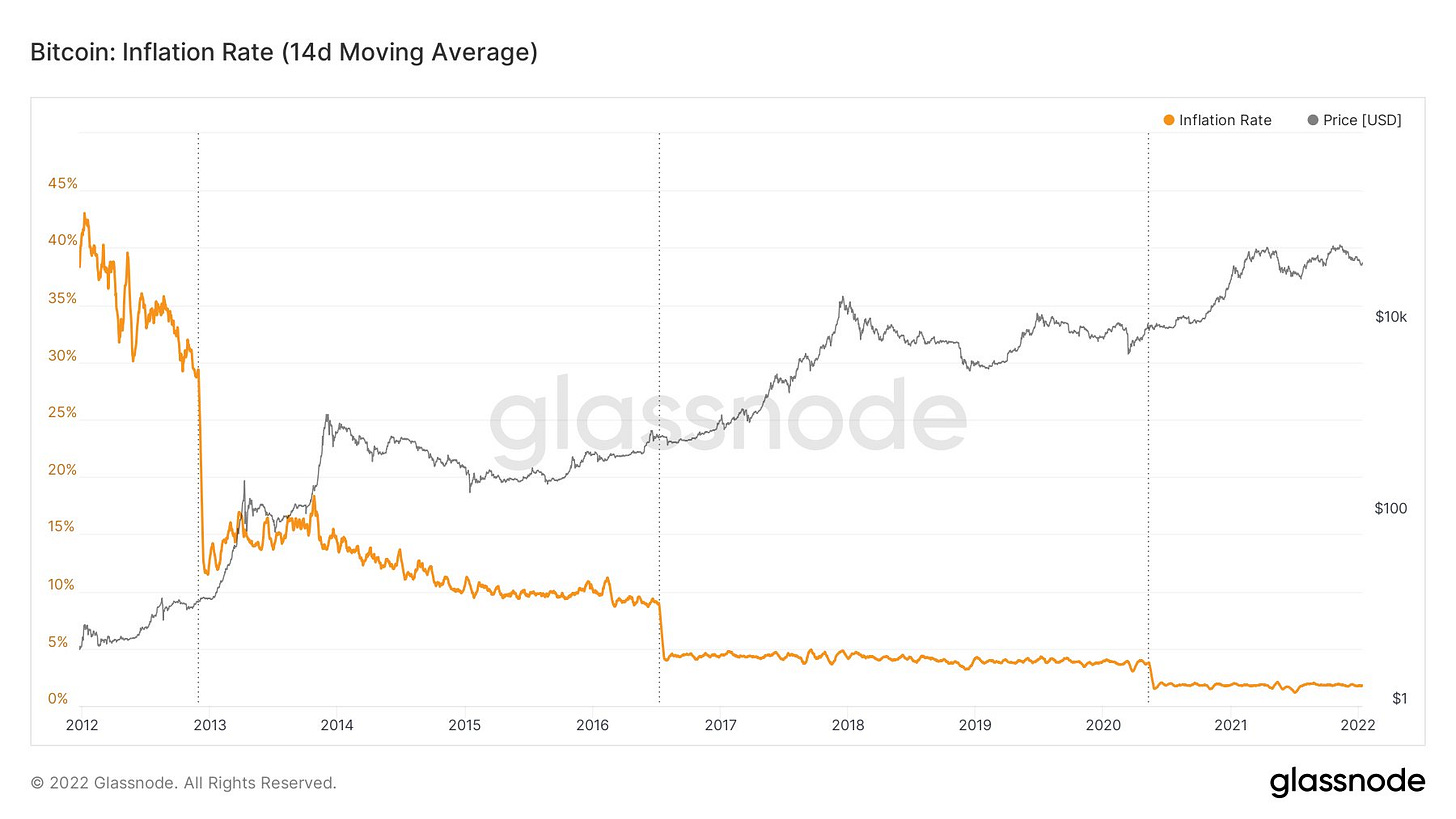
Bitcoin is providing an alternative monetary network outside of government-controlled or central bank-controlled currency. Bitcoin is programmatic, immutable, permissionless, and concretely understood. In fact, Bitcoiners can verifiably show what the inflation rate of the monetary system has been and what it will be in the future. Because the rate of incoming BTC supply is programmed and that the rate of new supply is cut in half every four years, we are able to prove how Bitcoin is disinflationary. As we can see in the chart below, provided by Dylan LeClair, the four-year halving cycles are shown by the vertical lines, along with the corresponding inflation rate and price of Bitcoin:

If I ask any central banker, economist, or investor what the inflation rate of the USD money supply will be in the future, I’d never get a conclusive answer. With Bitcoin, we get an answer with absolute certainty.
We can clearly see the inflation rate drop off a cliff due to the halving cycle every four years. As the supply of Bitcoin approaches the total maximum supply of 21 million, the inflation rate will approach 0% over time. In a world of fiat monetary systems, where global central banks are able to print infinite amounts of their currency over time, I’m going to hold my economic value in an alternative system with fixed and ultimate scarcity.
Talk soon,
Caleb Franzen


