To investors,
In light of the December 2021 CPI data, I wanted to discuss how the relationship between inflation, yields and Bitcoin is evolving and why it’s so important. There have been key developments amongst these variables, particularly since the beginning of 2021, that I believe are vital to understanding economic conditions and financial markets. In this deep-dive, we’ll discus the following:
• December 2021’s CPI data in context of recent and historical data.
• The bizarre correlation between Bitcoin, yields, and inflation.
• The economic theory behind these relationships.
• How I expect stocks and Bitcoin will behave if these trends persist.
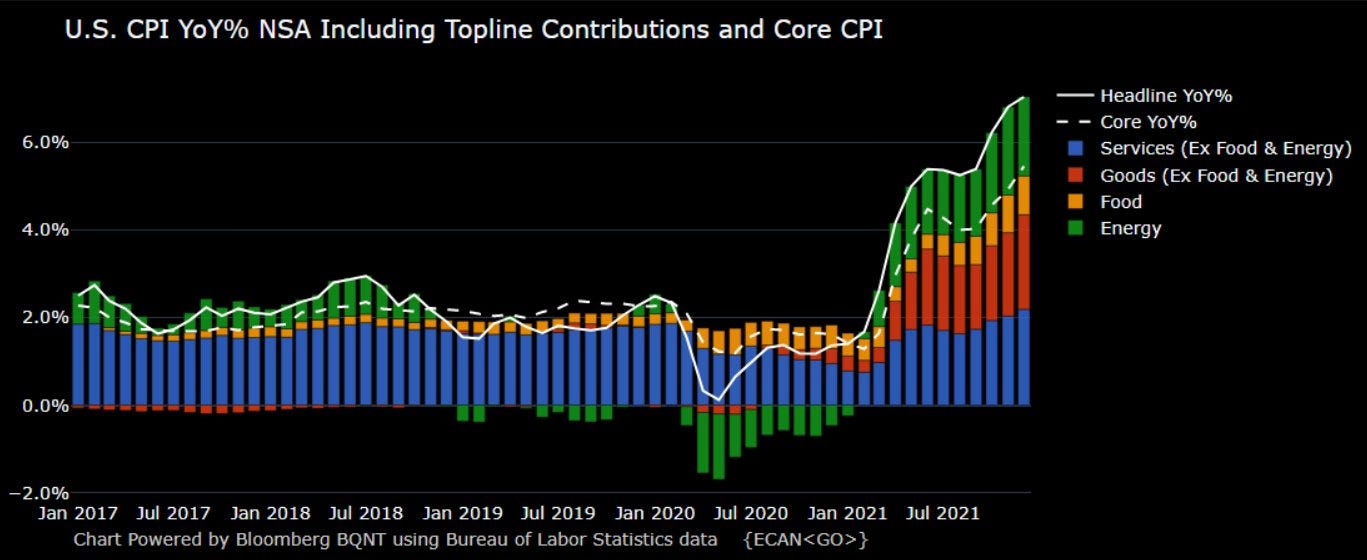
The CPI data for December 2021 was released early yesterday morning, with median forecasts expecting a +7.0% increase on a 12-month basis. Considering that the November data was +6.8% (above estimates), it’s clear that the market was expecting to see more increases in consumer prices. The market and forecasters were right, with the result being a +7.0% increase year-over-year. Core CPI reached +5.5%, the highest level since the period ending February 1991. It’s crystal clear that inflationary pressures continue to spread throughout the economy and that central bank guidance of a short-term, transitory spike was misguided. The 12-month inflation rates have continued to put pressure on U.S. consumers and low-income households.
After starting January 2021 with a +1.4% inflation rate, the data since mid-2021 clearly shows that inflation is continuing to rise:
May 2021: +5.0%
June 2021: +5.4%
July 2021: +5.4%
August 2021: +5.3%
September 2021: +5.4%
October 2021: +6.2%
November 2021: +6.8%
December 2021: +7.0%
It’s clear that the uptick in inflation is being driven by two primary components: Services (ex food & energy) and Energy. Food prices have risen, but at a slower rate than these two groups.

Some specific components that had notable year-over-year changes were:
• Gasoline: +49.6%
• Used Cars and Trucks: +37.3%
• Utility Gas Service: +24.1%
• Food at Home: +6.5%
• Food Away From Home: +6.0%
• Meat, Fish, and Eggs: +12.5%
• Shelter: +4.1%
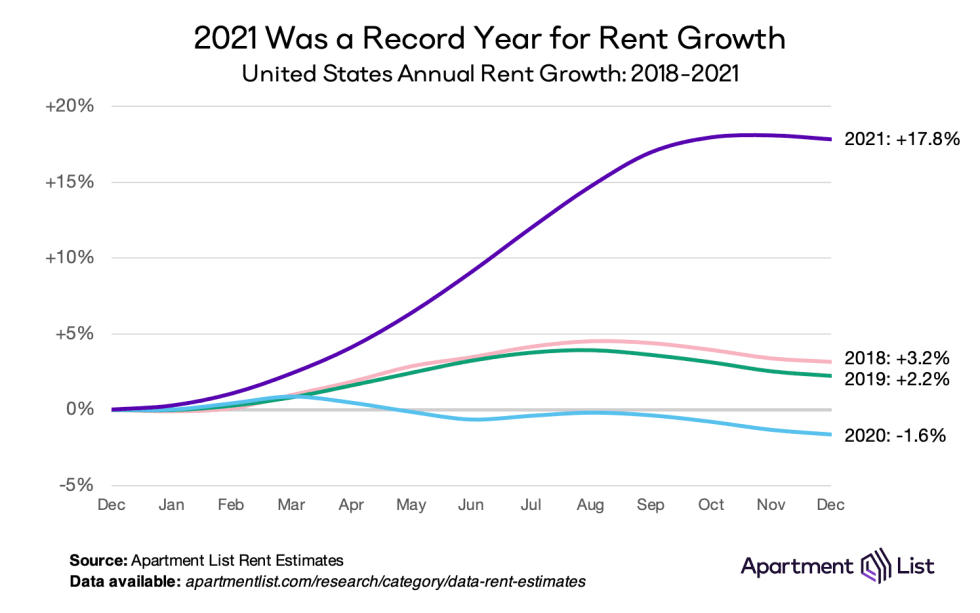
In last month’s review of the November data, I pointed out how the Shelter component, which comprises roughly one-third of the CPI’s weighting, seemed drastically underreported. At the time, I referenced data from Apartment List and the Case-Shiller U.S. National Home Price Index to point out how rents and housing prices were up +17.8% and +19.5%, respectively. The updated data is still consistent with what I discussed last month.
Rents in 2021 accelerated faster than any year in recent memory, growing +17.8% in the 12-month period ending December 31, 2021. The Case-Shiller Index was updated for October 2021, showing a +19% year-over-year increase. With both of these data points showing significant gains in the cost of shelter, how/why is the CPI data reporting a +4.1% increase? This question is starting to take center-stage over the last few reports, with many economists suggesting that the headline CPI data, currently +7.0%, would be double-digits if Shelter was properly reported.
Nonetheless, the current inflation rate of +7.0% is very significant from a historic standpoint, reaching 40-year highs. Consumer price inflation is even more historic if we evaluate it relative to Treasury yields. Typically, economists will offset the 10-year yield ($TNX) by CPI in order to determine the real yield of the 10-year U.S. Treasury, but I saw insightful data from Jeff Weniger that took a different view:

This data shows that bond investors are currently earning the worst real return on their Treasuries, even compared to the double-digit inflation that the U.S. experienced in the 1970’s. That’s because the yield on the 10-year Treasury traded between 5% and 10% in the 70’s vs. a current rate of 1.75% today. This graph from Jeff is informative enough to even show that the relationship bottomed in 1984, when the 10-year yield was 13.58%.
Yields have risen considerably over the past twelve months, when they were “only” 1.13% in January 2021. That means that yields have increased by +55% in order to reach the current level of 1.75%. Rates certainly have the tailwinds to rise further, given by the Federal Reserve’s willingness to combat inflation & the more aggressive stance they are taking to taper & tighten monetary policy. In light of continued inflationary pressures, the Federal Reserve is being forced to act quicker than originally anticipated, causing rates to rise more aggressively.
Most investors will hear that yields are expected to continue to rise and immediately think that risk-assets, such as U.S. stocks and Bitcoin, are going to fall as a result. In my “Investment Outlook for 2022”, I clearly stated that I think U.S. stocks will have below-average returns this year (below +12%), with only a 20% chance of achieving above-average returns. Considering that Bitcoin is significantly more volatile than the S&P 500, one might expect that I’d have an even worse outlook for Bitcoin in 2022; however, there is vital data that forces me to have a more positive view of Bitcoin over U.S. stocks this year.
In November 2021, I came across a unique correlation as it pertains to Bitcoin and general macroeconomic dynamics and yields. At the time, I couldn’t find any analysts who had pointed out the extreme correlation between the price of Bitcoin and 10-year Treasury yields. I sat on the data for some time, then thought about how I wanted to share it. The culmination of that discovery was a post on 12/10/21 that highlighted the following:

This was a significant finding because it implied that Bitcoin was not behaving the way risk-assets typically move relative to yields. As I’ve pointed out many times, yields and asset prices have an inverse relationship, all else being equal.
• Yields ↑ Asset Prices ↓
• Yields ↓ Asset Prices ↑
Instead, the data showed that Bitcoin was moving in near-perfect correlation with yields, not against them for a period of roughly 16 months. While Bitcoin enthusiasts have long theorized that Bitcoin is a hedge against inflation, we are now seeing this reflected in the actual dynamics of yields, inflation, and Bitcoin.
Typically, Bitcoin maximalists have argued that BTC is a hedge against inflation because of the large gains Bitcoin has had over the past 10+ years. Because those gains have drastically offset any decrease in purchasing power as a result of inflation, they state that it’s an inflation hedge. I’ve always thought of this argument as a cop-out because it relies on false logic. Bitcoin has also outpaced nearly every other asset in the world, so does it act as a hedge against every other asset? Perhaps, but not just because it’s had larger gains than everything else. Considering that Ethereum has generated higher than Bitcoin since 2015, is ETH a hedge against BTC? Absolutely not, as both assets are extremely correlated! A hedge doesn’t mean that the return of one asset outpaces another asset, it means that the risk/return of one asset offsets the risk/return of another asset. Correlation is key.
Investopedia defines a hedge as “an investment that is made with the intention of reducing the risk of adverse price movements in an asset.” Regarding inflation, an asset is a valid hedge if the price of that asset moves in accordance with changes in inflation. As inflation goes up, reducing the purchasing power of consumers, the hedging asset should rise in order to offset or minimize the impact of inflation. Again, the correlation between the two variables is key. If an asset loses value while inflation is rising, the investor is even worse off and the asset certainly didn’t act as a hedge.
So if Bitcoin moves in lockstep with yields, how does that mean it’s working as a hedge against inflation? Economic theory and data tells us that yields and inflation have a positive correlation, meaning that they generally rise and fall together. The logic behind this is straight forward:
As inflation rises, the fixed income payments of the bond are devalued and reduced by the rate of inflation. The fixed income payments are worth less during an inflationary period, therefore the demand for bonds falls. As the demand for bonds declines, issuers of bonds must raise the yield on the debt in order to attract demand. Linearly, we see:
Inflation ↑ Yields ↑
While inflation data is released on a monthly basis, Treasury yields trade every weekday on the open market. Essentially, yields give us real-time data on inflation and economic growth expectations because they’re directly correlated. Therefore, the reason why the chart above is so important is because it unequivocally shows that directional changes in inflation and yields are causing identical changes to the price of Bitcoin! This finding provides verifiable data to prove that Bitcoin is working as an inflation hedge. The Bitcoin community should be thrilled by this development considering that one of the core value propositions of Bitcoin’s monetary value is that it acts as a hedge against fiat inflation. Essentially, Bitcoin is working as intended!
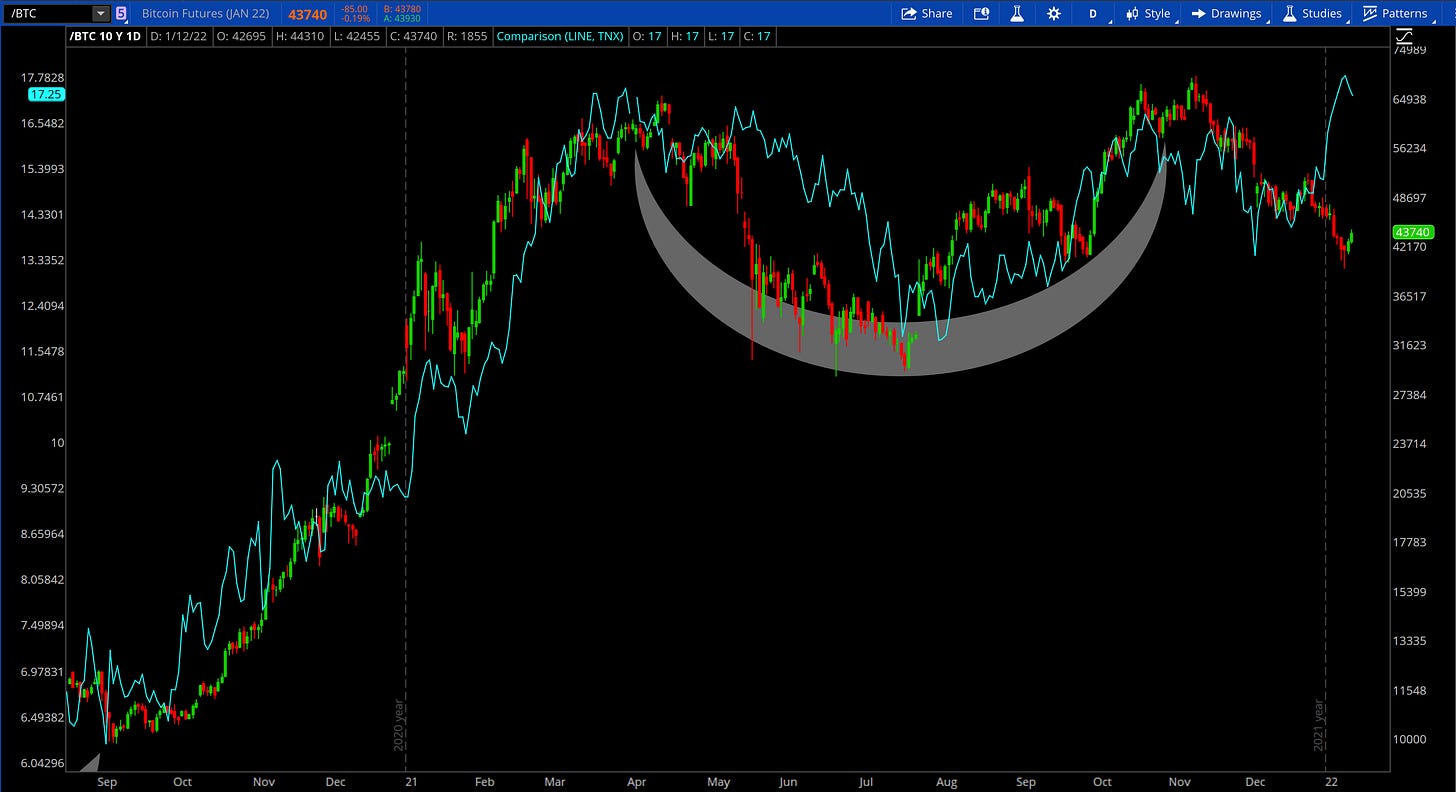
Interestingly, the perfect correlation between Bitcoin and yields has diverged over recent weeks. This deviation has continued to widen during Bitcoin’s decline from $52k to $39.6k. The updated chart, as of January 12th at 6pm ET, is below:
Since the final days of December through early January, the price of Bitcoin (candles) has widened itself from 10-year yields (teal line). While a gap also formed between May - June 2021, the direction of both variables was the same. The gap was merely caused by Bitcoin falling significantly faster than yields were. Recently, these variables have concretely moved in opposite directions. I don’t believe this will persist much longer, as we’re already seeing the data points start to convergence again. If/when the convergence is completed, I expect to see a continuation of the positive correlation.
Why has this divergence happened? I don’t know, and I’m certainly open to ideas. Certainly we’ve seen most risk-assets fall during this same period, as the market was seemingly pricing in high inflation data. Amidst continued pressure for stocks, particularly for non-profitable tech, Bitcoin & crypto have also fallen substantially. However, both stocks & crypto have had a strong week thus far. Since the intraday lows on Monday, which was an extremely choppy day, the S&P 500 has gained +3.1% while the Nasdaq-100 has gained +4.8%. Bitcoin during the same period is +10.6%.
If the price of Bitcoin caught up to where the 10-year Treasury Yield Index is currently, it would need to gain +51% from the current prices of $43.7k. I believe that the normal correlation between these two variables will persist, despite the deviation in recent weeks. If Bitcoin is able to make a substantial momentum thrust higher over the next 5-10 days, that will likely create a risk-on environment for all/most of crypto to rise, and possibly stocks too. The 180° alternative is that yields continue to rise higher amidst historic inflation, prompting a traditional selloff in risk-assets, meaning stocks and crypto face downward pressure.
With the inflation rate increasing between November 2021 & December 2021, it’s possible we continue to see a strong boost in yields over the coming weeks. Immediately after the November data was released, the 10-year yield index increased by +15.5% until the December 2021 release. These rising yields are forcing investors to take a diligent look at their portfolio, reevaluate their convictions in risk-assets, and to measure risk accordingly.
Non-profitable tech stocks look like a graveyard right now, which I expect will persist for the majority of 2022. Using $ARKK as a gauge for this group of stocks, it’s evident that the uptrend is far behind in the rear-view mirror.
The trend is decisively to the downside. Critical levels that used to act as support are now acting as resistance, pushing price lower on every retest. The creation of lower highs and lower lows is the definition of a bear market in this group of tech stocks. If yields continue to push higher as a result of inflation data & monetary policy, $ARKK will continue to fall to the downside. If this dynamic of rising yields persists, it’s critical to actually own hedges against those rising interest rates. Some stocks are better suited to handle this environment, particularly the financials, energy, and materials sectors. Based on the data we reviewed above for Bitcoin, it appears that BTC could act as a natural hedge against rising yields/inflation as well, assuming that the positive correlation continues.
Talk soon,
Caleb Franzen
DISCLAIMER:
My investment thesis, risk appetite, and time frames are strictly my own and are significantly different than that of my readership. As such, the investments & stocks covered in this publication are not to be considered investment advice and should be regarded as information only. I encourage everyone to conduct their own due diligence, understand the risks associated with any information that is reviewed, and to recognize that my investment approach is not necessarily suitable for your specific portfolio & investing needs. Please consult a registered & licensed financial advisor for any topics related to your portfolio, exercise strong risk controls, and understand that I have no responsibility for any gains or losses incurred in your portfolio.


Thanks Caleb.
Bitcoin also behaves like small cap stocks (US2000/US500)...
Curious to see your take... but it seems to me that with small caps down at support after dropping since last March they are possibly ready for a trend reversal.
Jim