Edition #115
Labor Market Jumps Back, Semiconductor Stocks On Fire, On-Chain Bitcoin Data
Economy:
On Friday morning, the nonfarm payroll data was released. With the Fed’s announcement earlier in the week announcing the start of tapering their asset purchases, there will continue to be heightened scrutiny on labor data to evaluate the Fed’s timeline. Specifically in terms of how the labor market data will accelerate or slow down the expected pace of reductions by $15Bn/month. Stronger labor market data means that they could accelerate their reduction, depending on broader economic conditions.
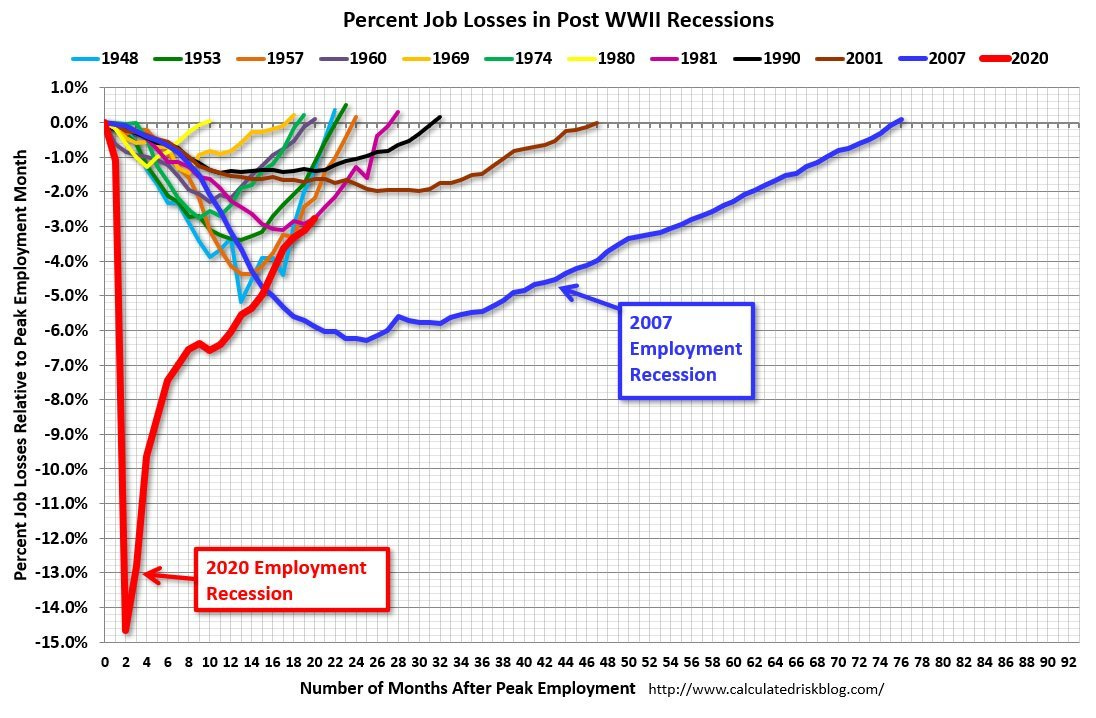
Considering that this was the first bundle of labor market data since the Fed’s taper announcement, I was hoping to be able to discuss this in-depth. However, the data is extremely similar to the data of recent months: a general improvement in the unemployment rate, a net increase in jobs, rising wages, but a stagnant labor force participation rate. The headline figure was the most impressive aspect, with consensus estimates of 420k and the result of 604k. Relative to the September data, which saw a net increase of 365k (revised up from the original 317k), this was a massive beat and acceleration in the labor market. As we can see below, the labor market has been extremely steady so far in 2021:
As I’ve continued to reiterate on this newsletter, I’ve fully expected to see a slow & steady recovery in the labor market (as expressed by consistent job gains & a decrease in the unemployment rate), with occasional moments of weakness & surprising misses. So far that’s been a perfect representation of the data since I started this newsletter in May. I’ve also been pounding the table to highlight the extremely disappointing figures in terms of the labor force participation rate. Unfortunately, I can’t feel overly optimistic about the labor market until the LFPR increases consistently. From my perspective, this would represent an expansion in the labor market — a key sign of a healthy, expanding, and recovering economy.
Nonetheless, this is still the sharpest labor market recovery we’ve seen since WW2.
Stock Market:
On June 29th, in Edition #36, I posted the following chart of semiconductor stocks:
I had expressed that a breakout to new all-time highs was a bullish development, highlighting that semiconductor stocks were a great industry to have exposure to. It’s no secret that I’ve been hyper-bullish on semiconductor stocks and even listed them as one of the top six investment themes for 2021. When I highlighted this as a bullish development in June, that doesn’t necessarily mean that I think it’s going to rocket straight up, but is simply offering a competitive advantage for relative outperformance compared to the broader market.
More than four months later, let’s see how this semiconductor ETF has performed on a raw basis and relative to the S&P 500. First things first, here’s the current chart as of market close on 11/5/2021:
As we can see, the price structure that I shared in June 2021 (yellow vertical line) has continued to provide a strong guideline for price action over the past several months. In fact, shares almost perfectly adhered to this price structure. While the breakout that I highlighted on June 29th didn’t immediately happen, it set the stage for what was yet to come. If an investor read that newsletter & the analysis that I shared on June 29 & immediately bought shares at the 6/29/21 open, their maximum drawdown on those shares would have been -6.7%. If that same investor had continued to hold onto those shares through the 11/5/21 close, they’d have gained +14.3% on their investment. Over the same period of time, the S&P 500 has gained +9.3%. Clearly, semiconductors have outperformed the broader market since I highlighted the bullish price action.
The market provided many buying opportunities to buy shares on a discount. This ETF experienced an -8% pullback from August 5th through August 19th and then experienced a -10% pullback from September 16th through October 4th. Since the lows on October 4th, shares have gained more than +19%.
While it’s been a bit choppy, the security has continued to make new ATH’s consistently since my original prior post on 6/29. Over the course of this past trading week, shares launched higher above the prior ATH’s from 9/16 and are now in the early stages of a new breakout. As we saw during the last stage, the prior resistance levels from Q4 2020 (grey) and Q1 2021 (white) started to act as support once price broke above those respective resistance levels. Now that price has broken above the newest resistance level (top white), I expect that this level should act as future support if/when we retest it during the next market pullback.
Recall, on September 18th, I published a free newsletter (Edition #95) that highlighted my favorite semiconductor companies. Here are those companies once again, with their returns from the market open on 9/20:
1. $NVDA +40.9%
2. $TSM +2.7%
3. $AMBA +33.8%
4. $LRCX +3.8%
5. $AVGO +13.8%
6. $SITM +31.8%
7. $CDNS +10.6%
8. $KLAC +17.3%
9. $AMAT +13.1%
10. $MCHP +9.6%
11. $AMKR -9.2%
12. $XLNX +32.6%
13. $AMD +34.3%
Of the 13 individual stocks I highlighted on September 18th, 92.3% of them are higher today. The average return of these 13 stocks is +18.1% vs. the S&P 500’s return of +6.7%.
Cryptocurrency:
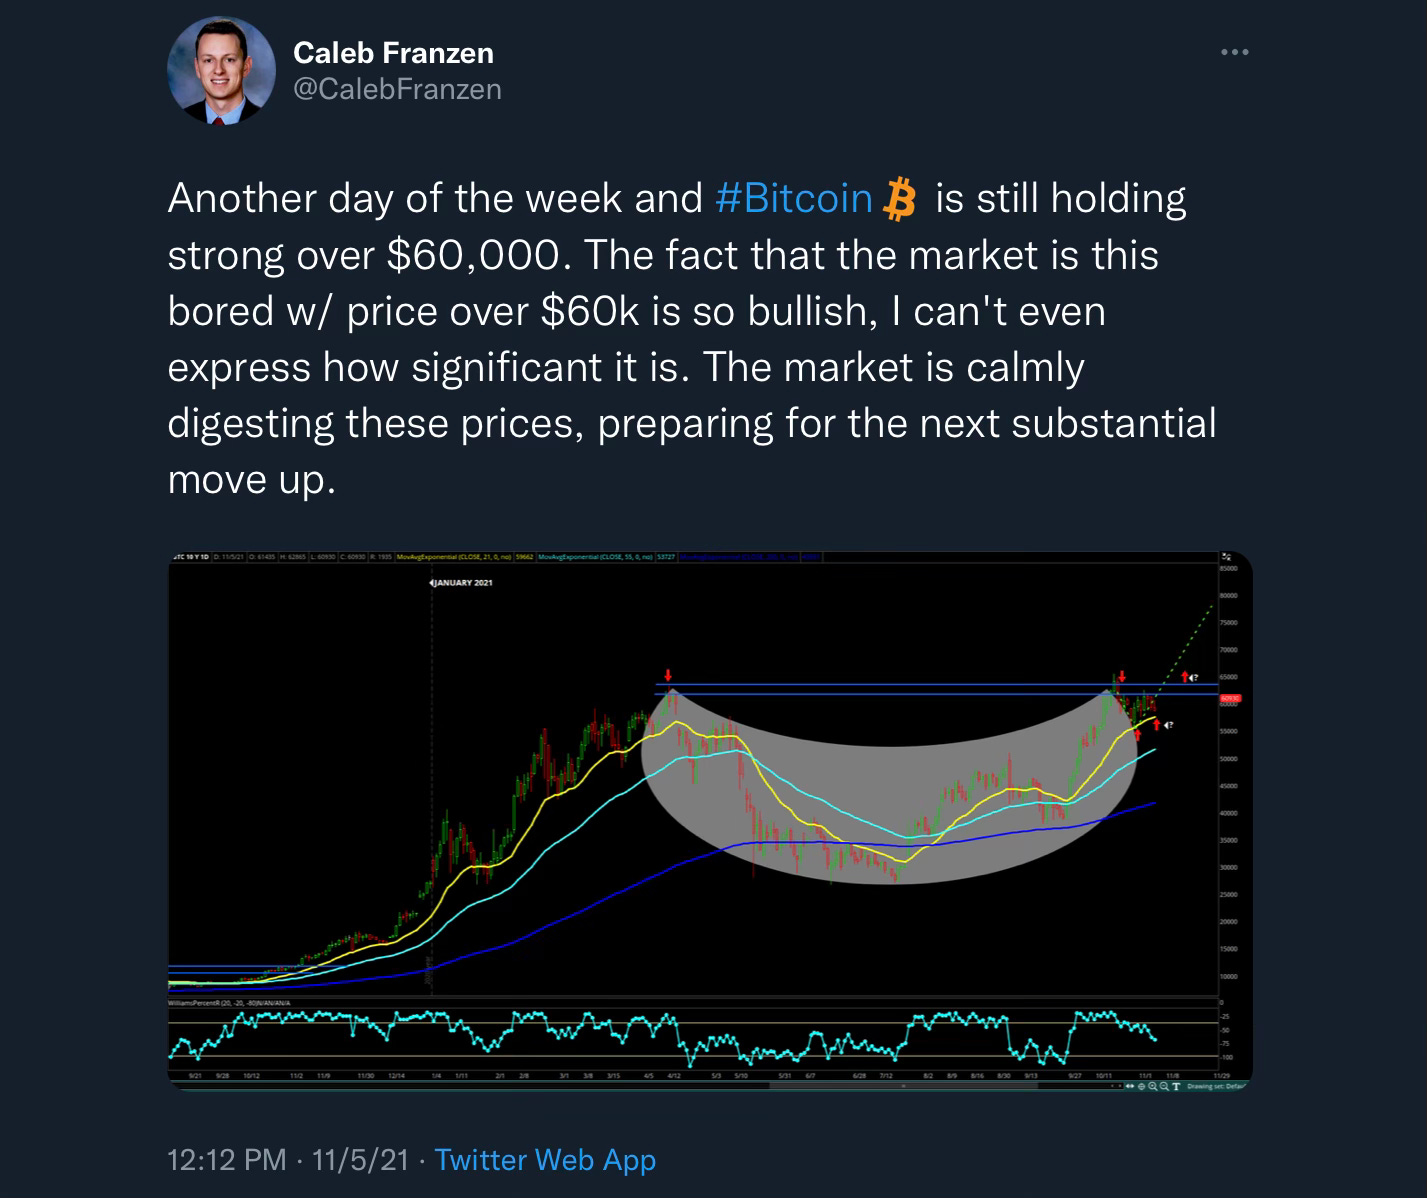
First of all, I wanted to share some brief comments that I made about the current state of Bitcoin during Friday’s session:
Broadly speaking, Bitcoin’s recent price action is exactly what I have been expecting since we’ve broken back over $60,000. As I stated in the above Twitter post, the market is merely digesting these prices and getting re-acclimated to these levels. I continue to reiterate that the most likely case scenario is a breakout within the next 5-7 days, with an estimated price of $110k-$135k by year-end.
I saw an excellent chart from Dylan LeClair, a senior market analyst for UTXO Management, sharing a very interesting data point called “illiquid supply shock ratio”.
Per Glassnode, “the illiquid supply shock ratio is calculated as the ratio between Illiquid Supply, and the sum of Liquid and Highly Liquid Supply. This metric attempts to model the probability of a supply shock forming, whereby fewer coins are available relative to the current demand trend.” As the ISSR rises, this represents an outflow of BTC from liquid circulation when owners withdrawal their Bitcoin from an exchange and move their assets to cold-storage wallets. With less supply being in circulation, there’s less Bitcoin to be readily sold on the open market, increasing the likelihood of a supply shock.
As we can see from the chart above, the ISSR is currently at ATH’s, breaking above the April 2021 peak. Said plainly, the Bitcoin market continues to face supply shortfalls. If this trend continues to play out, we all know from Economics 101 that less supply and stable demand result in rising prices. If supply continues to fall and demand rises, there will be a two-factor increase in price.
The best part is that speculators are extremely muted right now. Again from Dylan LeClair, here is a chart tracking Bitcoin’s margined open interest (a fancy word for call options activity) overlaid on top of price:
At present levels, there’s nearly half as much speculation in terms of call options as there was in April 2021. Why is this important? When there are less speculators who are using debt and leverage to trade, price will be driven primarily by raw supply/demand factors. When speculators are present and the market declines, the issuers of the leverage make “margin calls” in order to get their money back, forcing the speculators to liquidate their positions rapidly. These margin calls result in extreme price volatility due to the forced selling by speculators, causing price to cascade lower. Therefore, with limited margin & leverage in the system (relative to prior levels), the likelihood of experiencing deep pullbacks becomes lower.
With price action being primarily determined by spot buyers/sellers, this makes me feel comfortable and confident that the market will grind higher. Conversely, if the market declines, I expect the dip will be bought up quickly. Thinking ahead, I’ll be interested in watching to see if margined open interest rises over the coming weeks if/when Bitcoin’s price begins to rise dramatically. This will be a key sign of FOMO behavior.
At the time of writing, Bitcoin’s price is $61,150, or $0.0615M.
Talk soon,
Caleb Franzen


