Edition #107
September 2021 CPI, Valuations Stretched or Warranted?, Crypto Adoption = Internet Adoption
Economy:
With the last newsletter covering the mixed signals in the labor market, it only makes sense that we rotate over to CPI & inflation for this current edition. Sarcasm aside, the September CPI report was a critical milestone for the transitory vs. persistent inflation debate. Considering that the 12-month CPI inflation rate has been above +5% for each month since May 2021, the transitory camp would ideally need to see an obvious slowdown in order to reiterate their position.
Unfortunately for them, that doesn’t seem to be the case on a rolling 12-month basis. The headline number for the September consumer price index reflected a YoY increase of +5.4%. This now marks the 4th consecutive months in which the rolling 12-month CPI change exceeds +5%. The data since May 2021 is as follows
May 2021: +5.0%
June 2021: +5.4%
July 2021: +5.4%
August 2021: +5.3%
September 2021: +5.4%
Considering that January 2021 had a 12-month inflation rate of +1.4%, it’s challenging to see this as transitory until we can actually point to a considerable slow-down in the 12-month rolling inflation rate. Some economists are pointing to 2-month rate of change to show how inflation is indeed slowing down, but this seems like folks are moving the goal-post from my perspective. Below is a chart that I saw of someone who was making this argument.
It’s completely fair to point to this chart & make the case that inflation is decelerating (aka disinflationary dynamics), but I suppose it truly depends on what timeframe consumers & economists are interested in measuring. Monthly or 2-month changes can fluctuate rather quickly, as we’ve seen since Q1 2020. Whether or not we can sustain around the longer-term average of approximately +2% as we did from 1998-2019 is a completely different question. The chart above also measures core CPI, which excludes food & energy prices, so it should certainly be taken with a grain of salt. At the end of the day, if we exclude food, energy, rent, entertainment, and travel expense, consumer inflation would be 0%! For the month of September, the 12-month increase on core CPI was +4.0%, which is consistent with the prior data from the last several months.
Charlie Bilello put out a great post today after the CPI data was released highlighting some of the most notable price increases over the past 12 months:

I’ve consistently been saying that I think the Fed is right that the uptick in inflation will be transitory, but I’ve also been on record saying the following (taken from Edition #21 on May 24, 2021):
“I believe the Fed has done a sufficient job of downplaying how high inflation can rise over the next 24 months through their rhetoric & consistent reassurances that they’ll be able to reel in consumer prices if/when they need to. From my perspective, I wouldn’t be surprised if we see the 12-month CPI inflation numbers between +6% to +10% at some point in 2021.”
In my opinion, the argument for transitory inflation continues to grow weaker & weaker after each month as we remain at elevated levels on a 12-month basis.
Stock Market:
I saw an excellent chart produced by the Director of Global Macro at Fidelity, Jurrien Timmer, highlighting the valuation of the S&P 500. Considering that the S&P has gained more than 100% since the COVID lows last March, it’s extremely easy for people to look at the market and lazily call it a bubble. But are valuations necessarily echoing that same sentiment? Not quite, according to this chart:
What we see from the chart above is that, while valuation metrics are slightly above their long-term historical average of roughly 18x, forward-looking 12 month price/earnings ratios have been extremely stable for the past 16 months! In fact, they’ve actually fallen over the past 8 months from 23.4x to 20.6x despite the market continuing to make new all-time highs. Why is this the case? Quite simply because companies are generating stronger earnings and delivering on the earnings & growth metrics that were previously expected.
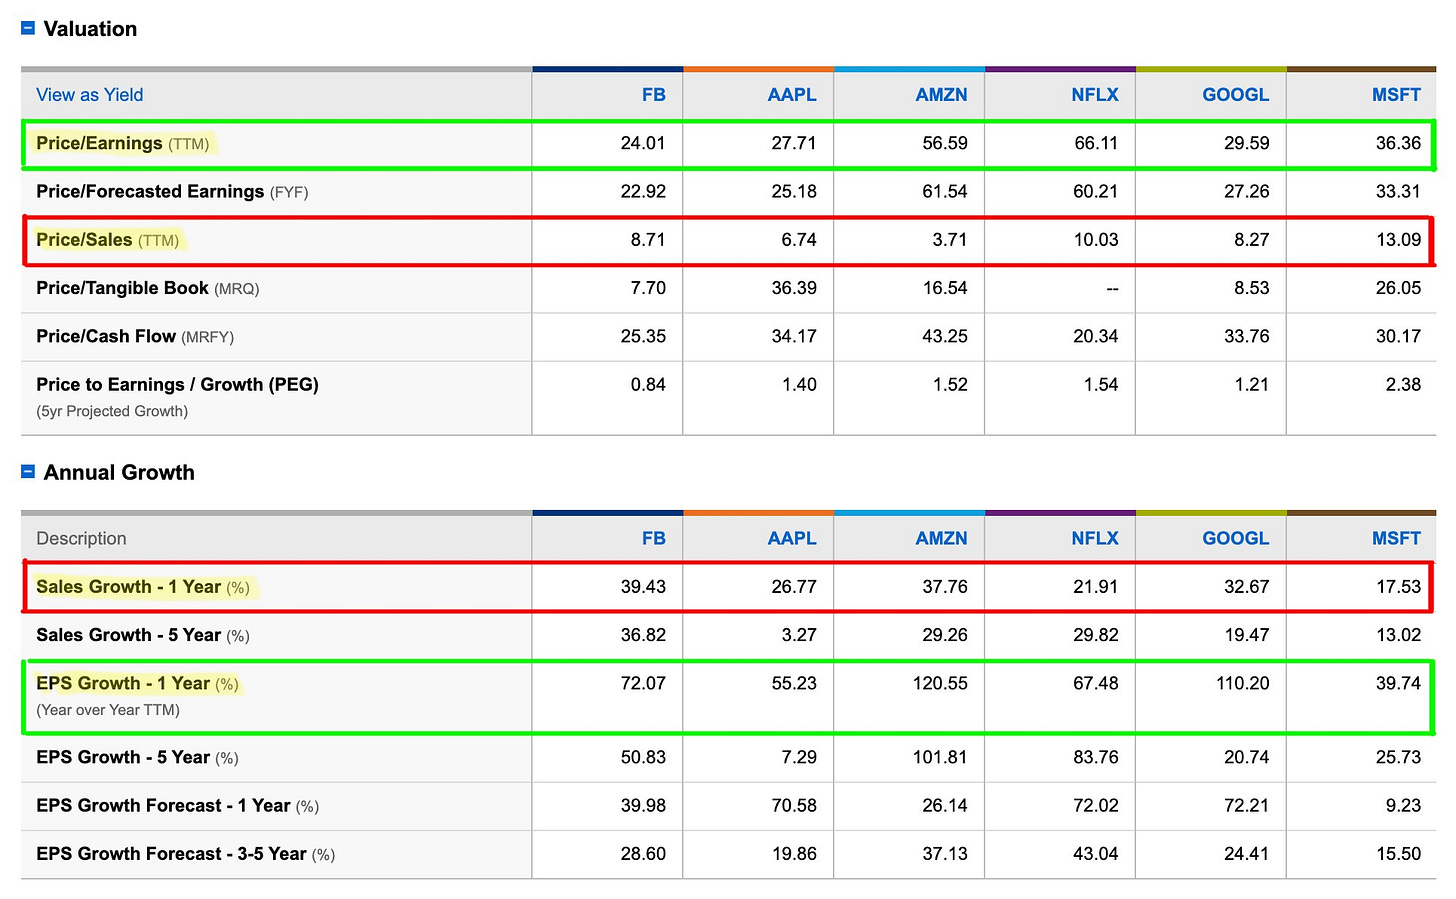
Those who scream about valuation bubbles always make me chuckle because valuations appear to be in a reasonable territory considering the current macro & monetary environment. Fundamentals are strong. Below is a chart that I put together showing some of the valuation & growth metrics of the FAANGM constituents (Facebook, Apple, Amazon, Netflix, Google, Microsoft):
Based on valuation alone, it’s fairly easy to point at these stocks and say that they appear stretched relative to their current earnings and sales. However, we must also consider why their valuations are high. P/E ratios get stretched when investors think that companies will be able to deliver on strong levels of future growth. So how are these companies doing in terms of growth metrics? On average, they’ve increased sales by +29.3% and earnings per share (EPS) by +77.5% over the past 12 months. These companies have an unquestionable ability to deliver on future expectations and it appears that their valuations, while moderately higher than the broader S&P 500, are warranted.
Cryptocurrency:
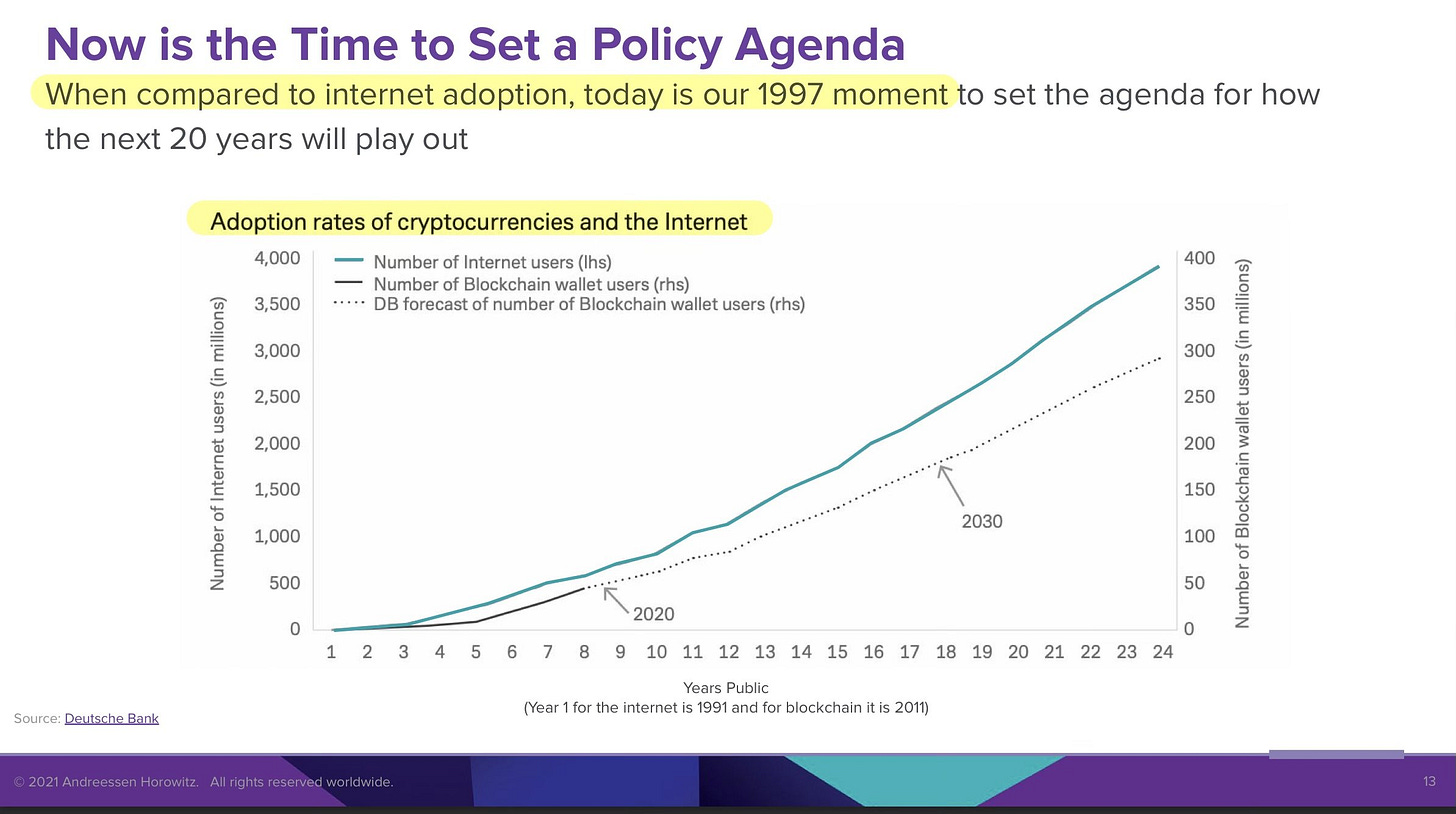
Yesterday, I read a great slide deck produced by venture capital powerhouse Andreessen Horowitz about the necessary adoption of cryptocurrency and Web3 (the third generation of internet). The deck took a 30,000 foot approach to why the crypto industry should be embraced, not punished, by government policy in order to harness the next wave of technological innovation here in the United States. The full presentation can be read here, but I wanted to specifically highlight one of my favorite charts from the entire report.
It’s a comparison that I’ve made in the past when discussing the adoption rate of cryptocurrencies & how the exponential nature of the space can be easily compared to the growth/adoption of the internet. The graph essentially speaks for itself so I won’t add much color other than to say that we’re still extremely early. Congrats if you’re already involved.
Talk soon,
Caleb Franzen


