Edition #105
Labor Market Data Contradicts Itself, Stock Sentiment Flashes Contrarian Signal, Bitcoin Price Targets
Economy:
Since the start of this newsletter in May 2021, I’ve been consistently saying that I expected for the slack in the labor market to tighten in October. Most recently, in Edition #68, I expressed that “we’d see stagnation in employment data in the July to September months”. So far, I’d say that’s been a fairly accurate depiction of the labor market data that has been released during this time frame. Generally, we’ve continued to see minimal improvements in unemployment claims, fairly flat results for the unemployment rate, and continued weakness in the labor force participation rate (the measure that I place arguably the most importance on).
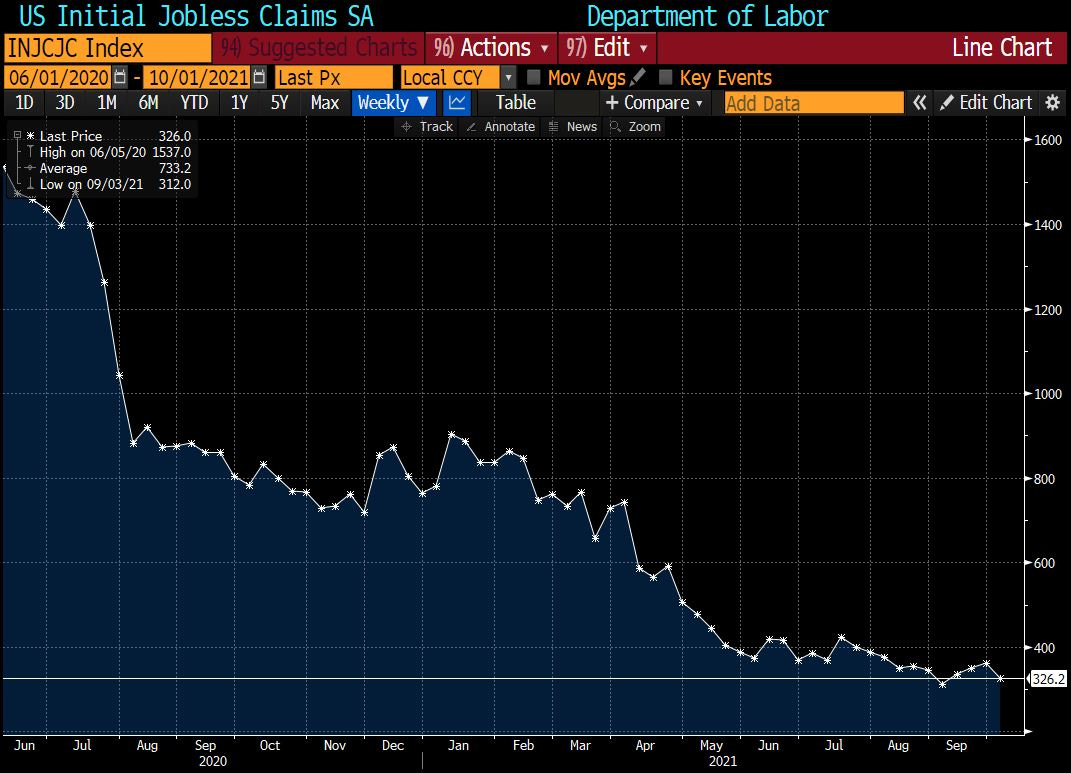
On Thursday of this past week, weekly unemployment claims data was released. The headline number was 326,000 initial claims vs. expectations of 348,000. The result was the second-best print since the start of the pandemic, but 328k new unemployment filings is still an extremely dire situation. Prior to this report, we had seen three consecutive weeks in which unemployment claims were increasing, so it’s at least encouraging to see an end to the rising report. Here’s a great visualization of the weekly data since June 2020:
The encouraging data from the unemployment report seemed to reaffirm the ADP payroll data that was released earlier in the week. Consensus estimates for the private payroll data were for 428k jobs, but the results came in surprisingly higher at 568k for the month of September. The important thing is to frame the current labor market within the context of the broader dynamics at play. Of the 19.6M jobs that were lost in March & April 2020, the U.S. economy has so far recovered 14.1M. The 5.5M slack is a shocking figure when we consider that the recent JOLTS report indicated that there are currently 10.9M job openings. Again, major slack in the labor market despite consistent, marginal improvements. The labor market recovery simply isn’t happening as fast as it should.
Finally, the official nonfarm payroll data was released on Friday morning. Consensus estimates were for 500k, but the headline figure came in at a measly 194k. The prior month’s data, which was originally reported at 235k was revised higher to 366k, which made some people a little more enthusiastic about the data. Many economists highlighted the fact that the unemployment rate decreased from 5.2% in August to 4.8% in September. While this may appear to be a positive signal, the full picture is much more bleak. Considering that the labor force participation rate, the percent of eligible workers who are part of the labor force (either employed or seeking employment), fell to 61.6%. I’ve written about why this relationship is so critical to understand in the broader context of labor market data, but the short version is that the LFPR and unemployment rate have a direct relationship: if the LFPR falls, so will the unemployment rate. If you want to learn more about this, I refer you here.
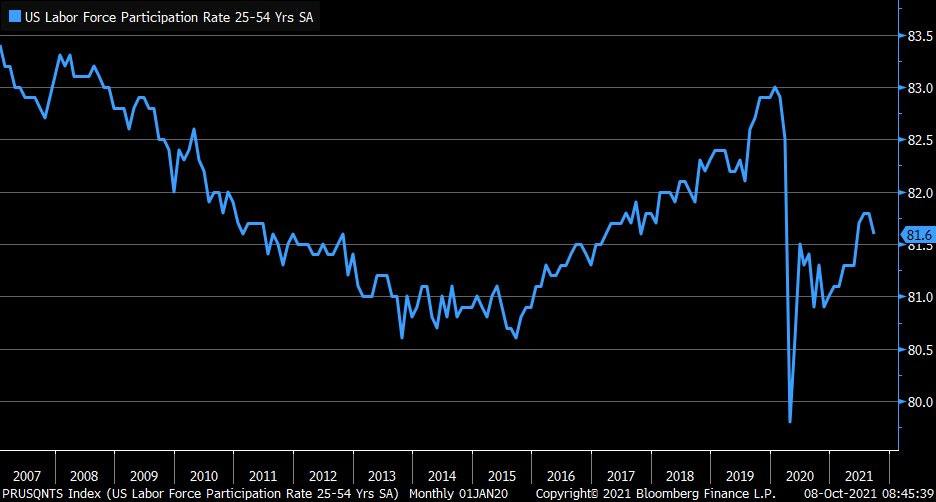
While the standard measure of the labor force participation rate dipped slightly month-over-month, the prime-age LFPR dropped even more considerably. The prime-age LFPR simply measures the participation rate of people between age 25-54. Based on the data below from Liz Ann Sonders, Chief Investment Strategist at Charles Schwab, this was the largest monthly decline since November 2020.
There are serious questions as to whether or not this newest round of data will decelerate the Fed’s tapering timeline, which the market is currently expecting to be announced in November. From my perspective, in and of itself, this recent round of labor market data isn’t enough to derail the Fed’s timeline. Their next policy decision meeting is being held on November 2nd and 3rd, therefore, the October data won’t be released yet to help inform their decision. As such, I think this recent report contained the good, the bad, and the ugly, but not bad/ugly enough to throw a complete wrench in the Fed’s plans. If we see substantively worse economic data or a massive decrease in the CPI inflation rate for September, that could perhaps delay, but I’m not holding my breath.
As a reminder, I was pounding the table for months that I thought the taper process would begin no sooner than Q1 2022, so there’s a high likelihood that I’ll be wrong on that measure. Time will tell.
Stock Market:
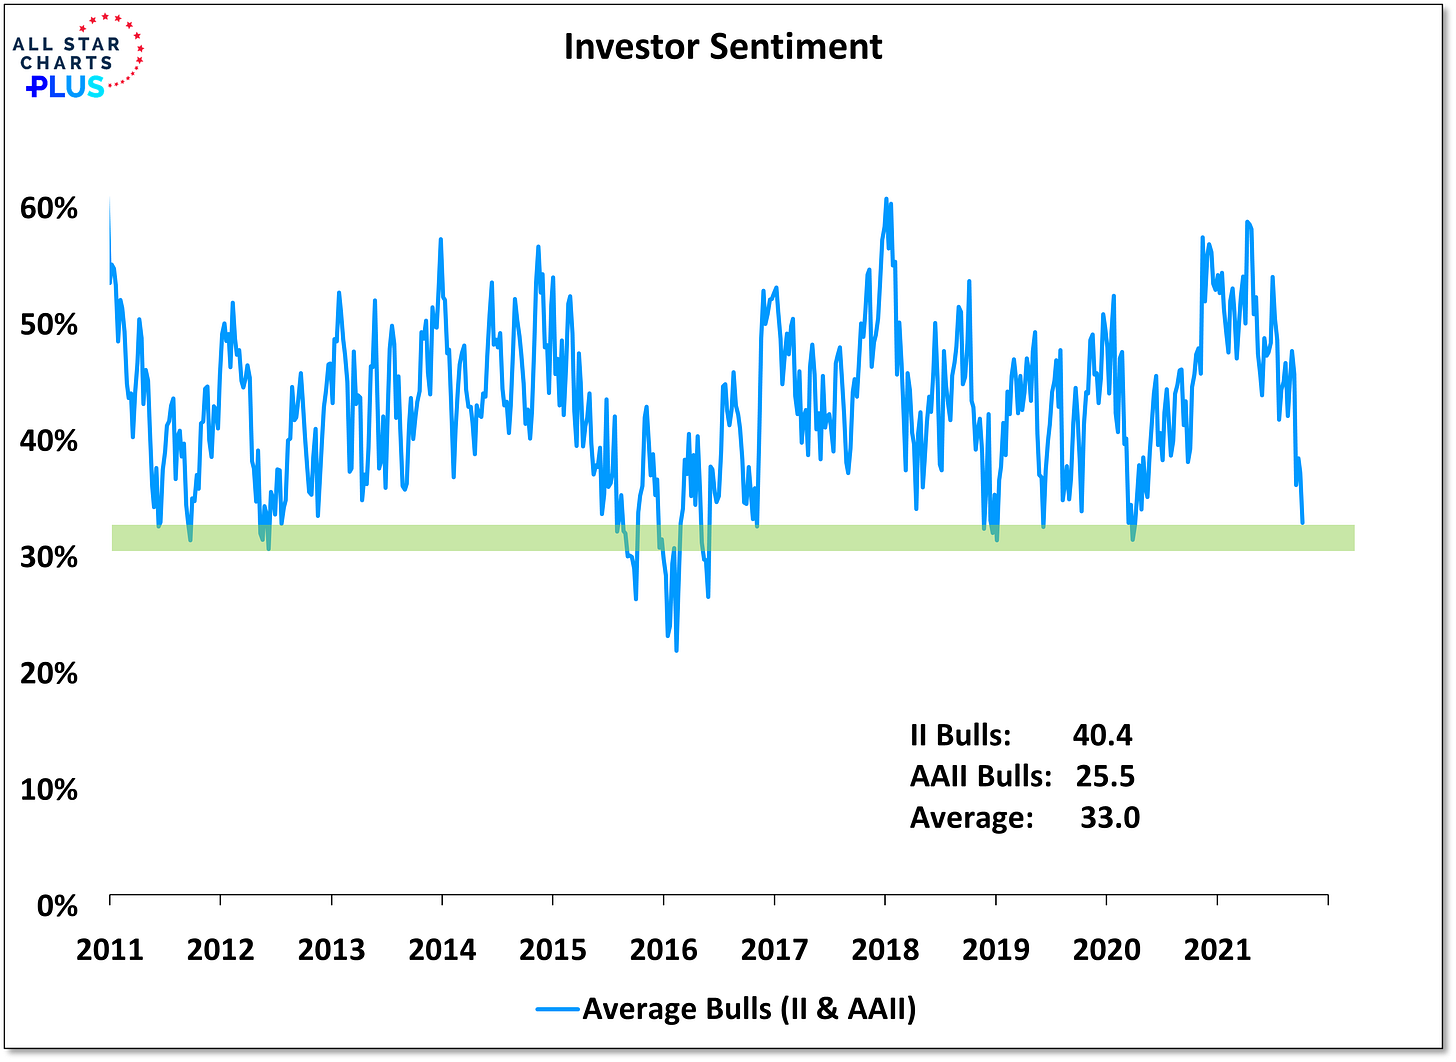
No major data to discuss, but I wanted to briefly cover some data from All Star Charts, posted on Twitter by Willie Delwiche, covering the recent American Association of Individual Investors (AAII) survey.
We can use the chart above as an oscillator of investor sentiment, gauging the views of bulls vs. bears. We can quickly identify that it’s somewhat rare for the average sentiment to reach the current levels into the green range. The last time we hit this range was in February 2020 during the massive COVID correction. The time before that was during the rate tantrum at the end of 2018. As we know, markets performed remarkably well after those low prints. In a way, this contrarian indicator could be a strong signal that we’ll have strong equity market returns over the intermediate term (6-9 months).
Cryptocurrency:
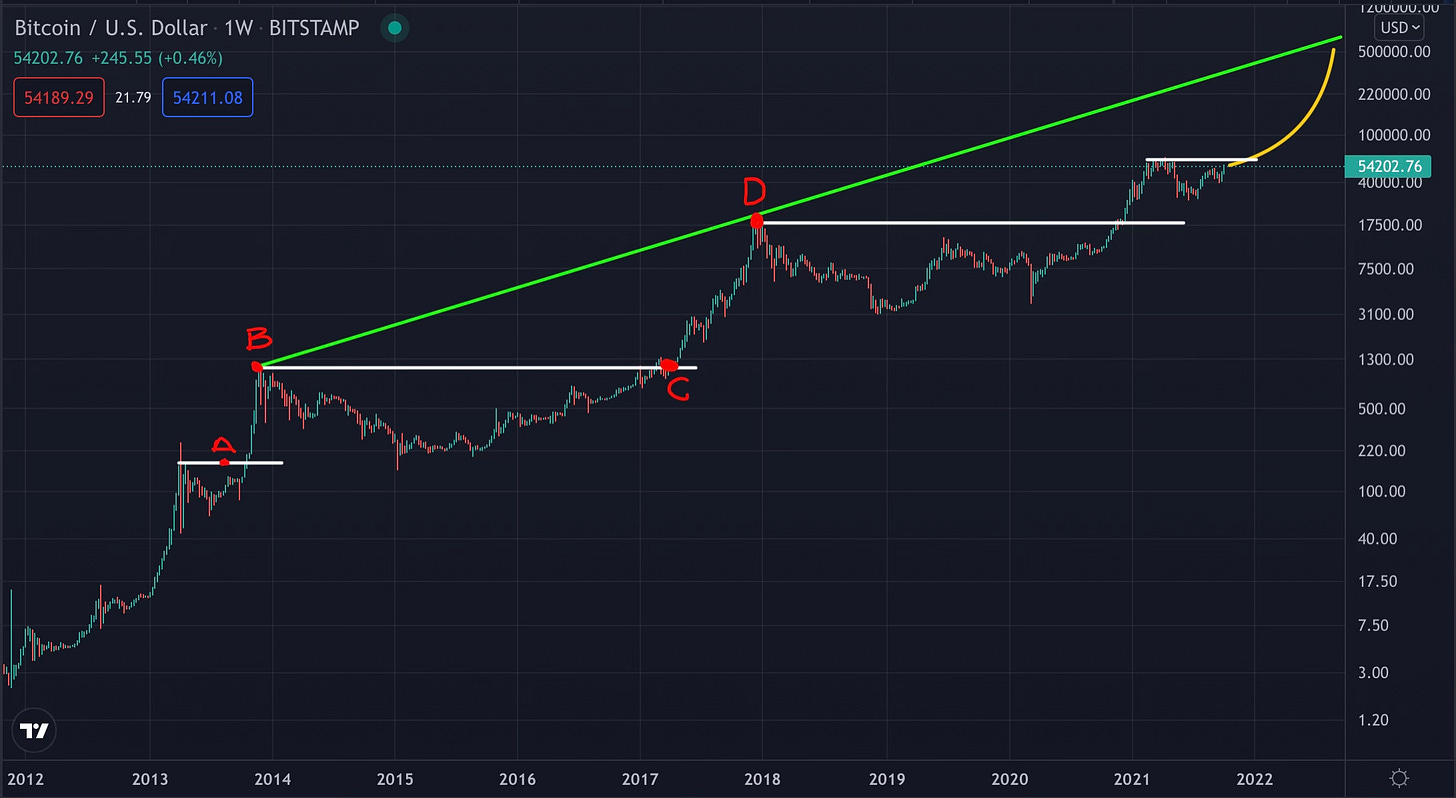
As we think about a potential roadmap for the price of Bitcoin, there are a handful of methods to extrapolate how high price can go. This will also depend on which timeframe we operate on, especially considering the intrinsic feature of the Bitcoin protocol that the rate of incoming supply decreases by 50% every four years. Below is a chart that I put together, showing the price of Bitcoin in logarithmic scale dating back to 2012. We can see the classic boom & bust cycles, smoothed out to reflect the exponential growth curve of the price.
There are a handful of things that I want to point out as we try to project where BTC’s price can go from the current level of $54,200. If we look back into the prior cycles, the breakout & extension move we’re currently in is very similar to the C→D move in 2017. Prior to that breakout (Point C), price had a massive consolidation, formed a new base, and then accelerated higher to Point D. The percent gain from C→D was +1,608%, or more than 17x, as price accelerated from $1,130 to $19,310. If we examine the current gains that BTC has experienced since the most recent breakout, we’ve “only” gained +180%, from $19,310 to $54,200. Let’s suppose that we’re only able to capture 67% of the prior cycle’s gains, that would be [0.67*17x] = 11.4x. An 11.4x gain from a baseline of $19,310 would push the price of Bitcoin to roughly $220,100. Relative to the current price of $54,200, that would imply that BTC could gain an additional +306% this cycle.
Additionally, let’s now examine the behavior from point A→B from 2013. During this period, in which Bitcoin had formed a much smaller base, the price of Bitcoin started around $170 and peaked near $1,150. That represents a +588% gain, or roughly 6.9x. We can see that the most recent decline of more than -50% from the April 2021 all-time highs looks very similar to the structure that preceded the A→B extension! We can then do a similar extrapolation by taking 67% of the prior cycle’s gains, or [0.67*6.9x] = 4.6x. A 4.6x increase on the April peak of roughly $64,000 would imply a price of $294,000.
The reason why I’m using 67% of the prior cycle’s factor gain is simply because of the law of diminishing marginal returns. I have zero certainty that 67% is the right number, but I tend to view it as an acceptable baseline estimate. In either case, using history as our guide, we can extrapolate two ways in which the price of Bitcoin can reach the $220k-$290k range THIS cycle. I think that there’s a very strong chance that we finish 2021 with the price of Bitcoin exceeding $120k, with a cycle peak being achieved in February-March 2022 that could push us well above the $250k figure. Either way, the two long-term models that I rely on give me confidence that the long-term magnet for the price of Bitcoin is well into the 7-figures, exceeding $1M per Bitcoin within the next 5-10 years.
If you’re not long, you’re short.
Talk soon,
Caleb Franzen


