Economy:
As a follow-up to my newsletter over the weekend, focused heavily on shipping data & inflation, I wanted to continue to march down this path & analyze more data on this topic. On the aggregate, I believe this data is able to show an under-the-hood view of how serious the supply bottlenecks & shortages are at the present moment, which the Federal Reserve has openly admitted will make inflation more persistent.
In fact, it isn’t just the Fed who is concerned about this issue. Last week, the President of the ECB, Christine LaGarde, mentioned that “supply bottlenecks & the disruption of supply chains… seems to be continuing, and, in some sectors, accelerating”. Lagarde, speaking at the ECB Forum on Central Banking, specifically pointed to “shipping and cargo handling” as the key areas of focus. During the same Forum, Jerome Powell, Chairman of the Federal Reserve, noted that bottlenecks & supply chain issues are “not getting better & in fact are getting a little bit worse”.
The point is, supply constraints are a significant area of focus, which is why I’m proud to have been studying this topic & publishing data on it since I started this newsletter in May 2021.
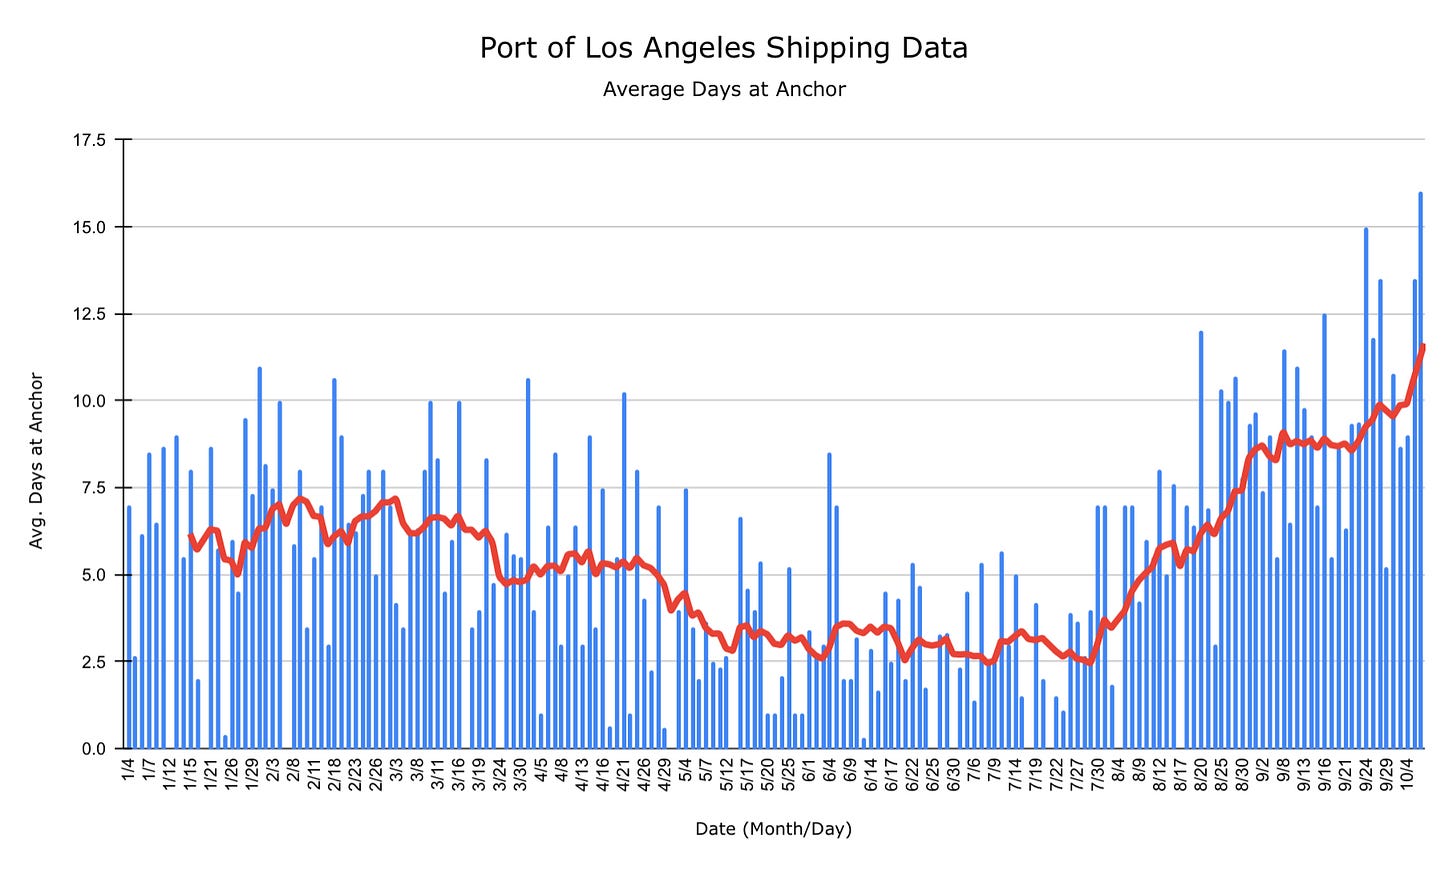
First, I want to dive into some data that I analyzed from the Port of Los Angeles, which is the largest port in the United States for over 20 years. I was tipped off to analyze this data by Jeffrey Kleintop, Chief Global Investment Strategist at Charles Schwab, in a back-and-forth discussion we had on Twitter. As a result of that convo, I put together the following data, which helps to show just how clogged the most critical port in the U.S. really is:
The graph above shows the average days at anchor for container ships coming into the port in 2021. Due to extreme bottlenecks and labor constraints, these container ships are being forced to simply hang out at sea as the other ships get offloaded. As we can see, the first quarter of the year was very consistent, followed by a steady decline in Q2. However, ships have been sitting idle for substantially longer since the end of July. I’ve added a 10-day moving average in red so that we can see a smoothed-out version of the data. It’s extremely clear that the most critical port in the U.S. is log-jammed, but there’s even more data to confirm.
Below is an exact snapshot as of 10/6/21 of the current situation at the Port of Long Beach, the second largest port in the U.S.:
Each circular icon represents a ship that is currently at anchor off the coast, with green dots representing container ships and red dots being tankers. Even more worrisome is that there are a multitude more ships that are anchored further off the coastline waiting to be ushered in. To see what this looks like in a more tangible way, Steve Hanke, an economist at Johns Hopkins University, posted the following on Twitter on 9/28:

Finally, research from JPMorgan Chase shows a great collage of data on this very topic. The theme is: delivery times are very slow, the number of anchored containerships is nearly double what it was in January 2021 (and accelerating), and the freight rate to transport a 40ft container is more than 5x what it was in January 2020.
It’s clear that, on the aggregate, the market is very distorted right now. I don’t necessarily want to discuss the causal factors that have put us in this environment, but perhaps I’ll save that for a future newsletter. All that I can do is identify the issue and consider the impact that it has on broader economic factors, such as inflation. As a matter of fact, these supply chain bottlenecks are causing corporate executives to have elevated concerns about inflation. In their most recent Q3 earnings calls, there were 11,047 mentions of “inflation”, marking a new all-time high.
Certainly, there’s a correlation between the two & this will continue to be an extremely important dynamic to monitor going forward. I’m glad to see it’s getting more attention, even becoming a mainstream topic in financial market news.
Stock Market:
No update. I’m going to go out on a limb here and say that the S&P and the Nasdaq gain at least an additional 8-10% from these current levels through the end of 2021. At the present moment, here are the current prices of each index as of market-close on 10/6:
S&P 500 ($SPX): $4,363.55
Nasdaq-100 ($NDX): $14,766.75
Cryptocurrency:
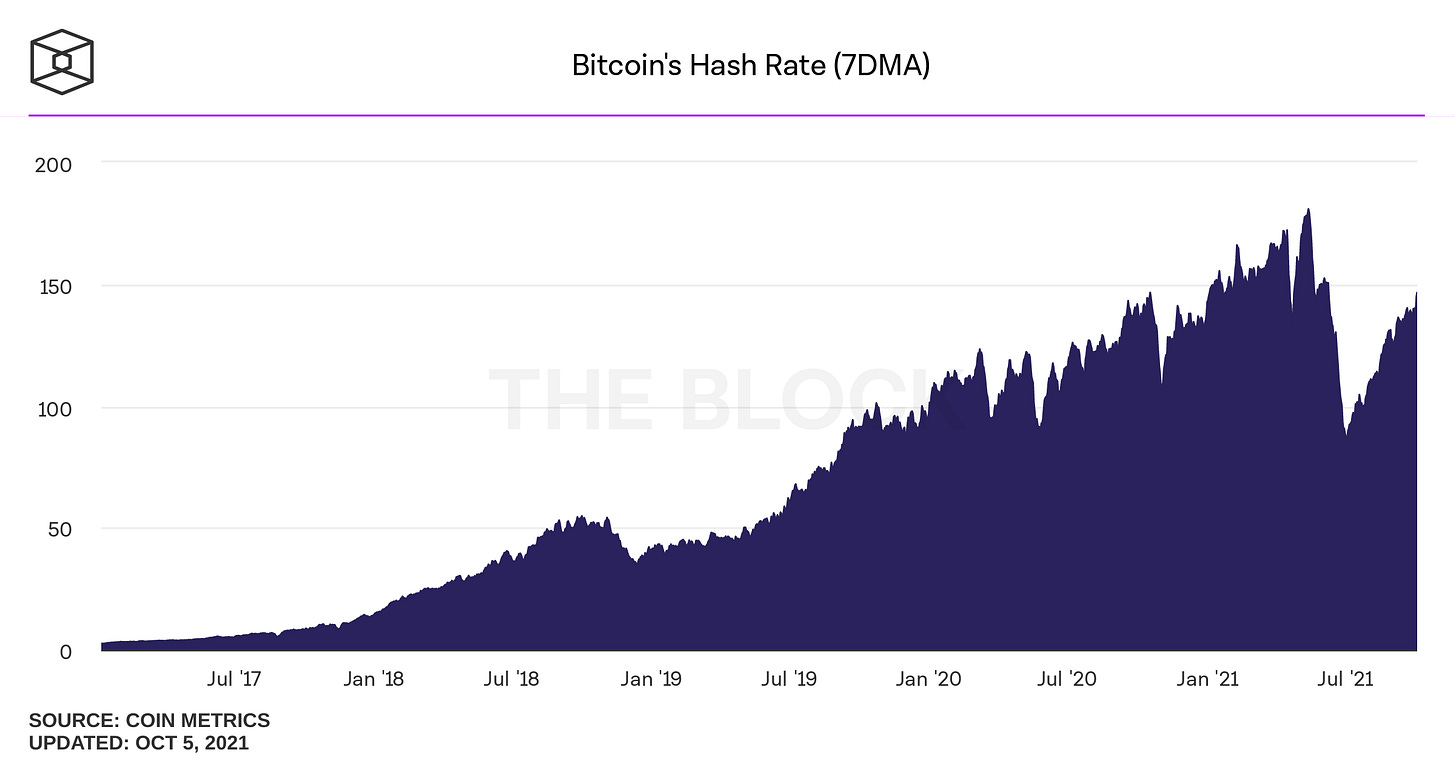
One of the big narratives about Bitcoin over the past four months has been the compute-power of the network. This was an extremely important matter, particularly in an environment where China had banned Bitcoin miners from operating within the country. As a result of that ban, the capacity of the network fell by -50%. Despite this massive decline in operational capacity, each block of transactions continued to get verified & validated on the programmatic schedule of 10 minute intervals. It’s truly a beautiful thing, helping to show just how anti-fragile Bitcoin is as a monetary system & monetary network.
We can track the total compute-power of Bitcoin miners over time, as shown by this chart from 2017 to the present. We can see the massive decline in May, peaking at 180 exahash/second (EH/s) and falling to a low of 88 EH/s. (It’s worth noting that these figures are tracking the 7-day moving average).
As a reminder, one exahash is equivalent to 1,000,000,000,000,000,000 (1 quintillion) calculations per second. At the present moment, the Bitcoin network has a total hash rate of 147 EH/s, or 147 quintillion calculations per second. When I refer to the tangibility of Bitcoin, the fact that there are enough computers operating with the sole function of providing network security transaction validation, and also competing for the rights to be able to do so, this is what I mean. It’s quite similar to Amazon’s AWS division providing cloud infrastructure and data warehousing. The cloud is an intangible fragmentation of real assets that are powering that system. Nonetheless, society gains a great deal of tangible value from cloud-services. Bitcoin is the same.
So far, the Bitcoin network has recouped more than 50% of the total mining capacity that was lost as a result of the China ban. I fully expect this figure to reclaim the previous ATH’s as those miners get reoriented and transferred to new locations around the world, especially as El Salvador’s volcanic plants come online. For those who haven’t seen this, the video below is a new Bitcoin mining facility in El Salvador, using fully renewable, volcanic energy to power the electricity demands of the mining facility.
Bitcoin’s network will continue to become more & more reliant on renewable energy & sustainable sources, faster than any other industry in the world. This should be celebrated!
Talk soon,
Caleb Franzen


