Edition #101
Oceanic Shipping + Inflation, S&P 500 Ends Monthly Streak, Bitcoin in Q4's
Economy:
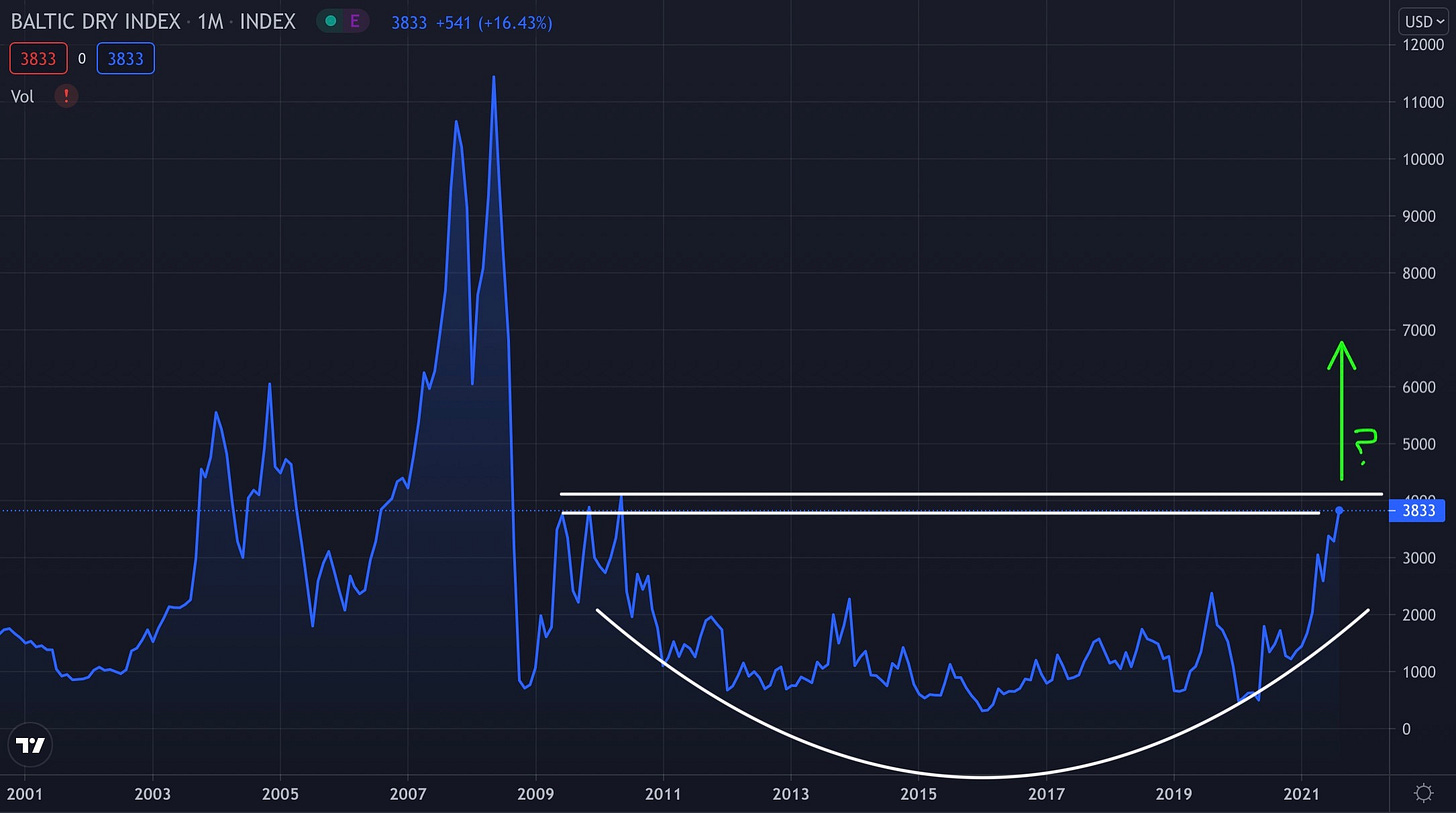
Since the start of this newsletter, one of the primary dynamics we’ve reviewed in this section has been focused around shipping & container rates. The reason why I’ve been so focused on these factors is because it gives additional insights on inflation & supply bottlenecks. On August 19th, I shared the following chart that I created about the Baltic Dry Index (BDI) in Edition #80:
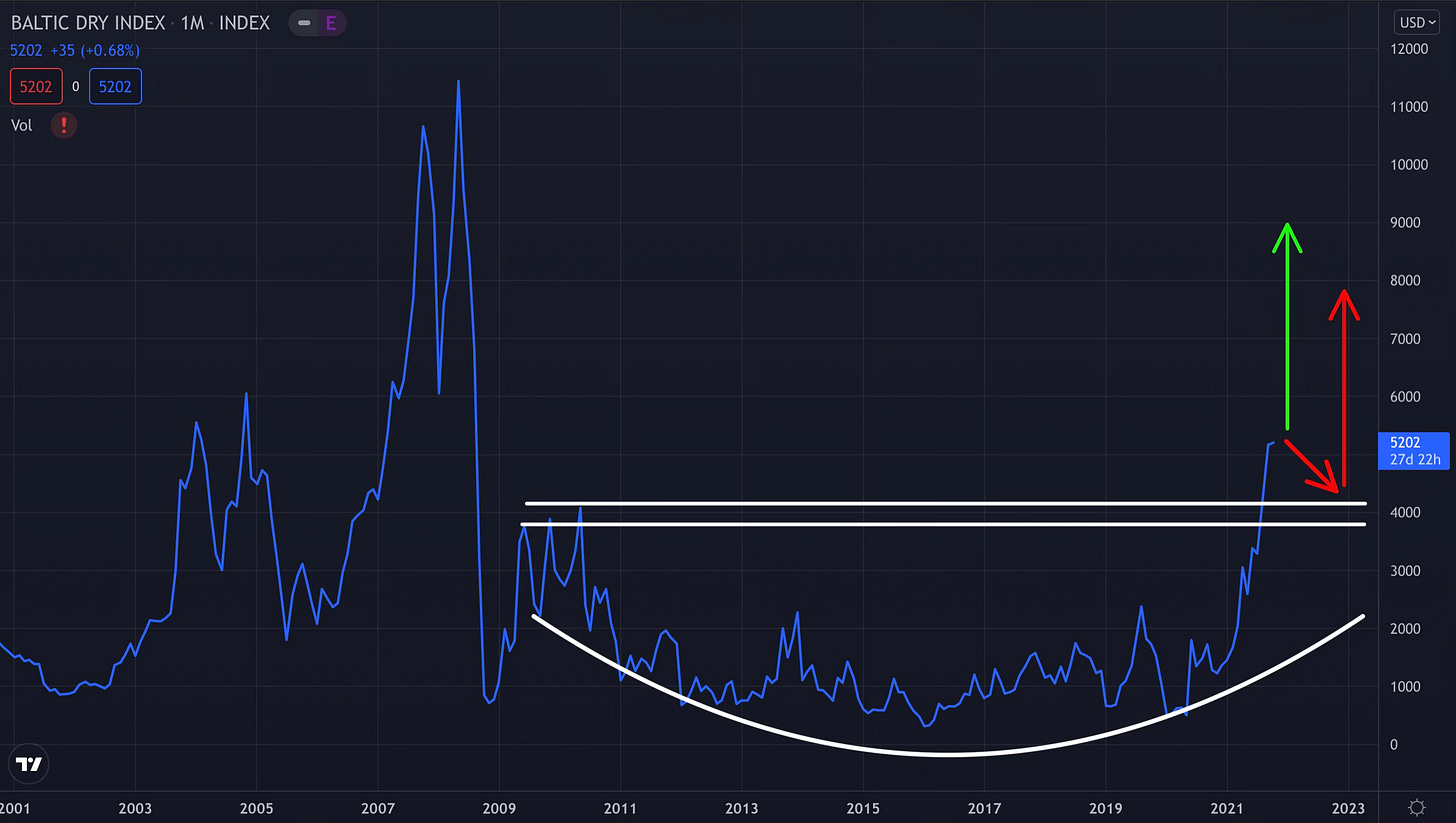
The point of this chart was to explore the potential that the BDI could break out of the base & extend even higher. At the time, it was uncertain as to whether or not the breakout would occur, but we now have some resolution. Here is the most recent chart:
We’ve officially confirmed a breakout extension, implying that the MOST LIKELY scenario is for the BDI to continue to ascend higher. As with all breakouts, I’m prepared for the index to decline, retest the breakout zone, and then continue to climb higher. Either of these two scenarios are the most probable cases in my opinion, and the fundamental factors to enable these extensions are in place. The technical analysis I’ve provided is always more powerful when the fundamental thesis remains strong.
As it relates to inflation, this is an important variable to continue to monitor. As global supply disruptions remain sticky, as will inflation. Additionally, while CPI inflation has begun to stabilize, the Federal Reserve’s preferred measure of inflation has continued to inch higher. Personal consumption expenditures (PCE) figures for August were released on Friday morning, in which the headline figure reflected a +4.3% increase year-over-year. This was the highest reading of the year after consistent increases over the past several months. From April to July, the prior results were +3.6%, +4.0%, +4.0%, and +4.2%.
The core PCE figure, which excludes food & energy prices, came in at +3.6% for the third consecutive month. In regards to the core PCE data, it’s fairly clear that the U.S. economy is in a fairly unique situation:
The core PCE figure hasn’t been this high in at least 30 years and the rate of acceleration is quite unprecedented. In fact, I had to find an additional data source to confirm if we’ve ever accelerated quite this fast before. Going back to 1959 when data started to be collected, the only other time we’ve seen a sustainably higher acceleration in PCE was in the early 1970’s. During this time, from 1972-1974, the annual core PCE change increased from +2.5% to +11.9%. Fingers crossed that the uptick in inflation truly is transitory and that we don’t experience a repeat scenario of the 70’s.
Stock Market:
At the start of September, we covered some great information from LPL Research showing the performance of the S&P 500 after having at least seven consecutive months of gains. Broadly speaking, the table showed a very positive outlook for the S&P 500 going forward, showing that strong momentum continued to push the index higher on average. As a reminder, this was the table we covered:
Unfortunately, the streak has now come to an end as the S&P 500 had a return of -4.79% for the month of September. In the five cases above where the S&P achieved exactly seven consecutive months of positive gains, the index was higher 60% of the time twelve months later & the average twelve-month return was +4.16%. This seems to paint a less enthusiastic outlook than the aggregate data would suggest, implying that strong momentum can be an important factor for stocks returns going forward. Does the end of this streak necessarily force me to reduce the enthusiasm of my positive outlook? Not necessarily.
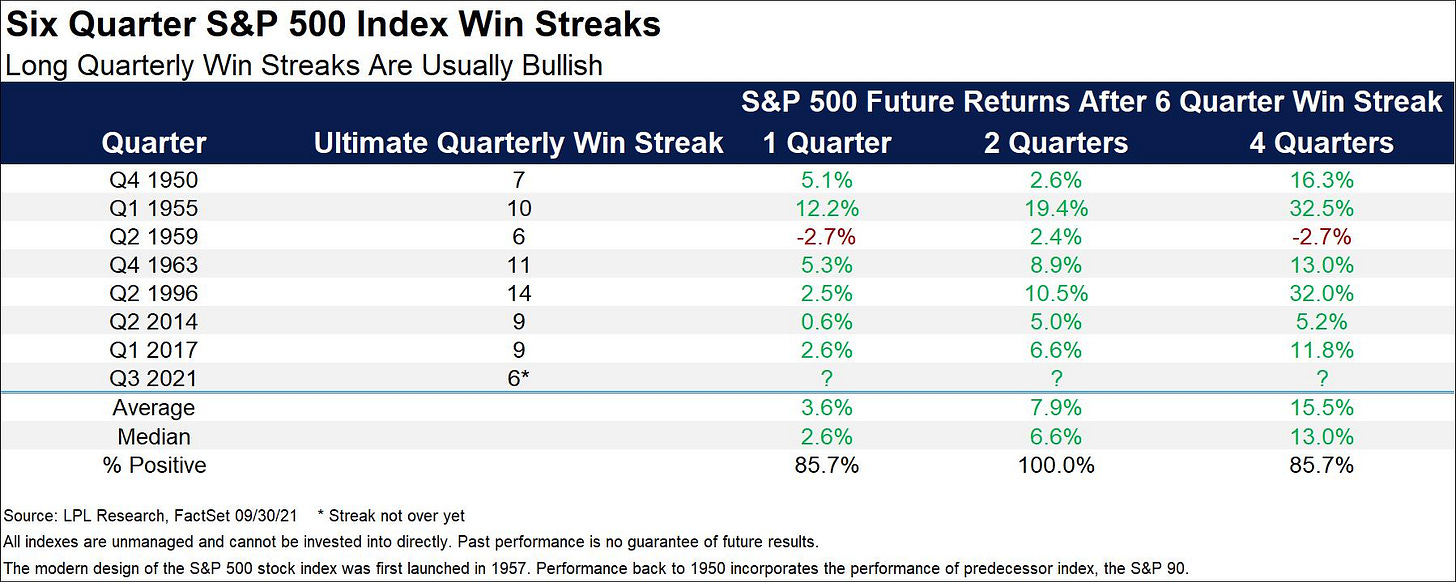
Newly published research from LPL shows similar data, but uses quarterly streaks rather than monthly:
This look on the data still shows an extremely optimistic outlook, with only 14.3% of cases having a negative twelve-month return. From the seven prior instances, the average twelve-month return going forward was +15.5%; however, it’s important to note that the only case where the index was lower one year later was in 1959 when the index could “only” achieve six consecutive quarterly gains.
Very clearly, I don’t expect that the S&P 500 will achieve a +15.5% gain over the next twelve months. This data simply speaks to the probabilities we are facing in the market right now, and the probabilities are still largely optimistic over a 3, 6, and 12-month basis. Investors with a long-term time horizon and a buy-and-hold approach should see this data and reaffirm a high degree of confidence to simply stay the course.
Cryptocurrency:
I’ll keep this extremely simple as we officially move into the fourth quarter of 2021… The chart below from Will Clemente shows the price of Bitcoin in logarithmic scale (optimal for evaluating exponential functions) which highlights the performance of Bitcoin in each Q4 that the data is available.
Typically, it does okay. My Bitcoin allocation continues to be my largest single holding (by far) and even outweighs the sum of my entire equity portfolio.
Talk soon,
Caleb Franzen


