Investors,
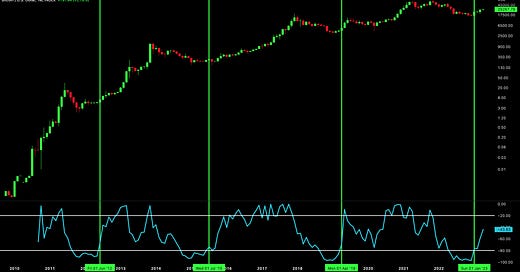
Considering that it’s April 30th, the monthly close for Bitcoin will be finalized this evening. This means that the monthly datapoint for the 12 & 24-month Williams%R oscillator will also be finalized, so I wanted to provide an update on both of these metrics since they are the two most important long-term statistical indicators that I’ve discovered for Bitcoin.
Here’s what you need to know:
1. The 12-month Williams%R Oscillator: Continues to extend higher, confirming that we have left the “accumulation”/oversold zone after the Jan.’23 monthly close. This continues to reflect bullish price dynamics, based on the 100% effectiveness of the signal.
2. The 24-month Williams%R Oscillator: Remains above the “accumulation”/oversold zone that flashed for the March 2023 monthly close. The indicator also rose in April relative to the March monthly close. That’s a great sign!
On the aggregate, both of the 1-year and 2-year datapoints continue to suggest bullish dynamics from a statistical perspective for the price of Bitcoin. While statistics do not operate in a vacuum absent of macroeconomic fundamentals, monetary policy, or geopolitical risks, we should not be quick to dismiss or reject the evidence provided over the past 10 years which clearly indicates bullish behavior.
As I outlined in March, the simultaneous occurrence of both of these signals has triggered my DCA purchases.
That’s just what I’m doing. It’s not necessarily what you should be doing.
I have amazing data to share with you in this premium edition, so I’m excited to dive into the details and share the most important market dynamics, trends and charts that you should have on your radar. To support my research and benefit from the takeaways, consider upgrading to a premium membership using the link below:
There are four main topics in this report:
Analysis & takeaways of the S&P 500’s under-the-hood metrics & market internals
A deep-dive on earnings season and the key data so far
An overview of my Bitcoin outlook, citing the key signals giving me a bullish tilt.
Finally, the main aspect of this report is my long-term analysis of Bitcoin relative to stocks, highlighting the 4 primary charts and key levels that are paramount to know and understand.


