Disinflation Is Sticky
Investors,
I remain unconcerned about inflation dynamics and continue to reiterate my expectation for disinflation. Prior to the release of the Consumer Price Index data for July 2023, I shared an intentionally contradictory (but true) post on Twitter, stating:
“The July CPI report won't show disinflation on a YoY basis, but it will still show disinflation on a YoY basis.”
How could both of these things be true? The results of the data prove it to be true!
While headline CPI inflation (YoY) reaccelerated from +3.0% in June 2023 to +3.18% in July 2023, the broad-based alternative metrics for CPI continued to decelerate:
Core CPI decelerated from +4.83% to +4.65%.
Median CPI decelerated from +6.44% to +6.09%.
Trimmed-mean CPI decelerated from +5.02% to +4.79%.
Across the board, the average component of the CPI is still showing disinflation, despite headline CPI “accelerating” from +3.0% to +3.18% YoY. Can we really even call this an acceleration? Particularly when expectations were calling for a result of +3.3%?
The CPI results, as far as I’m concerned, are still tracking towards my sub-2% prediction by the end of this year and I stand by that prediction in light of this data.
I’m truly bored of the discussion around inflation; however, it’s so vital to get the disinflation thesis correct because it’s arguably produced one of the strongest tailwinds for equities to rise in 2023. Amidst a decisive disinflationary trend that continues to face unwarranted doubts, equities and Bitcoin have thrived.
Despite volatility in markets over the past two weeks, here are the YTD returns for a variety of major indices and assets:
Dow Jones $DJX: +6.45%
S&P 500 $SPX: +16.25%
Nasdaq-100 $NDX: +37.4%
Equal-weight Nasdaq-100 $QQQE: +20.75%
Russell 2000 $RUT: +9.3%
Bitcoin $BTC: +78%
Ethereum $ETH: +54%
Total Crypto Market Cap $TOTAL: +33.3%
Total Altcoin Market Cap $TOTAL3: +16%
If you’ve correctly predicted disinflation, you’ve likely done quite well in the market.
Since CPI inflation peaked in June 2022, which was released on July 13, 2022, the S&P 500 has gained +18.1%, more than doubling its typical 1-year rolling return.
I’ll say it again: If you’ve nailed disinflation, you’ve probably nailed the market.
Therefore, while it’s a laborious and nuanced topic, it’s vital to continue to get inflation right. If inflation re-accelerates, asset prices will likely struggle. If disinflation persists, asset prices will likely thrive.
This report will be dedicated to this topic, in order to present why the disinflationary thesis is still intact and perhaps stronger than ever.
I will warn you… I am biased, but only because my objective review of the data is still pointing to disinflation. If you want to believe that inflation will reaccelerate, feel free to disregard this report. If you believe that inflation will reaccelerate, but you want to understand the disinflationary thesis better, read on. If you believe in disinflation and want more ammo to defend your perspective, read on.
Context Matters:
Contextualizing the data and the broader trend is key.
The YoY rate of inflation was +6.35% in January 2023 and it has steadily decelerated in every single report through June 2023. In fact, data from Bespoke indicates that this was the longest streak of consecutive YoY declines in the CPI’s history:
In other words, we’ve never seen such decisive disinflation in the modern history of the United States. The streak has ended with the release of the July CPI data, but I also want to acknowledge the path of inflation (YoY) over the past four months:
April 2023: +4.9%
May 2023: +4.0%
June 2023: +3.0%
July 2023: +3.2%
If inflation had fallen from 4.9% to 4.0% to 3.2%, we’d all be cheering. But it didn’t and now everyone is panicking about inflation again, which is eerily reminiscent of the re-acceleration in Personal Consumption Expenditures (PCE inflation) back in Apr.’23.
Upon the release of the April 2023 PCE, I provided reassurance that brief upticks in the YoY rate of inflation is common amidst a broader trend of disinflation. The PCE data didn’t scare me then, and the CPI data doesn’t scare me now, particularly when we continue to see core, median, and trimmed-mean CPI decelerating in the latest data.
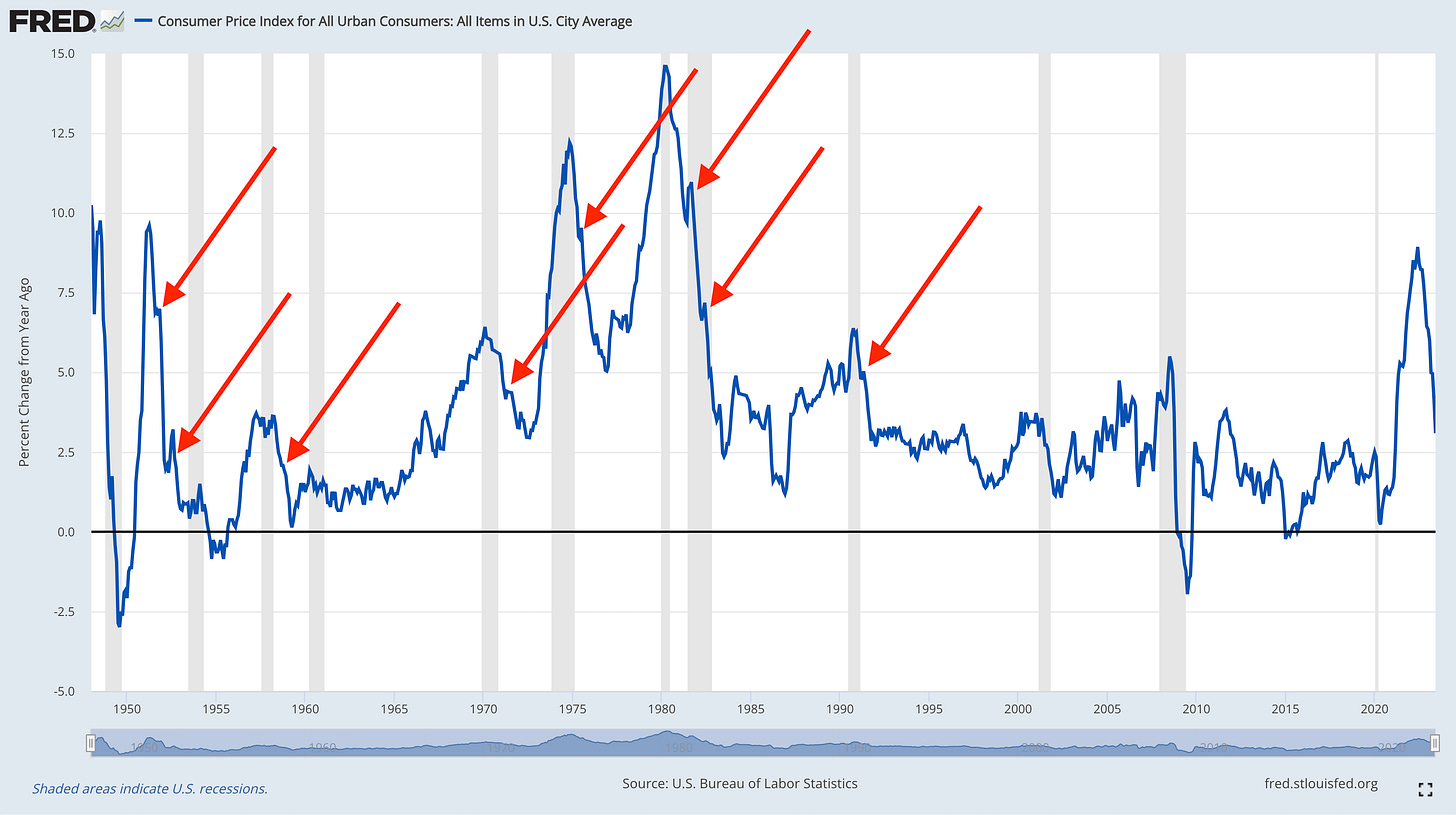
In fact, it’s also quite common for CPI inflation (YoY) to briefly uptick within a broader disinflationary environment:
There are many more such cases of a re-acceleration, but I’ve highlighted the main ones above. In fact, the latest CPI release isn’t even discernible in the grand scheme of things!
One report (even two or perhaps even three) doesn’t buck the trend of disinflation, particularly because core, median, and trimmed-mean CPI are still decelerating. The data from July on a headline basis wasn’t great, but the general reaction & sentiment to the data feels sensationalist in order to speculate that inflation will re-accelerate due to the end of base effects and energy prices grinding higher. Thankfully, inflation is caused and influenced by dozens of other variables aside from base effects and energy prices.
Debunking Energy Fears:
In the latest CPI data, energy components faced significant deflation YoY:
Energy: -12.5% YoY
Energy Commodities: -20.3% YoY
Gasoline: -19.9%
Fuel Oil: -26.5%
This fits exactly within the expectations that I laid out in advance of the CPI data by relying on the average monthly price of crude oil in Cushing, Oklahoma.
Crude oil has been rising, yes. Since the June 2023 lows, almost exactly two months ago, WTI crude oil has rallied +24%. Despite this astounding gain, the average weekly price of crude oil is down -14.7% YoY, as of Wednesday, August 9th. For the week ending August 9th, the average price of crude oil was $81.21/barrel. In August 2022, the average monthly price of crude oil was $93.67. This means that crude oil will need to rise another +15.3% in the remaining 3 weeks of the month in order to be unchanged YoY.
Could this scenario happen? Yes, but I’d suggest that it’s unlikely.
It’s worth noting that the average monthly price of crude oil was above $84/barrel in August, September, October, and November 2022, implying that crude oil will need to rally & stabilize above $84 in order to be unchanged YoY. In fact, the average price of crude oil in Q3 2022 was $93.06/barrel. As such, I expect to see deflationary crude oil dynamics through the remainder of the third quarter (August & September 2023 CPI data), which is likely to produce broader disinflation in the aggregate CPI.
Shelter Inflation:
It’s necessary to understand that the Shelter component of the CPI is the largest component, making up 35% of the headline weighting and 40% of core. Given that the Bureau of Labor Statistics (BLS) relies on “soft data” to measure Shelter via Owners’ Equivalent Rent (OER), it’s well-known that Shelter lags the actual housing/rental market by a substantial degree. By the Federal Reserve’s own admission Shelter lags the private housing market data by 3-4 quarters, or more acutely by 8-12 months.
This is something that we’ve been addressing since last year and was one of the key components of my strong disinflationary outlook for the middle of 2023 — once Shelter starting to catch up with private market data, we’d see broader CPI dynamics decelerate substantially. So far, that’s exactly what we’ve seen, though I’ll admit that Shelter has been stickier than I anticipated.
In the July data, Shelter increased at a pace of +7.7% YoY vs. +7.8% in June 2023.
Shelter has peaked & decelerated, but it’s been a slow process since the inflationary peak of +8.2% in March 2023 (recall, the housing market peaked in June’22 therefore matching the 8-12 month lag of Shelter).
Given these lag effects, it’s important to ponder what the CPI would look like if we swapped actual, private market data for the housing/rental market instead of Shelter.
Thankfully, the team at WisdomTree has been all over this and provided an update for July 2023, suggesting that the CPI inflation rate on a YoY basis was +0.5%.
By simply swapping Shelter out and using the Zillow Rental Index & the Case-Shiller housing data, the CPI is growing at a pace of +0.5% vs. the BLS’s reported +3.2%. That’s quite a stark difference, suggesting that most, if not all, of the inflationary pressures in the economy are based on the lagging results of OER and therefore Shelter.
OER a flawed statistic, completely distorting the reality of the inflation picture.
I complained about this during 2022, suggesting that inflation was substantially hotter than the official data because the lag effects of OER & Shelter weren’t capturing actual housing market dynamics. I’m complaining about it now, suggesting that actual inflation is substantially lower than the reported BLS data.
I even addressed this two months ago on Twitter/X:
If we look at the Consumer Price Index excluding Shelter, we see the following inflation rate & trajectory:
While it did tick higher in the latest report, the +1.0% result implies that broad-based inflation dynamics have returned to their historical norm and is actually at the lower region of it’s long-term range. However, most of this “re-acceleration” is coming from less accretive energy prices on a YoY basis…
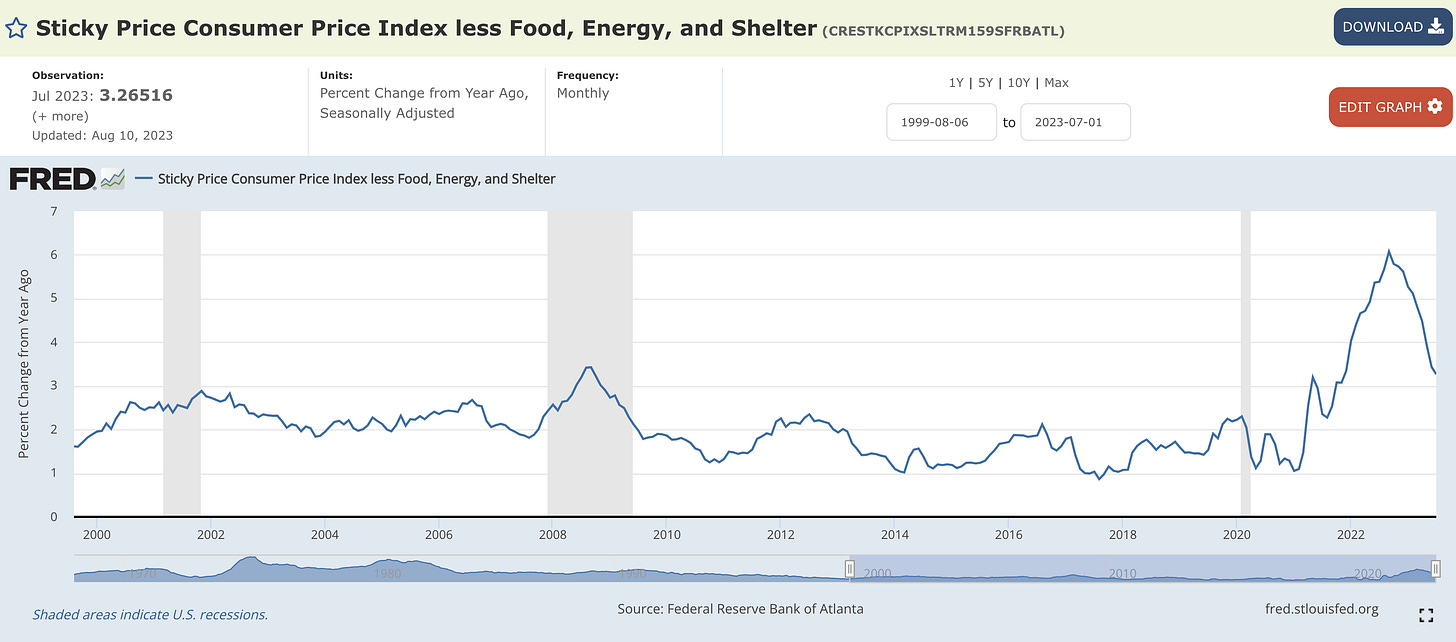
Even the intentionally sticky & slow-moving Sticky Price Index showed further disinflation in the latest data, helping to reflect how goods/services inflation is evolving if we ignore the impacts of food, energy, and shelter.
To be clear, I’m not saying that this is the real inflation rate because it’s clear that most of our day to day expenses involve food, energy, and shelter prices; however, I do think that this is an effective proxy for measuring how the prices of other goods & services are evolving within the economy.
The takeaway: more disinflation.
Food Inflation:
Given our discussion of inflation excluding food, energy, and shelter, we still need to address the dynamics for food inflation. The quick takeaway is that food inflation (both at home and at restaurants) is too high, but it’s experiencing disinflation and continues to decelerate at a substantial pace.
Here are the charts:
Food at home is rising at a pace of +3.6% YoY (down from. +4.7% in June), and it’s down from the peak of +13.5% in August 2022. As we can see from this chart going back 20 years, grocery inflation is back within the historical norm.
Food away from home, aka restaurant inflation, has been much stickier, but it’s decelerating quite decisively now. The latest data in July showed a deceleration to +7.1% YoY from +7.7% in June 2023.
The fact of the matter is that food prices are in disinflation, unquestionably.
Indeed, food prices are still rising, but they’re rising at a slower pace and moving back towards their historical levels.
New & Used Motor Vehicles:
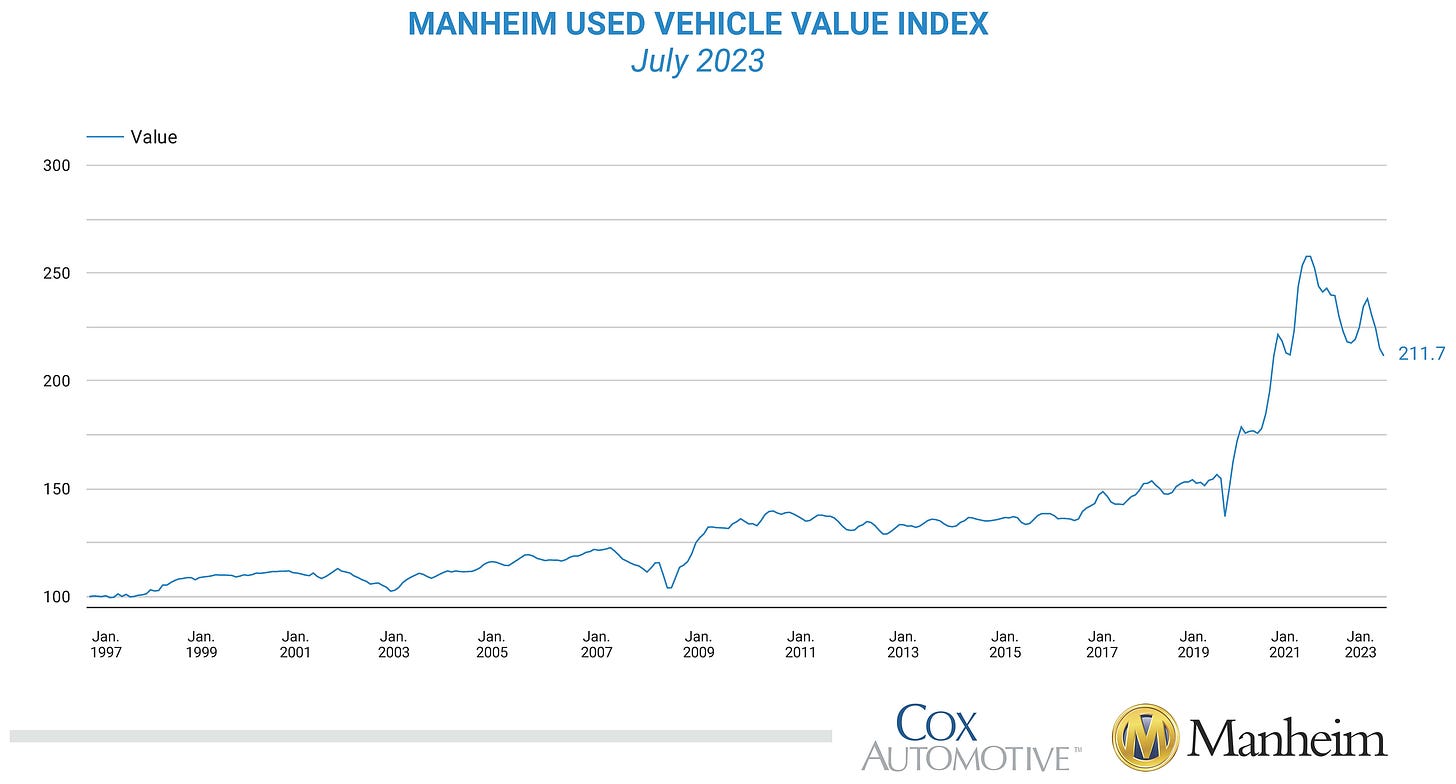
I’ll keep this super straight-forward & brief, the car market has completely cooled off.
On a YoY basis, new & used motor vehicle inflation was -0.2% in July vs. 0.1% in June.
Even the Manheim Index, a private market datapoint for used vehicles, continues to reach new multi-year lows:
Given this massive deceleration & contraction, we should expect for the BLS’s data for new & used cars to experience significant deflation in the months ahead, particularly given that it’s already experiencing deflation now.
Disinflation Is Sticky:
As I forecasted at the beginning of the week, the July CPI data didn’t show disinflation, but it did show disinflation. Inflation is a nuanced topic, which requires us to analyze key slivers of goods/services and to understand how the CPI itself is composed. By doing so, we can get a firm grasp on how inflation is actually evolving and therefore where it might continue to evolve going forward.
I’m encouraged by the ongoing disinflation in core, median, and trimmed-mean CPI, and it’s also worth acknowledging that both headline & core CPI came in below expectations. Inflation continues to be less hot and less sticky than the market forecasts, and I suspect that this will continue for the remainder of the year, particularly as Shelter starts to make more noticeable progress towards disinflation.
As I look forward, I see the following disinflationary aspects:
Student loan repayment will reduce aggregate demand
Credit creation is decelerating YoY
Wage growth is decelerating YoY
Supply chain bottlenecks are gone
M2 is contracting YoY
Deposits are contracting YoY
Reserves are contracting YoY
Supply chain bottlenecks have evaporated
Energy prices are still contracting YoY
Shelter is decelerating YoY
Used cars are contracting YoY
Core, median, & trimmed-mean CPI are in disinflation
The quits rate is falling
Average weekly hours worked is falling
China PPI is in deflation, which leads U.S. CPI
China CPI is in deflation, which leads U.S. CPI
ISM Services Prices Paid is declining
Services diffusion indexes are declining (leading CPI by 3-6 months)
The real federal funds rate is positive
300 basis points of rate hikes haven't been felt yet
The Fed probably isn't done hiking yet
Given the weight of the evidence and the probable disinflation coming for Shelter, the largest component of the CPI, disinflation is likely to persist. Given the lag effects of monetary policy, which are long and variable, I expect to see the Fed’s rate hikes ripple through the economy through the remainder of the year and into 2024, followed by the Fed holding rates at a restrictive level. As inflation falls and yields remain elevated, higher positive real rates should theoretically slow down economic conditions from a Keynesian model of economics.
Given this outlook for more disinflation, I believe that beneficial tailwinds will remain for the stock & crypto markets. The market has been producing higher highs and higher lows for 10+ months, the very definition of an uptrend. We’ve been experiencing strong multiple expansion and have seen two consecutive quarters of better than expected earnings results.
Disinflation + stronger earnings + stronger economic data + nearing the end of the rate hike cycle has been a perfect recipe for market returns and the development of an uptrend. While these conditions could change in the future, I don’t see any evidence that it’s changed yet. That’s why I’ll continue to provide weekly updates on how market & macro conditions are evolving in order to stay on top of the trend.
In May 2021, in my very first newsletter, I stated my prediction that CPI inflation would reach between 7% and 10% YoY. At the time, CPI was +4.1%. Sure enough, inflation peaked at +9.1% in June 2022.
In December 2022, upon the release of the November 2022 CPI data, I stated firmly that disinflation would persist. In every single CPI report of 2023, I’ve expressed a belief that CPI would come in below estimates, and that’s exactly what’s taken place. I wasn’t first to the disinflation story, but I certainly wasn’t last and I’ve tried to provide meaningful and factual evidence to support my outlook. If you disagree with the ideas expressed above, I’d love to hear why, but “base effects” and “energy prices” aren’t valid enough to convince me otherwise (yet).
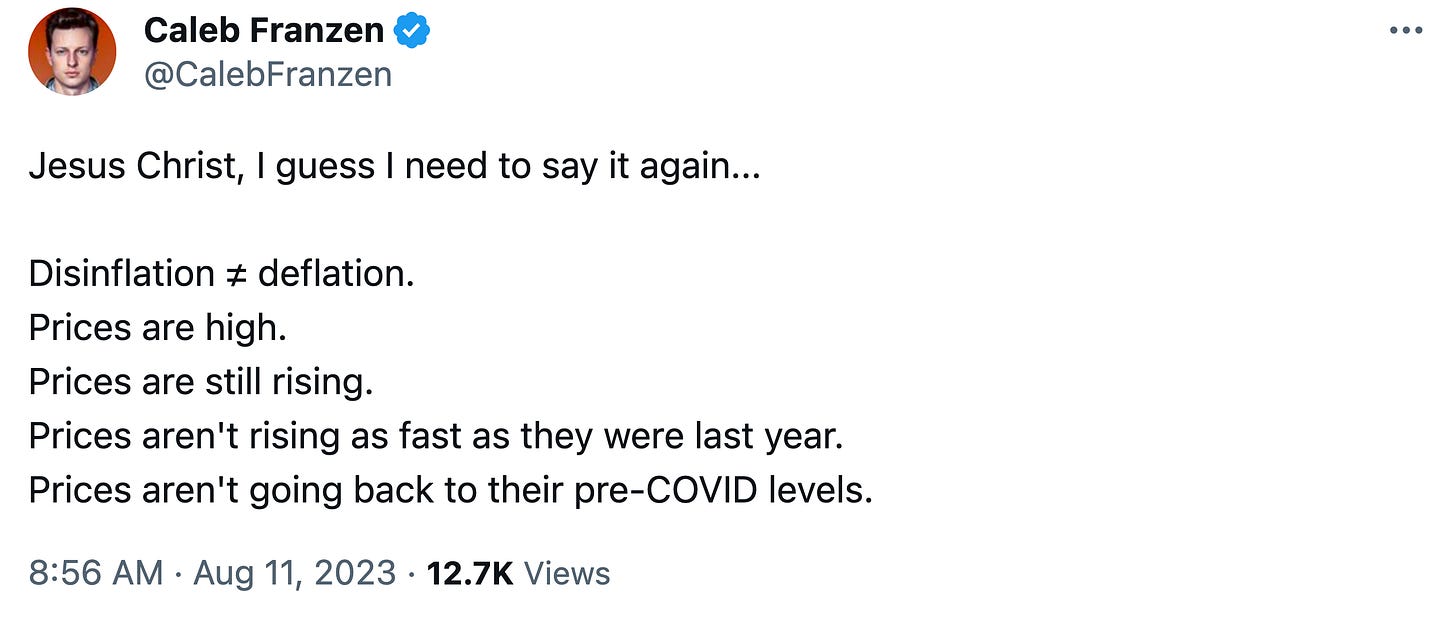
It’s important to remember the following, which I shared on Twitter/X:
If you made it this far, I appreciate your attention and interest.
Stay diligent, my friends.
Caleb Franzen
SPONSOR:
This edition was made possible by the support of MicroSectors, a financial services and investment company that creates an array of unique investment products and ETN’s. Their NYSE FANG+ products are the only one of their kind, allowing investors to gain exposure, leveraged/un-leveraged and direct/inverse, to the NYSE FANG+ Index. They have a suite of products ranging from big banks, to oil and gas, and even gold/gold miners.
I started a partnership with MicroSectors in 2023 because I’ve been using their products for over a year and it was an organic and seamless fit.
Please follow their Twitter and check out their website to learn more about their services and the different products that they offer.
DISCLAIMER:
This report expresses the views of the author as of the date it was published, and are subject to change without notice. The author believes that the information, data, and charts contained within this report are accurate, but cannot guarantee the accuracy of such information.
The investment thesis, security analysis, risk appetite, and time frames expressed above are strictly those of the author and are not intended to be interpreted as financial advice. As such, market views covered in this publication are not to be considered investment advice and should be regarded as information only. The mention, discussion, and/or analysis of individual securities is not a solicitation or recommendation to buy, sell, or hold said security.
Each investor is responsible to conduct their own due diligence and to understand the risks associated with any information that is reviewed. The information contained herein does not constitute and shouldn’t be construed as a solicitation of advisory services. Consult a registered financial advisor and/or certified financial planner before making any investment decisions.
This report may not be copied, reproduced, republished or posted without the consent of Cubic Analytics and/or Caleb Franzen, without proper citation.
Please be advised that this report contains a third party paid advertisement and links to third party websites. These advertisements do not constitute endorsements and are not necessarily representative of the views or opinions of the newsletter author. The advertisement contained herein did not influence the market views, analysis, or commentary expressed above and Cubic Analytics maintains its independence and full control over all ideas, thoughts, and expressions above. The mention, discussion, and/or analysis of individual securities is not a solicitation or recommendation to buy, sell, or hold said security. All investments carry risks and past performance is not necessarily indicative of future results/returns.


In a disinflation environment stocks are a asset that rises .
Caleb, do you recommend rotating out of tech for the time being to have some extra dry powder when needed? Is there a place you can share your current holdings?