Cracks Are Starting To Surface
Investors,
The labor market is showing significant cracks that are threatening the economy.
This rapid deterioration is likely to create a recursive feedback loop and lead to more weakness, posing an imminent threat to the fabric of our economic system, which in turn can pull the entire stock market down with it.
…
Or at least that’s what Doomers & bears want you to think!
As usual, these folks (who are in the business of selling fear) are living in an alternate reality and continue to beat the same drum of impending doom & gloom. However, their warning calls, both about the economy and the financial markets, have been proven wrong time and time again.
New data, once again, confirms that the labor market is resilient & dynamic.
Here’s what you need to know:
Macroeconomics:
Doomers love to say that labor market data from the Bureau of Labor Statistics (BLS) is being manipulated for political reasons, typically to keep the existing political party in office.
This is a farcical argument to begin with, designed to manufacture a boogie man of economic conspiracy, but even if it is true, the federal government isn’t the only institution that collects & reports on labor market data.
Thankfully, the largest payroll company in the world, Automatic Data Processing (ADP), reports on payroll data every month in their National Employment Report.
For March 2024, ADP reported that private payrolls increased by 184,000 jobs, which came in substantially higher than estimates of 150,000 and prior results of 140,000.
In fact, the results from February 2024 were revised higher from their initially reported 140k to an updated figure of 150k. The upward revision in February marks the second consecutive positive revision, as January data had previously been revised higher from 107k to 111k.
I decided to take this data a step further by analyzing the YoY increase in employment just to ensure that seasonality wasn’t impacting the MoM increase…
With an increase of 140,000 jobs being reported in March 2023, the March 2024 figure of 184,000 represents a massive acceleration in job creation. If we simply analyze the total amount of payrolls on a YoY basis, the growth rate is +1.9%, which is more anemic than I had expected.
Nonetheless, growth is growth and I’ve said it before:
I wont let perfect be the enemy of good.
The largest gains occurred in the construction, financial services, & manufacturing industries and the increase in private payrolls during March were the highest since July 2022. Regarding wage growth, ADP’s data indicates that wages increased at a pace of +5.1% YoY; however, job switchers managed to increase their pay by +10.1%.
On top of that, wages grew across every single industry group, with 6/10 groups reporting wage growth of +5.0% or better.
On the aggregate, the ADP data had no flaws.
Not only is private market labor growing, but it’s growing faster than expected and showing incremental gains on a MoM & YoY basis. Considering that ADP has no incentive to manipulate the numbers, this data negates two of the Doomers’ favorite talking points about the labor market:
That the government is manipulating the data to make it look better than it is.
That revisions will make initial data look much worse than initially thought.
While the ADP data is important, it’s 2nd fiddle to the Nonfarm Payrolls from the BLS.
Median estimates on Wall Street forecasted that the March NFP data would reflect job growth of 200,000 vs. February 2024 results of +270,000.
Instead, the official number came in at +303,000.
Regarding revisions:
January 2024 was revised higher from +229k to +256k
February 2024 was revised lower from +275k to +270k
On net, revisions over the prior two months show that recent data is better than expected, once again debunking the “revision conspiracy” from Doomers.
Going one layer deeper, the unemployment rate decreased from 3.9% to 3.8% (in line with expectations) while the labor force participation rate increased to 62.7%.
The NFP data also showed that average hourly earnings were $34.69/hour and growing at a nominal pace of +4.14%, continuing to reflect that:
Wages are at all-time highs.
Wages are growing at historically strong levels.
Wage growth is decelerating (vs. +4.28% in February 2024).
Wage growth exceeds inflation on MoM and YoY metrics, for CPI and PCE.
Another popular contention from Doomers is that part-time employment is rising and that employees are being forced to work multiple part-time jobs in order to make ends meet.
And they’re right… part-time employment IS rising.
But total employment is also rising.
In other words, as a 10-slice pizza pie gets bigger, the 10 slices will also grow.
When measured on a relative basis, multiple jobholders as a percent of the employed stands at 5.2%. For every 100 people who are employed, only 5 of them work 2+ jobs.
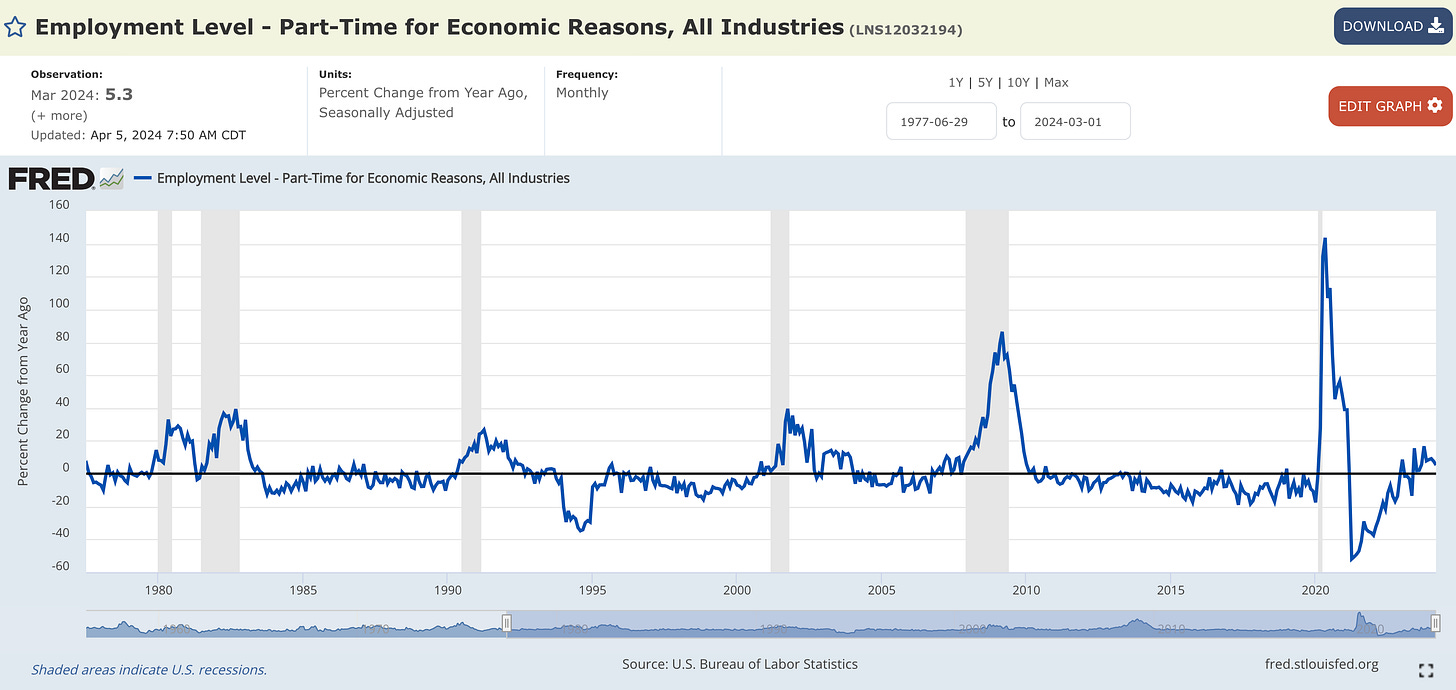
We can take this a step further by isolating the amount of part-time workers in the labor force who want to find full-time employment opportunities but can’t because of “slack business conditions” or “could only find part-time work”.
This cohort of part-time employees are defined as “part-time for economic reasons”, which is an important distinction because there is a cohort of part-time employees who are working part-time positions because they are in school or raising a family.
There are 4.3M employees who are classified as “part-time for economic reasons”, lower than the pre-COVID level in February 2020. While this number has been rising steadily, it’s been trending sideways for 3.5 years and is currently at healthy levels.
On a YoY basis, this cohort has increased by +5.3%.
In the past six recessions going back to 1980, the growth of part-time employees for economic reasons has exceeded +25% YoY. Unfortunately for Doomers, this growth rate has been decelerating since October 2023.
Clearly, the labor market isn’t showing signs that the economy is in a recession.
On the contrary, we continue to see firm evidence that the labor market is resilient & dynamic, which have been the two key adjectives that I’ve used to describe the labor market for 2+ years.
Stock Market:
When I talk to investors, most of them tell me or ask me the same thing about the stock market, generally about the ongoing decline in stock prices.
My response to them is simple: what decline in stock prices?
While there was a heightened amount of volatility & choppiness this week, particularly with Thursday’s -1.26% decline for the S&P 500, the stock market is fine.
Stellar, in fact, as far as I’m concerned.
The index is only +1.15% away from making new all-time highs and only +1% away from securing an all-time highly daily close.
Despite Thursday’s brutal selloff, which resulted in an intraday reversal of -2.1% in less than 4 hours, the index generated a weekly return of -0.95%, in large part due to Friday’s immediate bounce-back recovery of +1.11%.
You’ll notice in the chart above that the S&P 500 is rebounding precisely on the Smart Trail indicator from LuxAlgo, which I recently partnered with after using their indicator packages over the past several months.
I’ve been extremely impressed with this indicator package, especially as I continue to experiment with combining the Signals & Overlays kit with other indicators like moving averages, RSI, the Supertrend indicator, and price structure.
The best traders that I know use a combination of 2-3 indicators to identify confluence and consistent signals across various tools. Depending on different market conditions, they might prioritize certain strategies or specific indicators over another.
Therefore, having a diverse amount of tools at our disposal is key as investors.
I’m excited to have the LuxAlgo indicator in my toolbox now, helping me to identify strong trends, key areas of potential support/resistance, and to improve my risk management process.
If you’re interested in accessing the LuxAlgo kit, check out the different options available in the link above!
Bitcoin:
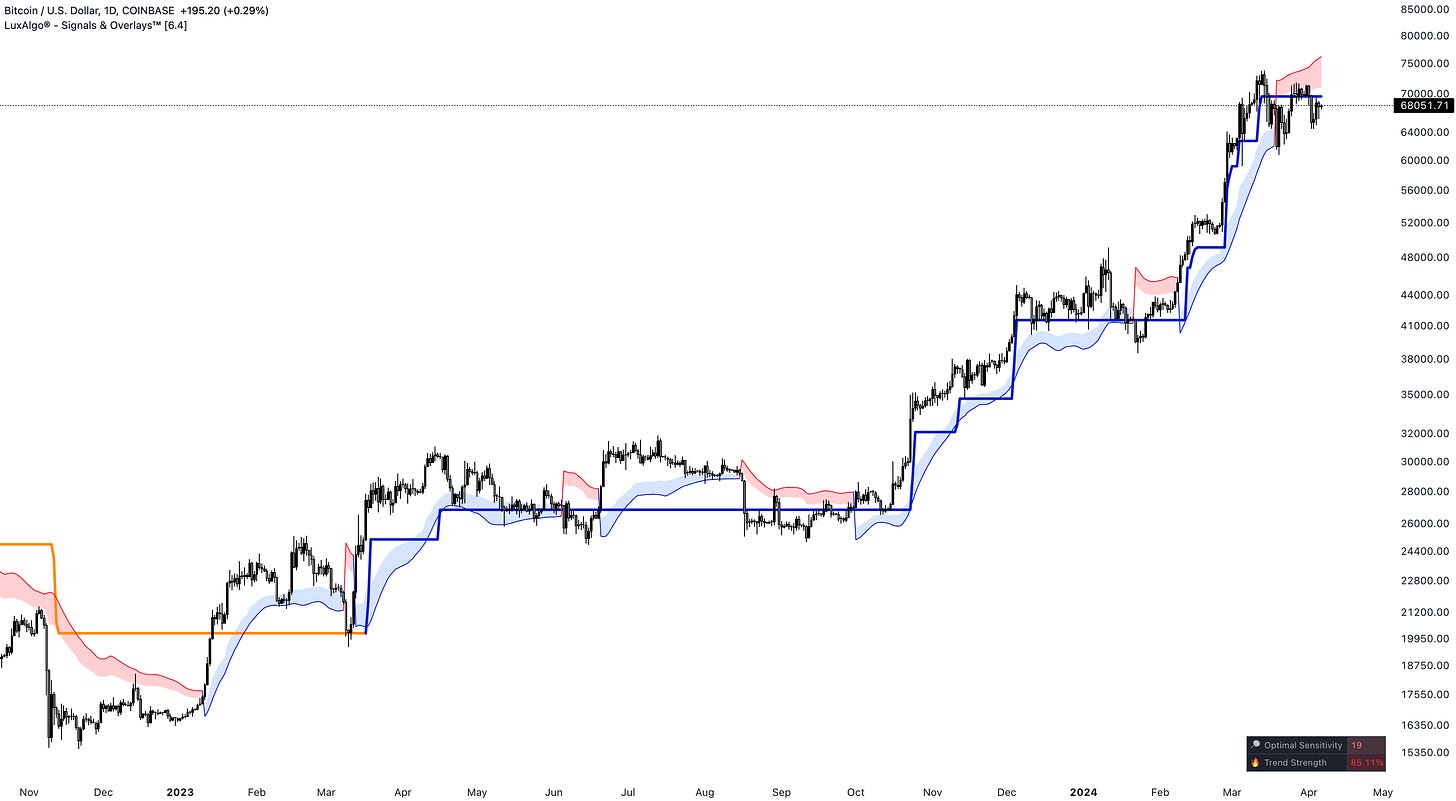
Unlike the S&P 500, which is attempting to use the Smart Trail indicator from LuxAlgo as dynamic support, Bitcoin has been trading in a bearish formation with respect to this indicator & has actually been rejected on the Smart Trail several times.
Fortunately, BTC’s had several of these bearish formations occur in this bull market!
Specifically, we can see bearish clouds (red) in:
November 2022 (which acted as resistance for the last time)
March 2023
June 2023
August 2023 - September 2023
February 2024
In each of these instances, Bitcoin has been able to break above these potential resistance ranges and continue to make higher highs and higher lows.
This latest instance, starting in mid-March 2024, is certainly a justification for more defensive positioning in this market environment, but I also view it as a period of sideways consolidation within a broader uptrend. Therefore, it could be providing long-term investors with an opportunity to increase their allocation if they believe that a breakout is around the corner and that we are in a sustained bull market.
Given that Bitcoin has stayed resilient and is currently trading above $68k, I believe that we’re still in a sustained bull market and that new highs are around the corner.
Whether those highs come next week, next month, or next quarter is irrelevant to me.
Thankfully, I’ll have the LuxAlgo indicator kit to help guide me along the way.
If/when the Smart Trail indicator flips bullish again, I think that will be the major breakout that can carry us to $90k and beyond.
In case you missed last week’s report for premium members of Cubic Analytics, I conducted a deep-dive on long-term statistical analysis for Bitcoin & crypto to examine how long this rally can last.
You can read it here:
Best,
Caleb Franzen
DISCLAIMER:
This report expresses the views of the author as of the date it was published, and are subject to change without notice. The author believes that the information, data, and charts contained within this report are accurate, but cannot guarantee the accuracy of such information.
The investment thesis, security analysis, risk appetite, and time frames expressed above are strictly those of the author and are not intended to be interpreted as financial advice. As such, market views covered in this publication are not to be considered investment advice and should be regarded as information only. The mention, discussion, and/or analysis of individual securities is not a solicitation or recommendation to buy, sell, or hold said security.
Each investor is responsible to conduct their own due diligence and to understand the risks associated with any information that is reviewed. The information contained herein does not constitute and shouldn’t be construed as a solicitation of advisory services. Consult a registered financial advisor and/or certified financial planner before making any investment decisions.


doomers don't even deserve a capital D
Bears are self-punishing themselves. And we need them to build liquidity to the upside! 😄