Investors,
More disinflation is coming, and recent labor market data proves that I’m right.
So let’s talk about it (while also covering the key stock market and Bitcoin charts on my radar right now)…
Macroeconomics:
Job openings at the end of November decreased vs. the prior month, falling to 8.79M.
Historically, the amount of job openings has a clear correlation with the Federal Reserve’s preferred measure of inflation, the Personal Consumption Expenditures. We can see this correlation in the chart below, highlighting both the headline & core versions of YoY PCE inflation:
A similar conclusion can be drawn when looking at core CPI:
The takeaway here is simple:
When job openings sustainbly increase, inflation tends to accelerate.
When job openings sustainably decrease, inflation tends to decelerate.
Within the JOLTS data for November, we also saw the quits rate fall to 2.2% from 2.3% in the prior month. The chart below shows the quits rate for the private sector (2.4%) and the corresponding dynamics for headline CPI & PPI YoY inflation measures:
The notable & persistent decline in the quits rate foreshadows lower inflation.
Moving on to the December nonfarm payrolls data, we saw the unemployment rate remain at 3.7% with +216,000 jobs created during the month, of which a significant amount of jobs created were from non-productive government, education, and/or healthcare segments. Prior months were revised lower by a significant margin, highlighting how data continues to be weaker than we first thought.
These asterisks, of which there are many others, are why I’ve generally avoided calling the labor market “strong”, but instead deferred to calling it “resilient” & “dynamic”.
Returning to the implications for disinflation, the average weekly hours for all employees ticked lower to 34.3 hours/week. This also has an important correlation to inflation dynamics as measured by the YoY change in the CPI:
The conclusion from this data, on the aggregate, is clear: labor market data is telling us that the disinflationary trend is not only intact, but poised to presume going forward. In the event that we see material shifts in the labor market data above that would correlate with increased inflationary pressures, then we can change our conclusions.
Stock Market:
For the sake of this newsletter, I don’t have much to say about the current state of the stock market other than some brief reflections on the degree of panic and concern that I’m hearing from investors.
Everyone feels scared & thinks that we’ve fallen much further than we actually have.
They’re also missing the context of the current environment…
The Dow Jones rallied +16.9% in 44 trading days and has since fallen -0.8% in 3 days.
The S&P 500 rallied +16.7% in 42 trading days and has since fallen -2% in 5 days.
The Nasdaq-100 rallied +20.6% in 43 trading days and has since fallen -3.9% in 5 days.
The Russell 2000 gained +26.7% in 41 trading days and has since fallen -5.8% in 5 days.
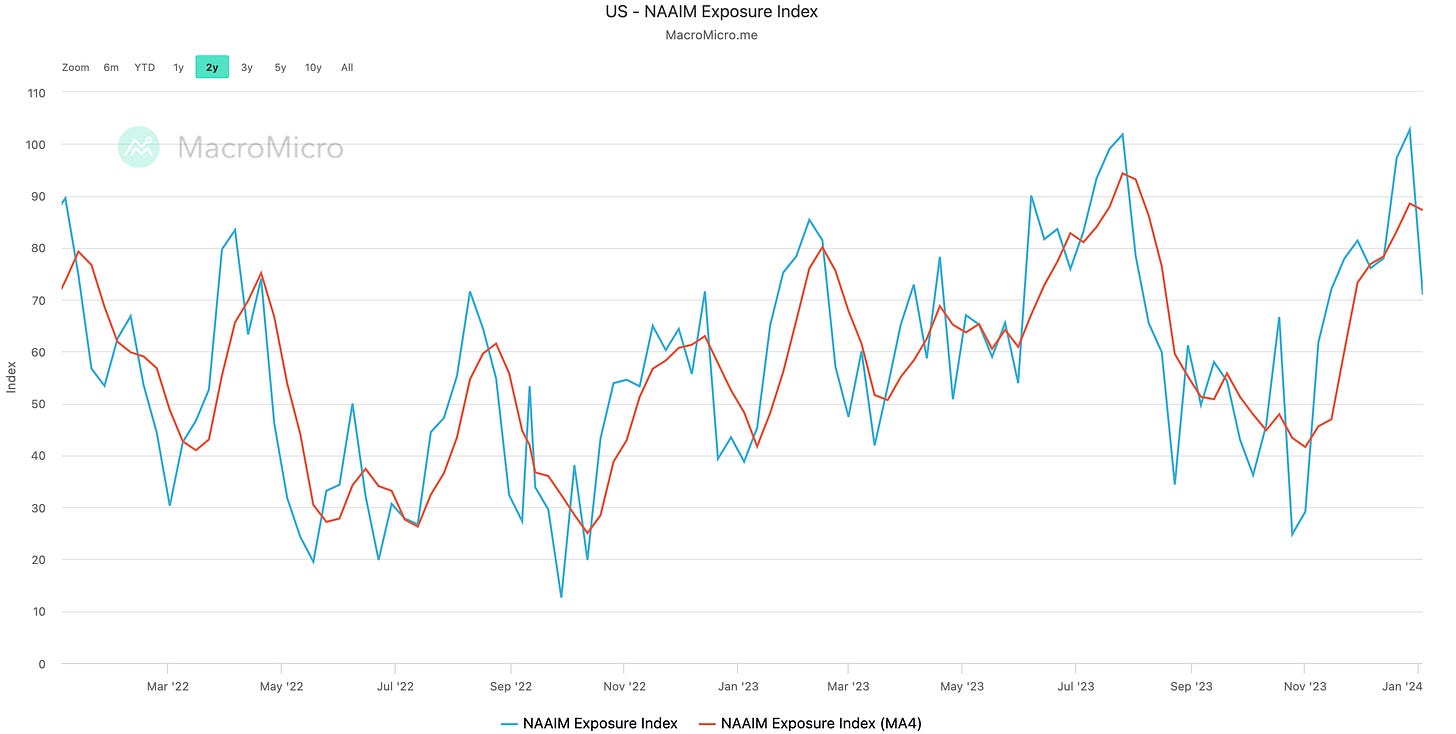
As a result of this modest correction, we’ve seen the National Association of Active Investment Managers survey take a nosedive in terms of positioning (though positioning still remains bullish).
As I look at the market right now, I see no major reason for concern and believe that we are currently undergoing a healthy & normal correction after a fantastic rally. I fully concede that another -3% to -5% decline is not only likely, but constructive.
Consider the following: It’s common for the S&P 500 to have 4 consecutive down days after reaching new 52-week highs, and these signals typically occur during bull markets or multi-year uptrends.

I’ll be providing a thorough review of stock market dynamics with in-depth analysis in tomorrow’s premium report. Consider upgrading to a paid membership below in order to access that report!
Bitcoin:
With spot Bitcoin ETF approvals seemingly imminent (but not without drama), we continue to see constructive dynamics take place in terms of Bitcoin’s price action.
One of the things that I’m most proud to see is that Bitcoin is poised to secure the 16th consecutive green weekly Heikin Ashi candle:
This is the longest streak since the 16-week streak between October 2020 and January 2021, though the price trajectory during the current streak is underwhelming relative to the last one. Personally, I expect that to change.
I’ll reiterate:
Spot ETF approvals
Halving in 101 days
Disinflationary rate cuts starting in Q3 2024
Seems bullish.
Best,
Caleb Franzen
DISCLAIMER:
This report expresses the views of the author as of the date it was published, and are subject to change without notice. The author believes that the information, data, and charts contained within this report are accurate, but cannot guarantee the accuracy of such information.
The investment thesis, security analysis, risk appetite, & timeframes expressed above are strictly those of the author and are not intended to be interpreted as financial advice. As such, market views covered in this publication are not to be considered investment advice and should be regarded as information only. The mention, discussion, and/or analysis of individual securities is not a solicitation or recommendation to buy, sell, or hold said security.
Each investor is responsible to conduct their own due diligence and to understand the risks associated with any information that is reviewed. The information contained herein does not constitute and shouldn’t be construed as a solicitation of advisory services. Consult a registered financial advisor and/or certified financial planner before making any investment decisions.


Nice post, Caleb!
Agree it's amazing how a small pullback in price can change investor mood so much. I've been doing capital markets research for 20 years now, and can't recall a time when emotions get so charged either bullish or bearish. I blame social media!
Crazy how those stock investors involved with the survey are unable or unwilling to zoom out and see the bigger picture. When you put the data like you do, that's super bullish.