Bears Are In Shambles
Investors,
The market has rallied back. Bears are in shambles. Some bulls are even scratching their heads. All I know is that stocks don’t go up in downtrends, and stocks have been rising since October 2022 and managed to regain their upward momentum over the past week and a half. While I flipped defensive over the past five weeks, based on an objective review of market internals and technical analysis, I continued to reiterate that nothing about my bullish thesis had changed.
Macro data was resilient. Disinflation was persistent. The uptrend was intact.
The selling pressure that ensued from the YTD highs, in my view, was largely due to two things:
Stronger than expected U.S. economic data
Bullish investor sentiment reached extremes
After gaining nearly +21% in four months, the S&P 500 experienced an orderly, healthy, and normal consolidation. As of right now, the maximum drawdown from the YTD highs to the recent local lows was -5.85% from wick to wick. If we measure the decline from daily close to daily close, the max drawdown was -4.75%.
Either way you look at it, the decline was minimal relative to the YTD price action.
As of Friday’s close, the S&P 500 is up +17.7% YTD. Even the equal-weight version of the index is up +6.6% YTD, on track to outpace the historic performance of the S&P 500’s calendar year return since WW2. While I got stopped out of my short-term trades in mid/late-July (screenshot below), I used the market pullback as an opportunity to DCA into long-term portfolios.
I purchased 29 different long-term positions, ranging from individual stocks to ETF’s:
Literally one sell order in a sea of buy orders. If you want to know exactly what I’ve been buying, read this report:
This edition of Cubic Analytics will be slightly unique because I’m officially taking my first mini vacation since October 2022, starting from September 2nd through 5th. Like I said, a mini vacation. Everyone probably recognizes my obsession with macro and markets at this point, so I can’t stay away for long. I’ll be reuniting with my best friends who I haven’t seen since May 2022 in Barcelona before returning back to Bucharest solo. If anyone has recommendations in Barcelona, don’t hesitate to reach out. Also, if you live in Barcelona, it would be a pleasure to meet you in person!
Because I can’t publish one free report and one premium report this weekend, this report will be a hybrid with the macro section available for everyone while the stock market & Bitcoin sections are exclusive for premium members. I hope you understand.
Macroeconomics:
This week was jam-packed with macro data for the United States, which included the following reports, among others:
Job Openings & Labor Turnover Survey (JOLTS).
S&P Case-Shiller Home Price data.
Consumer confidence.
ADP Private Payrolls.
Revised estimate for Q2 2023 Real GDP Growth in the United States.
Initial unemployment claims.
Personal Consumption Expenditures (PCE).
Nonfarm Payrolls (NFP), which includes the unemployment rate, wage growth, & the labor force participation rate.
First of all, I want to give a shoutout to the team at Microsectors for their ongoing support of Cubic Analytics! They’ve been all over earnings season and sharing fantastic market data on Twitter, so I’d highly encourage you to follow them there. If you like what you see, dig into their various investment products and see if any fit your criteria! Given the recent decline in real yields over the past week or two, I’m heavily considering going long gold miners with their leveraged product $GDXU.
Since I’m not here to report the news and my objective is rather to analyze the news & data, I’m going to assume that most people saw the headlines and want to hear my key takeaways.
So let’s do it.
Regarding the labor market, first & foremost, data confirms that the U.S. workforce is still resilient & dynamic. I probably sound like a broken record at this point, referring to the labor market as “resilient & dynamic” for the past 18+ months, but it’s true. While we can identify pockets of weakness or periods of deterioration, the labor market has continued to flex its muscles and prove why the U.S. economy is still in the spot light on the global economic stage. However, I do want to note that the data we received this week, on the aggregate, appears to show some softening of the labor market. To be clear, soft ≠ weak or bad.
Job openings decreased, but are still at historically elevated levels of 8.82M.
ADP private payrolls decreased, but are still above historic norms.
Initial unemployment claims decreased and came in below estimates.
NFP results were below prior & estimates, with prior month data being revised lower.
On net, the labor market is moderating & normalizing after being historically tight. This is exactly what the Federal Reserve wants to see in order to achieve their dual-mandate. They’ve openly expressed their desire to cool down the labor market and bring inflation lower. Miraculously, inflation has moderated significantly despite the resilient nature of the labor market. With this latest round of data showing a cooling, both of the Fed’s desires are being achieved.
Notably on inflation, the comparison between the quits rate from the NFP data and the YoY CPI inflation rate rose to the top of my highlights this week. With the quits rate moderating once again, falling from 2.6% to 2.4%, the implication is that inflation will continue to decelerate in the months ahead:
A similar takeaway can be seen from the NFP data on Friday, which reported the total number of hours worked. While the data ticker higher by +0.1 hours, we can clearly see that the trend in total hours worked is on the decline. Logically, this datapoint also has a clear connection with inflation and reaffirms that we should expect to see broad-based disinflation in the months ahead.
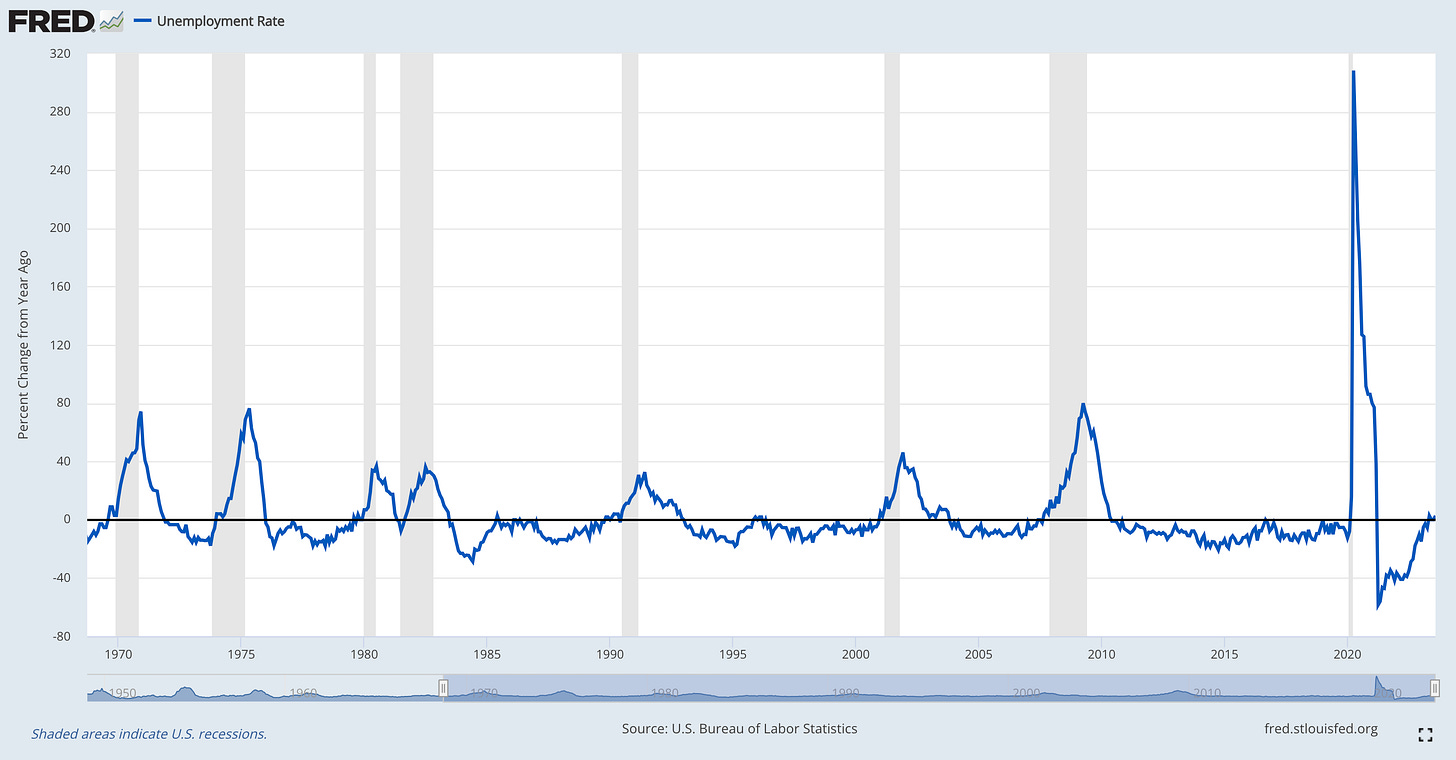
One of the big conclusions from the NFP data is related to my own independent analysis that tracks the rolling YoY rate of change in the unemployment rate. With the unemployment rate edging higher to 3.8% in August (vs. 3.6% in July), this was one of the bigger MoM jumps we’ve seen lately. However, the unemployment rate was “only” 3.7% in August 2022, meaning that we just witnessed a minimal increase of +2.7% in rate of change terms.
The reason why I like this measure so much is because it has an extremely solid track record of indicating whether or not the economy is deteriorating and slipping into a recession. As you’ll notice when the rate of change flips from negative (meaning that the current unemployment rate is lower than it was exactly one year ago) to positive, the U.S. economy has typically entered into a recession. While there are a few exceptions, like the mid-1990’s, no indicator is perfect. Therefore, we must continue to take this data with a grain of salt and not rely on it exclusively as a measurement of economic health.
Regarding macro, everything revolves around how labor market data influences inflation and how both of these dynamics will influence monetary policy. Based on the labor market data, in addition to softer GDP growth than initially expected, odds of Federal Reserve policy have shifted over the past week:
September 2023 meeting: 89% probability of pause vs. 80% measured last week.
November 2023 meeting: 53% probability of pause vs. 44% measured last week.
As I hinted to earlier, GDP data for Q2 was revised lower and came in below estimates; however, real GDP growth is still chugging along at a respectable pace. The revised data came in at +2.1% real GDP growth (which is adjusted for inflation) from the originally reported +2.4% growth rate. Once again, the Federal Reserve is likely encouraged by this data — the economy is growing slower & the labor market is showing signs of softness.
On net, this is disinflationary, despite the upticks we saw in CPI, PPI, & PCE in July.
Additionally, new data for the housing market was published to reaffirm that Shelter is likely going to decelerate substantially over the coming 12 months. Apartment List updated their national rent report, citing that rents declined by -1.2% YoY in August.
Apartment List’s research team stated that “seasonal trends suggest that monthly rent growth will continue to slow for the remainder of the year, and it’s possible that annual rent growth will sink further into negative territory in the months ahead.”
Given that Shelter is 35% of headline CPI and 41% of core CPI, and lags the actual housing/rental market by roughly 12 months, this means that the largest component of the inflation data is likely poised to decelerate substantially in the months & quarters ahead. In other words, expect more disinflation driven by Shelter, softening labor market data, and a broad-based deceleration in Services inflation.


