


Am I... Bearish?

Investors,
An important signal has only flashed twice since the start of 2020, with a third signal flashing right now. Specifically, the S&P 500 made a higher high while the ratio of SPY/TLT made a lower high.
⚫ S&P 500 (SPX)
🔵 S&P 500 relative to Treasuries (SPY/TLT)
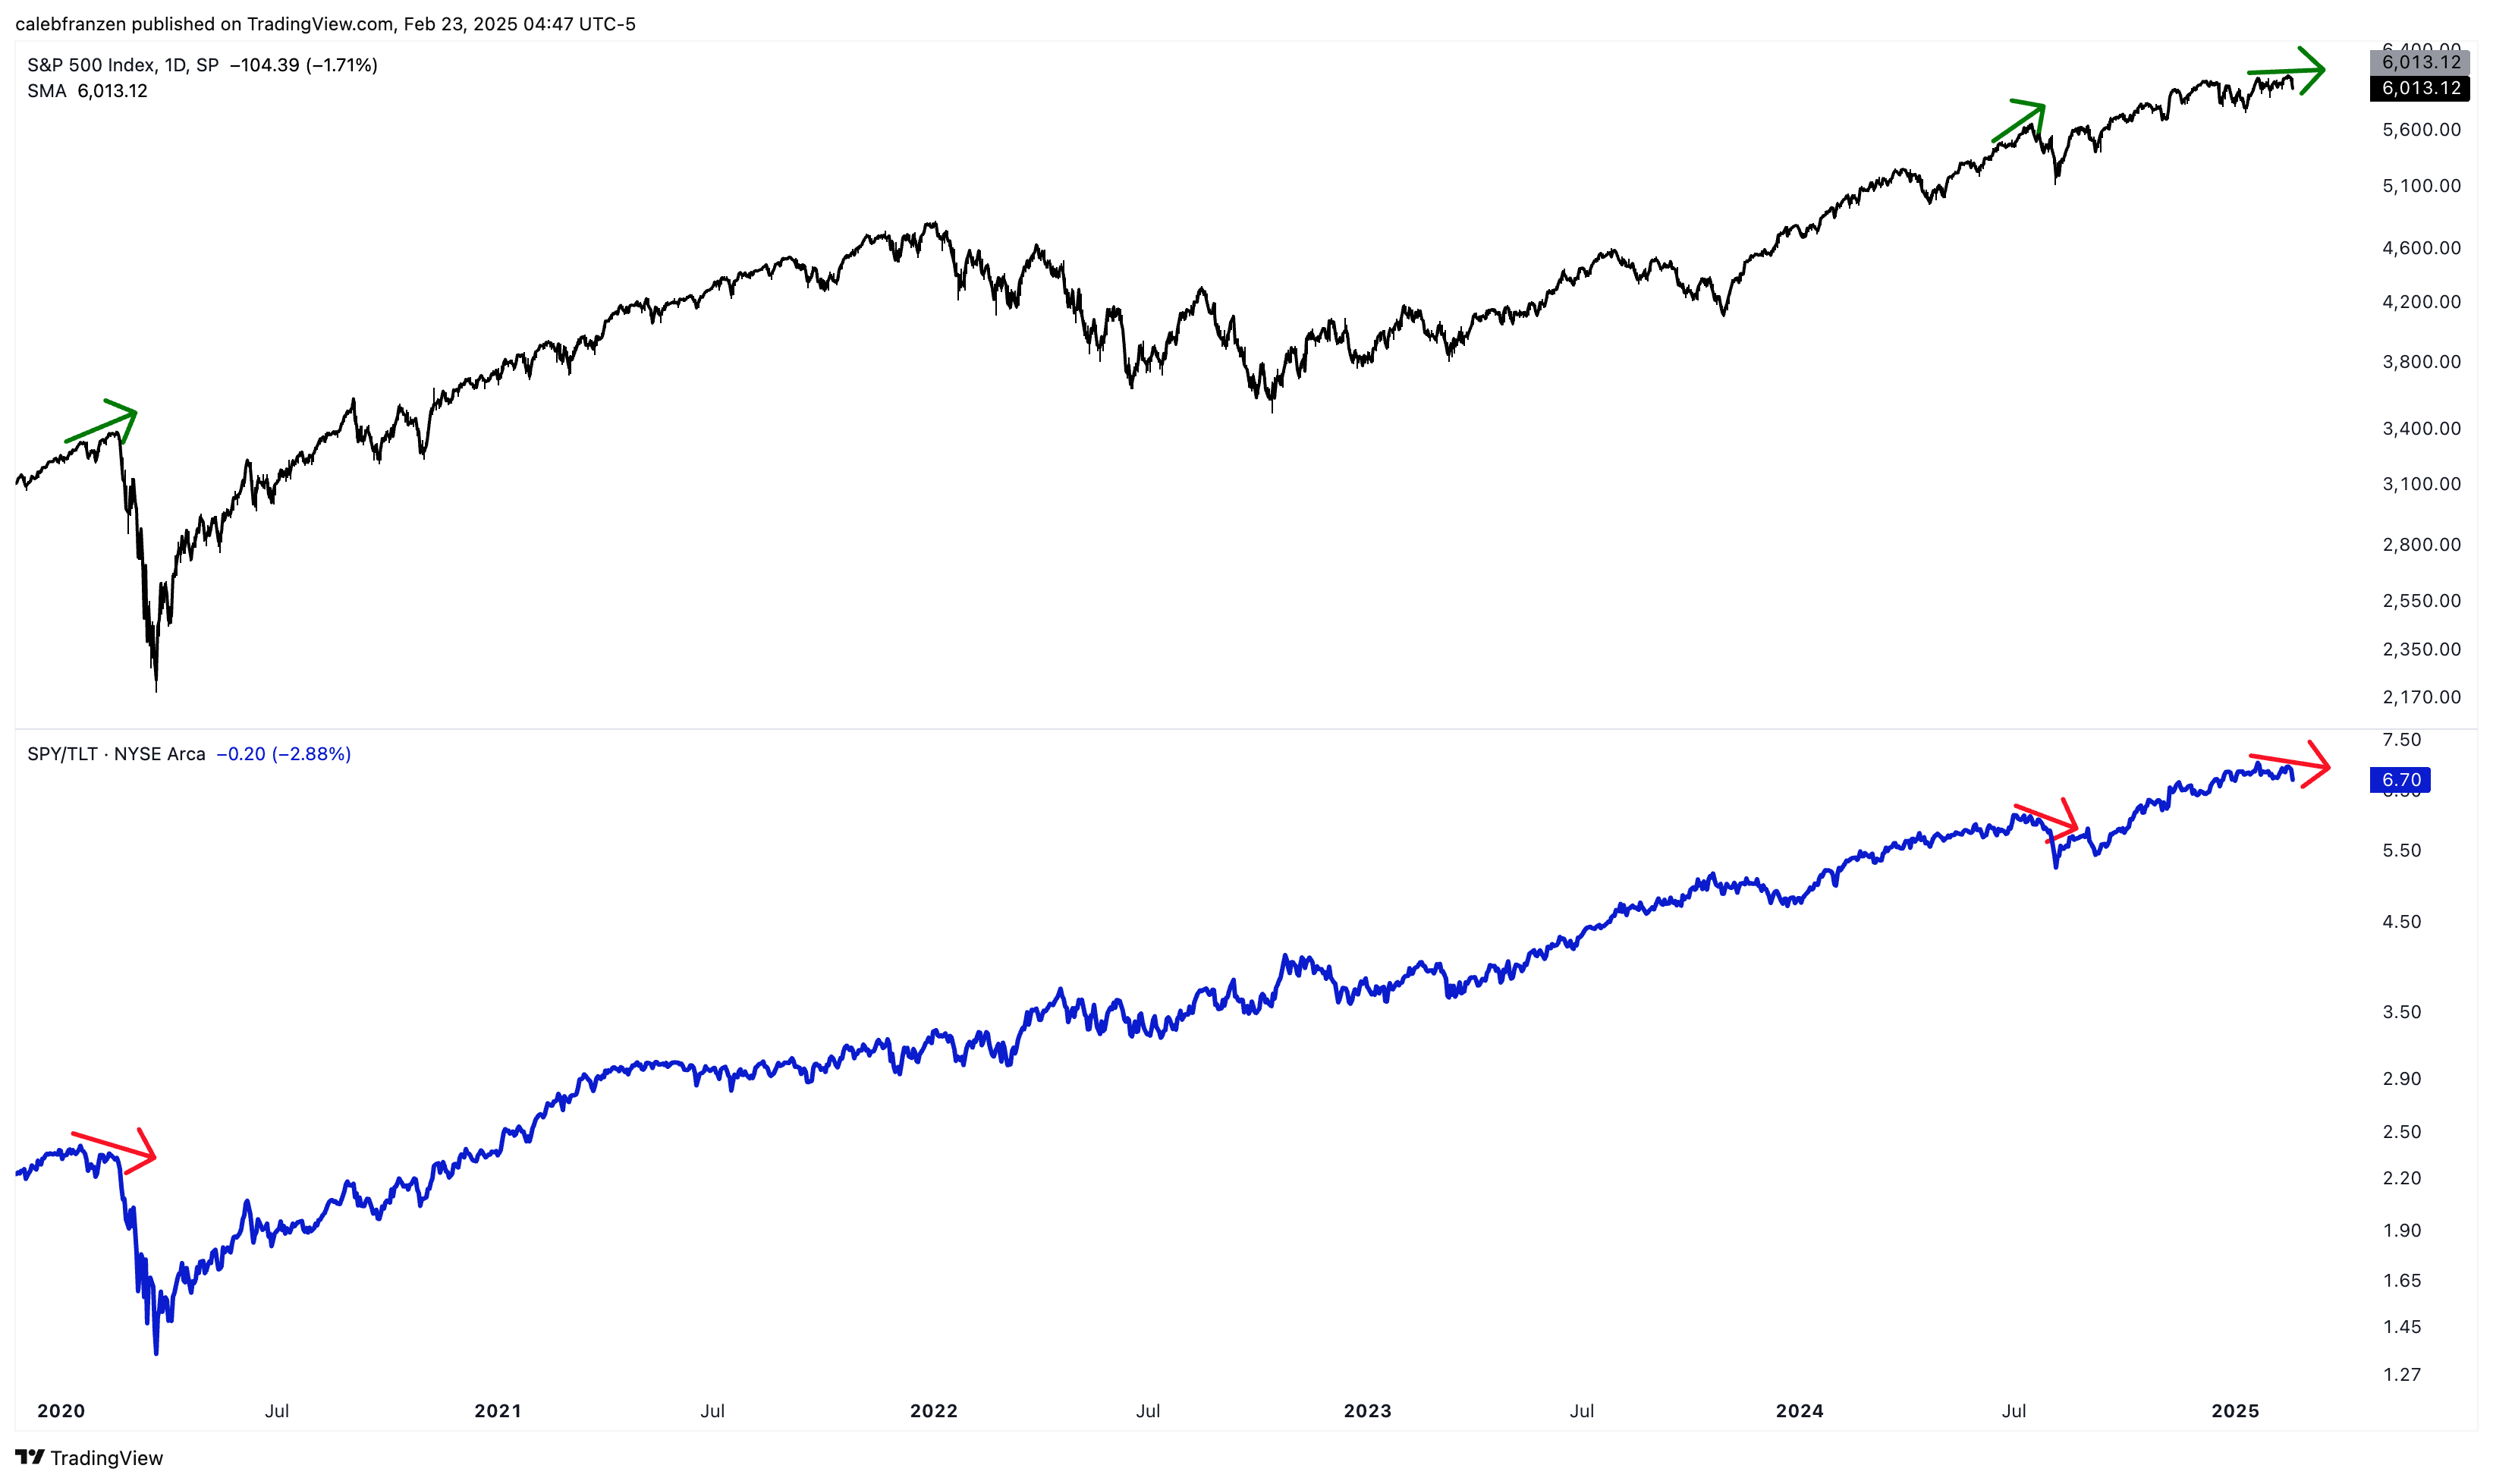
While there was a small divergence in July 2024, which produced new ATHs after a brief (but significant) selloff going into August 5th, the current signal is very different than typical behavior that we’ve seen during this bull market.
I don’t think it’s wise to make a market-wide forecast based on a single chart, but the concern that I have right now is that multiple important risk-off signals have flashed in the past week…
Equal-weight discretionary vs. staples (RSPD/RSPS) failed to make a higher high:

High beta stocks vs. low volatility stocks (SPHB/SPLV) failed to make new highs:

Credit spreads diverged from the S&P 500 and made higher lows (top) while the CBOE Volatility Index $VIX (bottom) has been making higher lows Since December 2024:

Factually, all of these charts, on the aggregate, are behaving differently than any other point during this bull market. To me, that suggests a potential (key word) regime change and a shift into a more sustained correction or even a bear market.
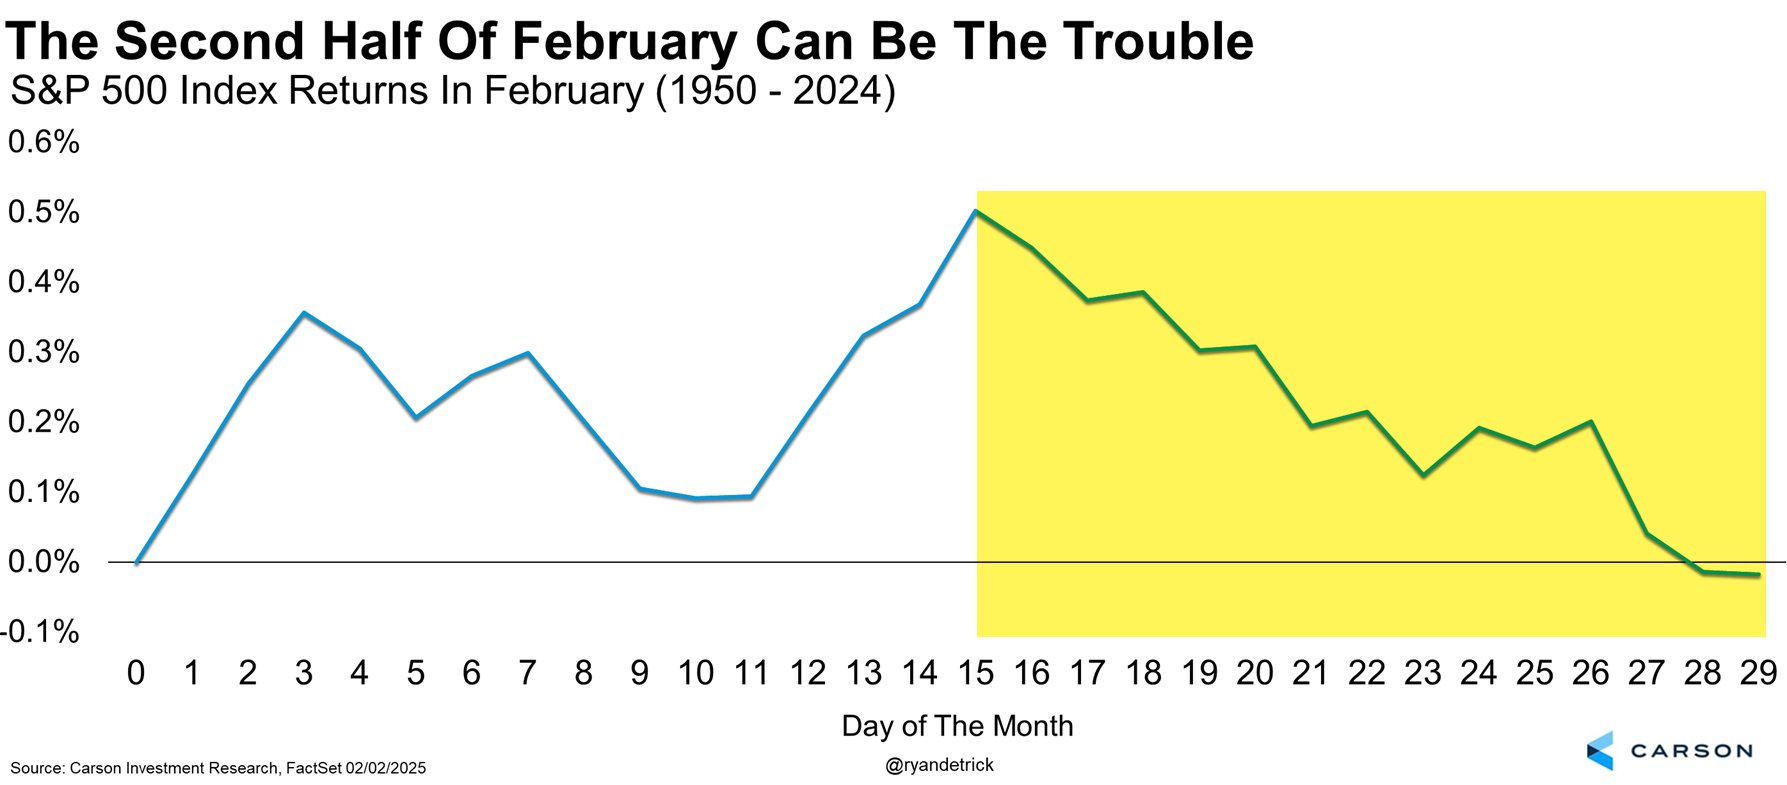
Given that seasonal dynamics are pointing to a weak second-half of February, the market could be facing an uphill battle from a variety of different factors.
So am I ringing the alarm bells & getting bearish for the first time since 2022?
Am I selling all of the assets that I own and rotating into cash?
Am I going to short the market or buy puts or use leverage?
The answer to all three questions is “no”.
But here’s what I am going to do…